

The breach of this trading band energized the recent surge, as $XRP had been trading below it since a significant sell-off in June. The cryptocurrency also surpassed its swing highs from May and July, effectively terminating a pattern of lower highs highlighted in the daily chart.
On the 4-hour chart, $XRP peaked at $1.43 before retreating to $1.31 and subsequently bouncing back. Buyers stepped in to support this dip, allowing the token to regain traction in the upper $1.30s.
The momentum of the rally has continued to build. The 4-hour Awesome Oscillator surged to 0.2332, marking its highest point on the chart, indicating that short-term buying pressure is currently outweighing the recent downward price trend.
What’s fueling the $XRP surge?
This rebound followed President Donald Trump’s meeting with notable figures in the crypto space, including Ripple CEO Brad Garlinghouse, on August 19. Trump urged Congress to enact what he termed a “fair version” of the Digital Asset Market Clarity Act.
The legislation aims to create a federal framework for digital assets, redistributing regulatory responsibilities between the Securities and Exchange Commission and the Commodity Futures Trading Commission. However, its passage remains uncertain, as Senate Republicans will require Democratic votes to attain the necessary 60 votes.
$XRP is particularly sensitive to this discussion due to Ripple’s prolonged battle against the SEC regarding its token sales. A clearer regulatory framework could alleviate some of the uncertainties affecting U.S. exchanges and companies utilizing digital assets, although Trump’s statements don’t ensure the bill’s success in Congress.
Additionally, the overall liquidity conditions in the market bolstered the cryptocurrency sector. The U.S. Treasury announced an increase in the maximum size of planned buybacks for certain long-term government bonds from $2 billion to at least $4 billion per session. This announcement initially exerted downward pressure on long-term yields and the dollar, which helped attract demand for high-risk assets, although Treasury yields rebounded later.
Also contributing to the price movement of $XRP were targeted purchases. Crypto analyst Ali Martinez, known as Ali Charts, pointed out that wallets identified as whale accounts acquired over 300 million $XRP within a 96-hour window. His analysis indicated that these large holders increased their combined holdings from around 16 billion to nearly 16.3 billion tokens.
Ripple, in collaboration with Clearpool and Cicada Partners, has also announced intentions to develop an institutional lending market on the $XRP Ledger. This planned system would utilize the RLUSD stablecoin along with XRPL’s upcoming lending features and single-asset vaults.
This credit platform is still in the developmental phase and will depend on necessary amendments to XRPL. Thus, it should be viewed as a potential future catalyst rather than an immediate source of lending activity.
$XRP technical indicators turn optimistic
The daily chart has shown a bullish Supertrend reversal as $XRP crossed the $1.14 mark. This indicator remained bearish for much of the token’s decline from above $2.00 back in January.
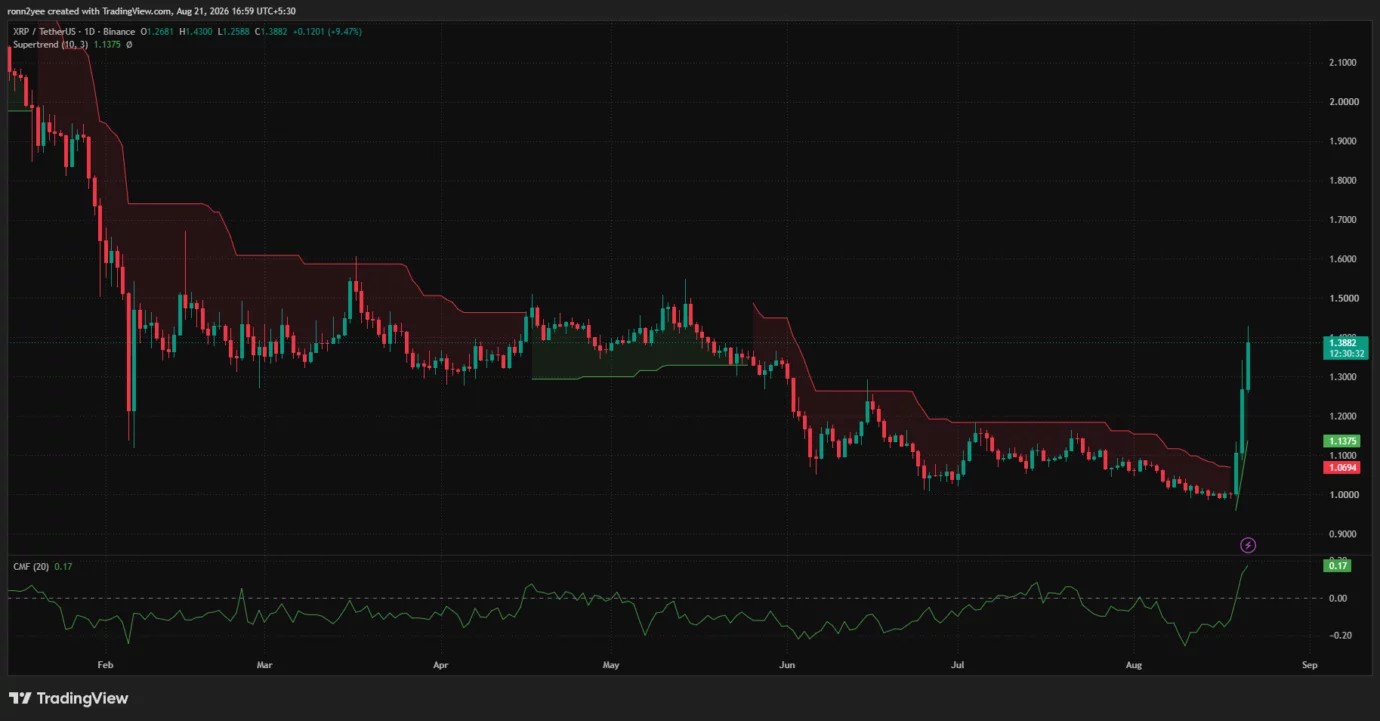
$XRP’s daily Chaikin Money Flow increased to 0.17, signaling that buying volume is surpassing selling volume. This bullish sentiment supports the recent price breakout with robust capital inflows.
On the 4-hour chart, $XRP is significantly above its key moving averages. The 20-period simple moving average stands at $1.12, while the 50-, 100-, and 200-period averages fall between $1.04 and $1.07.
The considerable gap between market price and these averages underscores the strength of the breakout but also heightens the risk of short-term fluctuations. A rapid increase could leave little immediate support just beneath the price level if buyers choose to realize profits.
The first support zone is identified between $1.34 and $1.35, where $XRP consolidated following its initial spike. A deeper retracement might test the $1.26 mark, which represents the upper end of a previous resistance range.
The daily Supertrend level near $1.14 denotes a broader bullish invalidation zone. If this level is breached, it could pull $XRP below its breakout structure, increasing the risk of a correction towards the cluster of moving averages around $1.04–$1.07.
Liquidation map indicates $1.48
According to CoinGlass’s three-day $XRP liquidation heatmap, the price has traversed several clusters of short liquidation leverage between $1.10 and $1.40. These forced closures have likely amplified buying pressure, as bearish traders rushed to buy $XRP to cover their positions.
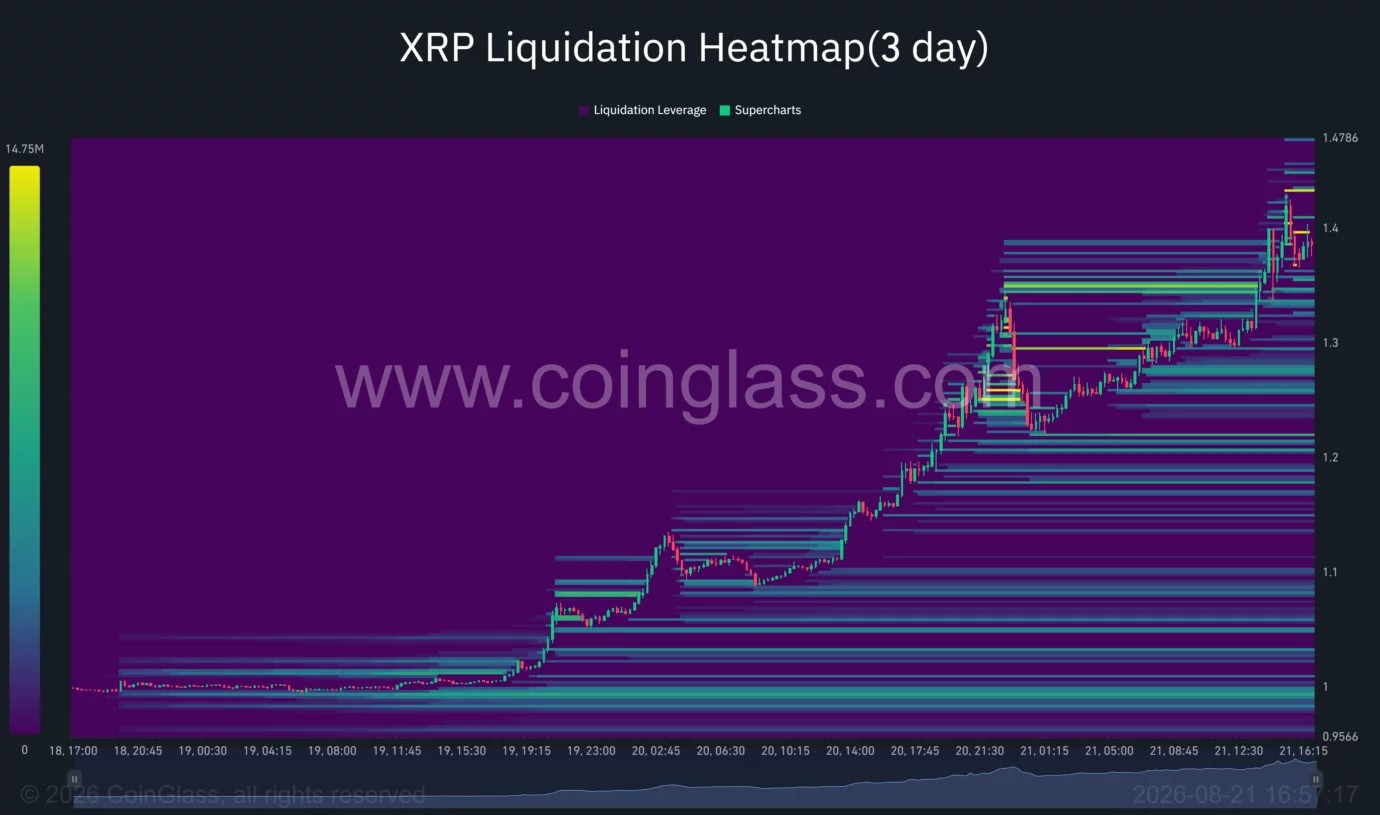
The remaining liquidity is focused above the market around $1.43–$1.45, with another significant cluster near $1.47–$1.48. A solid move beyond the intraday high could propel $XRP towards these levels as exchanges close additional leveraged short positions.
The heatmap also reveals substantial liquidity bands below the price, with the closest clusters found at $1.34, $1.29, and $1.26, while a denser concentration lies between $1.20 and $1.22.
Markets generally gravitate towards areas dense with leveraged positions, although a liquidation map does not dictate market direction. If $XRP fails to surpass $1.43, long positions opened during the rally might face pressure if a retreat occurs towards the lower liquidity clusters.
Can $XRP sustain the breakout?
A daily close above $1.40 would bolster the bullish sentiment and set $1.48 as the next pivotal technical and liquidity target. Clearing this area could pave the way for a move towards $1.50, a key psychological level that previously witnessed several price reversals in early 2026.
Nonetheless, this rally carries inherent risks. $XRP has surged over 35% from its weekly low in a short timeframe, all while the White House initiative hinges on legislation that is likely to face tough negotiations in the Senate.
Ongoing whale accumulation, positive money flow, and support above $1.26 would offer solid proof that this advance transcends a mere short squeeze. Conversely, failure to maintain that former resistance threshold could expose $1.20 and potentially the daily Supertrend level near $1.14.