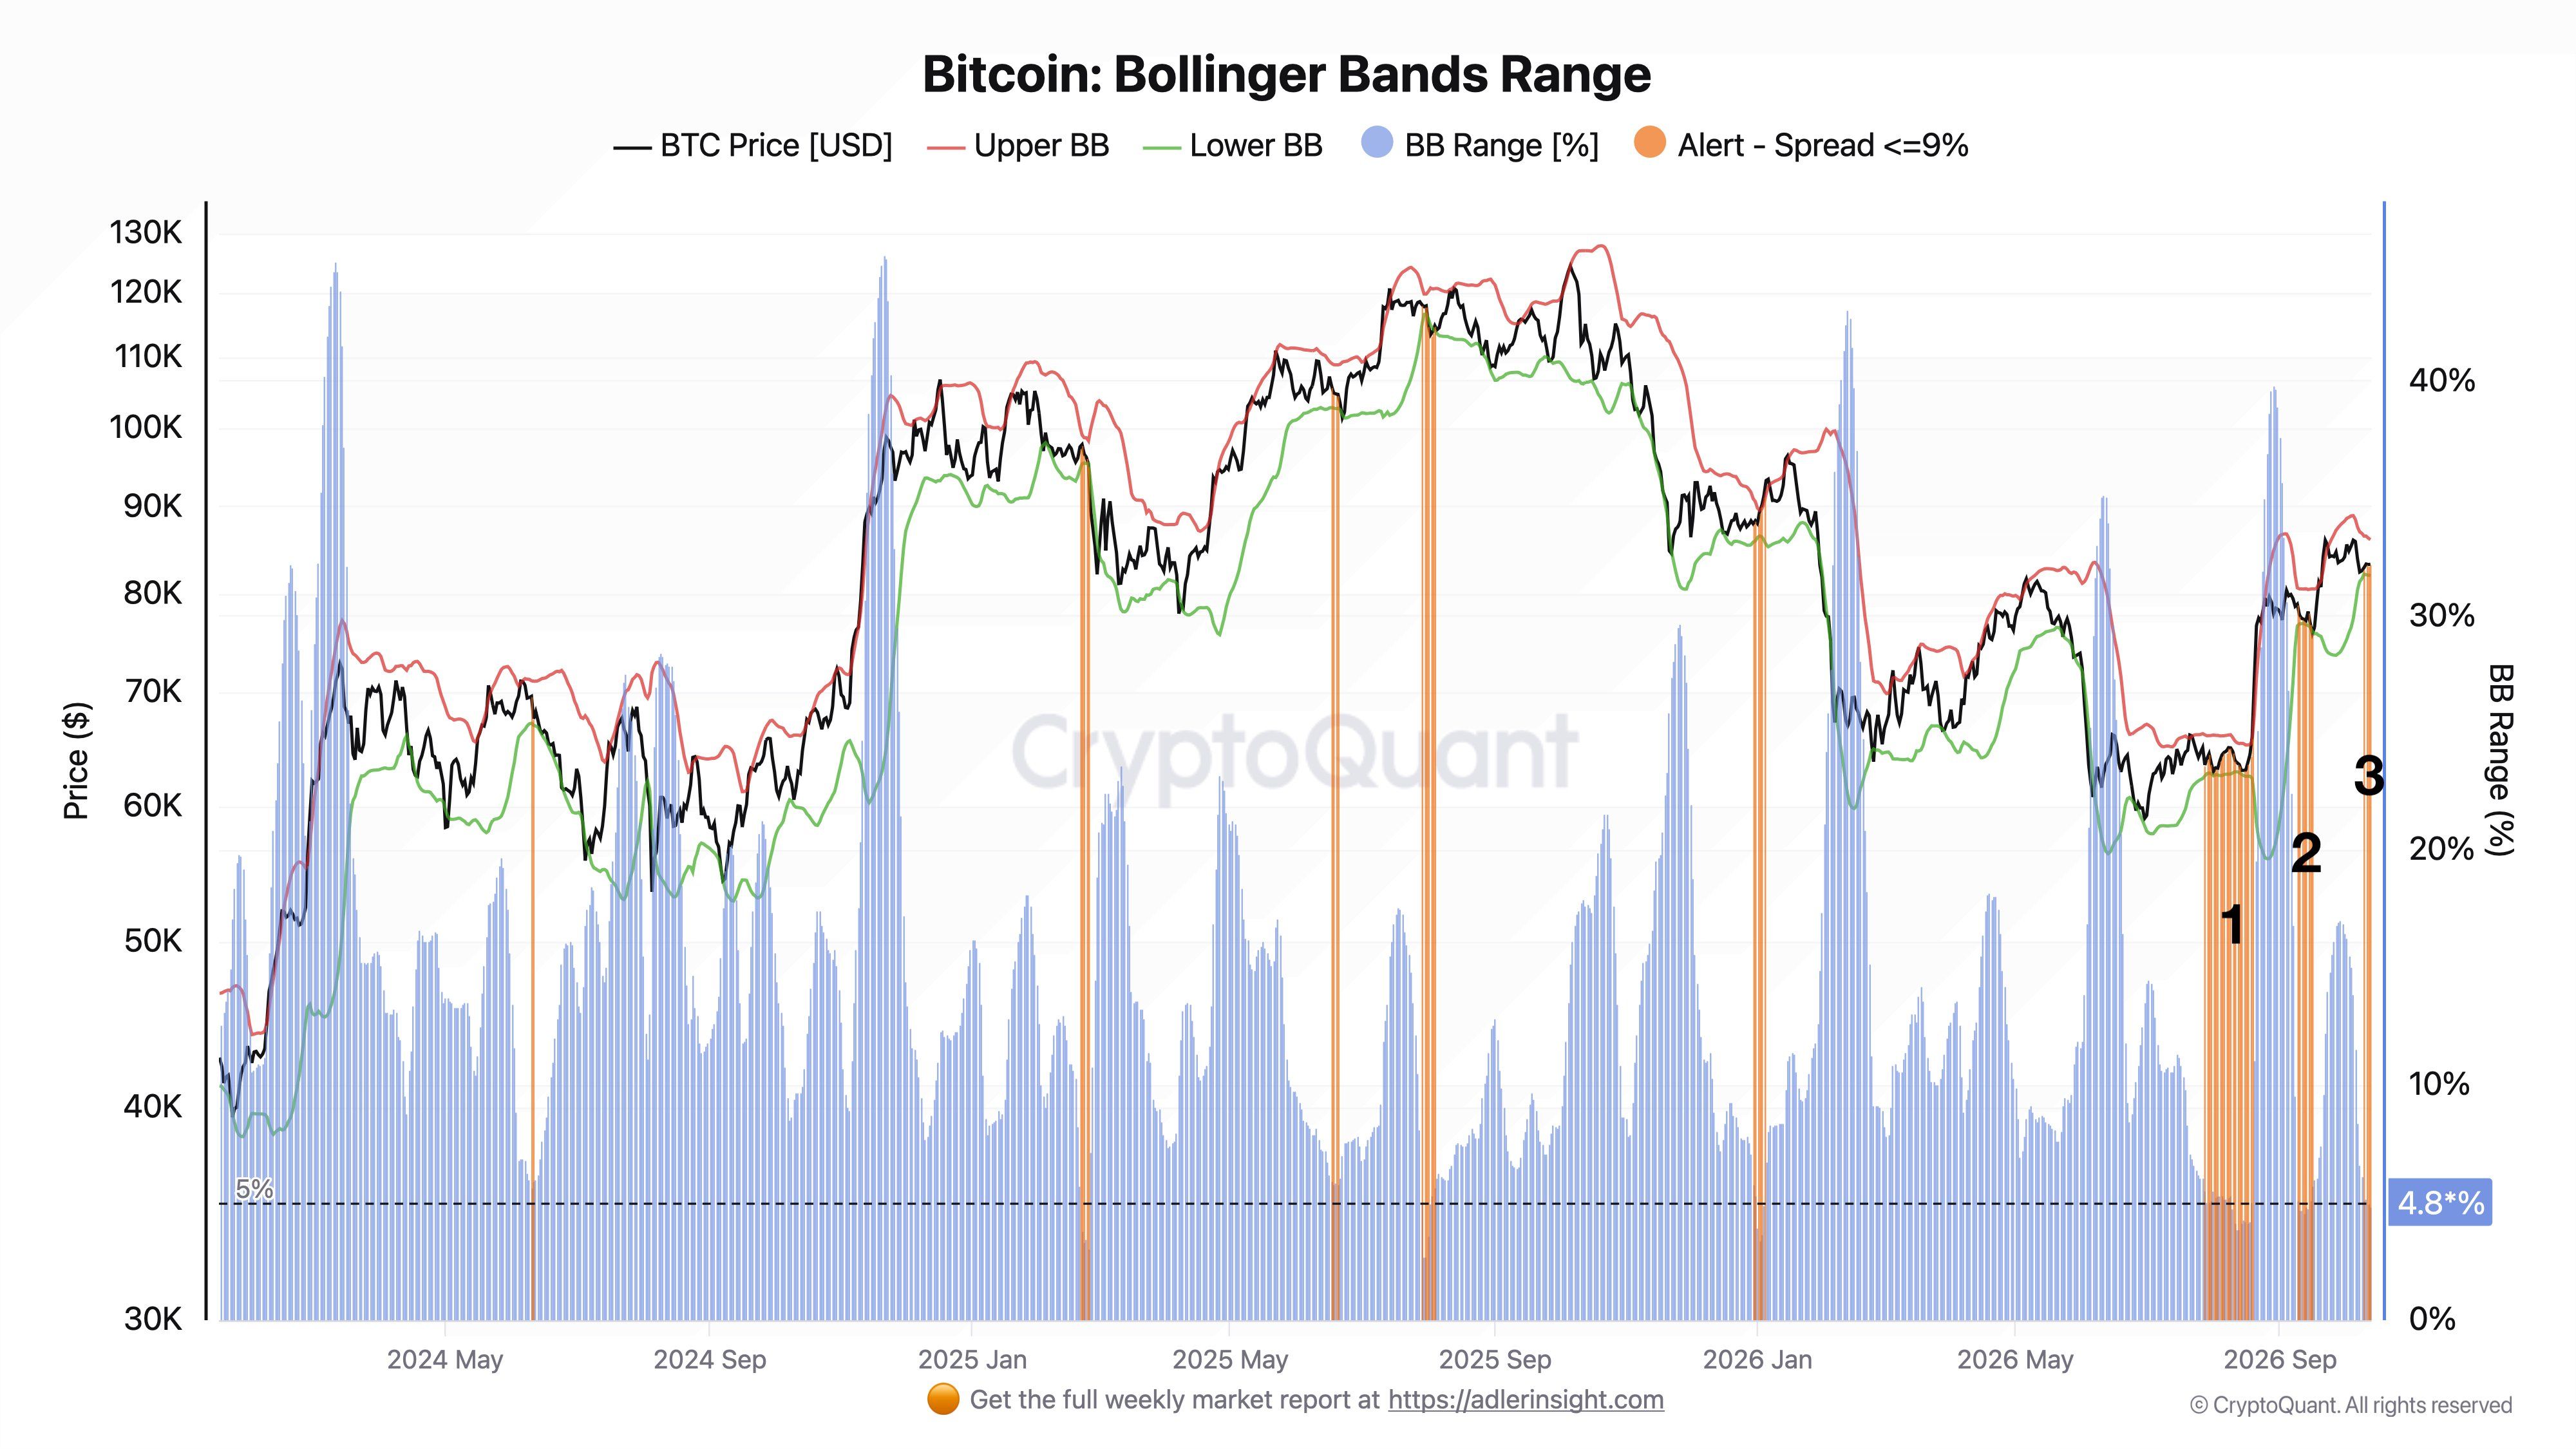
The width of BTC’s Bollinger Bands has contracted to 4.9%, down from 11.6% within the past week, indicating a phase of market compression with no distinct breakout trajectory.
- Analyst Axel Adler Jr. highlighted $86,000 and $81,900 as critical price points that could determine Bitcoin‘s next movement.
- Data from CryptoQuant revealed that long-held Bitcoin assets are becoming more dynamic, but experts warned that this uptick doesn’t automatically indicate selling.
- Glassnode attributed the selling activity last week to traders involved in futures and ETF holdings, while U.S. spot Bitcoin ETFs saw inflows of $175.62 million on Tuesday.
On Wednesday, Bitcoin (BTC) fluctuated within its narrowest trading range since mid-September, as volatility diminished and analysts observed mixed indicators beneath the surface.
The tightening of the Bollinger Bands doesn’t provide a definitive signal regarding future price movements, yet increased activity from long-term holders and the resurgence of inflows into spot Bitcoin ETFs imply that the market might be approaching a pivotal moment.
Focus on Bitcoin’s Volatility Squeeze: $81,900–$86,000 Range
According to analyst Axel Adler Jr., the current market squeeze offers no clear guidance. “While narrow bands indicate market compression, they don’t specify the direction or timing of future moves,” he noted in his morning analysis.
Adler monitored the squeeze using Bollinger Bands, which assess how much the price deviates from its recent average. The bandwidth decreased to 4.9% of the average price on Tuesday, compared to 11.6% the previous week. Additionally, Bitcoin’s price decreased from approximately $85,800 to around $83,200 during this period, Adler Jr. reported.
He established the upper limit of the trading range at $86,000 and the lower limit at $81,900. A sustained price above $86,000 would indicate a potential upward trend, while a drop below $81,900 would suggest a downward movement.
Adler’s Volatility and Flow Index also indicated a cooler market condition, registering at 1,768, below its one-year average of 1,828. This index takes into account price fluctuations, exchange flows, and the overall balance of buying and selling in the market.
The price of Bitcoin slipped by 0.2% over the past 24 hours, remaining above $83,000. Meanwhile, retail sentiment on Stocktwits regarding BTC remained bearish, with conversation levels remaining low over the previous day.
Shifting Trends Among Older Bitcoin Holdings
An analyst from CryptoQuant noted an increase in activity among older Bitcoin holdings. Coins that have been held for one to three years, as well as those older than three years, showed renewed activity from late September, coinciding with Bitcoin’s rise from the mid-$70,000s to the mid-$80,000s. The analyst pointed out similar activity spikes in January and February, and again from late July to mid-August. “Increased movement does not necessarily translate to selling or profit-taking,” remarked a contributor from CryptoQuant.
The recent security incident involving Ledger may have also contributed to this trend. The analyst suggested that it prompted users to transition their funds to a new Ledger signer with an updated recovery phrase, potentially exacerbating these movements in the upcoming days.
Factors Behind Last Week’s Market Dip
According to Glassnode’s most recent weekly report, the sellers during the previous week were primarily perpetual futures traders and ETF holders. The U.S. spot Bitcoin ETFs saw net outflows close to $681.1 million last week, based on SoSoValue data.
However, ETF buyers returned on Tuesday, leading to inflows of $175.62 million, marking the largest single-day inflow since October 2, following a $65.40 million outflow on Monday.
Options traders acquired protective positions, as indicated by the 25-delta skew which surged from 2.1% to over 4.46%. Other indicators of new capital entering the market remained positive as well.
Glassnode also reported that the monthly variation in realized capitalization, a metric reflecting capital held in Bitcoin, increased from 1.1% to 1.2%. Over 70% of Bitcoin supply continued to be in a profitable position.
The current squeeze followed a recent strong recovery driven by spot buyers this week.
Read also: Coinbase Issues Warning on Quantum Threat to Bitcoin, Highlights Challenges for Satoshi-Era Coins
For updates and corrections, email newsroom[at]stocktwits[dot]com.