

Overall, the market is experiencing a recovery today after a week of decline.
The downturn on Thursday resulted in $948 million worth of liquidations, with 90.6% coming from long positions, according to CoinGlass data. A liquidation occurs when a leveraged trade is forcibly closed due to losses that deplete the collateral, and a long position anticipates price increases, creating a cycle of selling pressure.
Looking at the daily chart, Bitcoin is encountering significant resistance at $81,603, a threshold traders examine to predict where retracements may attract buyers based on previous major highs and lows. The dip on Thursday reached as low as $79,711, falling below this resistance level and the 50-day exponential moving average (EMA), presently at $80,407, which emphasizes more recent price movements.
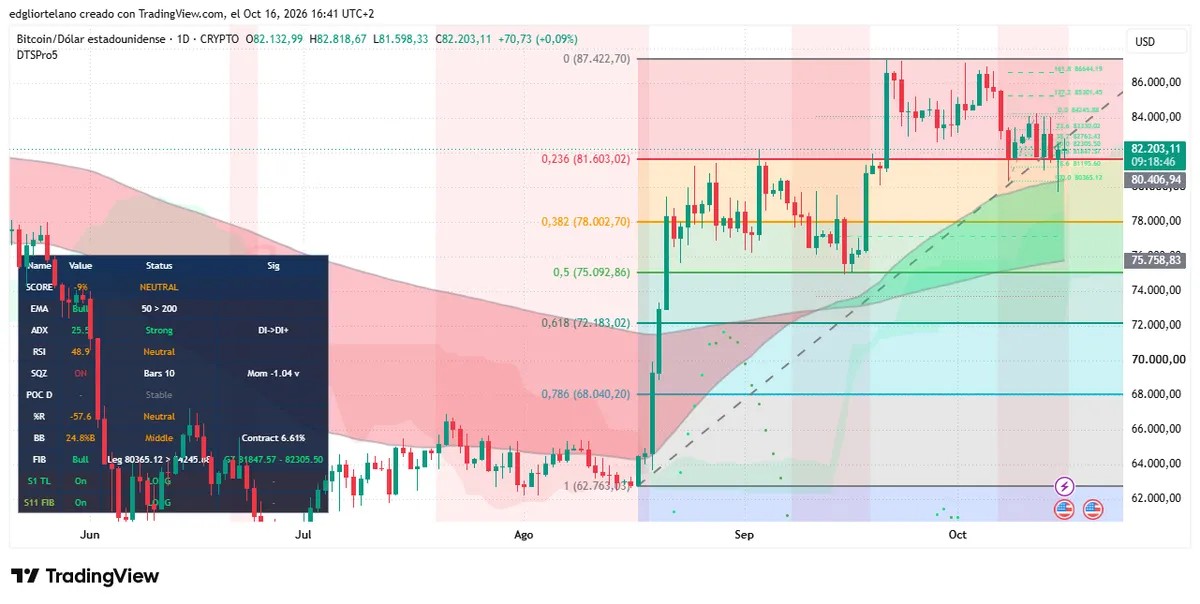
The 200-day EMA is currently positioned at $75,759, roughly 8% below Bitcoin’s present value, and with the 50-day EMA above it, the long-term trend remains optimistic.
The Average Directional Index (ADX), which assesses the strength of trends irrespective of direction, shows a reading of 25.5, just above the 25 mark that indicates a trend is confirmed, with sellers (DI-) currently outpacing buyers (DI+). The Relative Strength Index (RSI), which measures momentum on a scale from 0 to 100, sitting at 48.9 is considered neutral but leans slightly towards sellers, with 70 indicating overbought and 30 indicating oversold conditions.
On Myriad, the prediction platform developed by Dastan, the parent company of Decrypt, traders currently estimate a 31% chance that Bitcoin will reach a peak of $87,500 by October, a decrease from 45% earlier this week. In another market, Myriad participants indicate there’s now a 43% likelihood that BTC will drop to $77,500.
The bullish outlook hinges on buyers maintaining the $81,603 level and closing above $84,246, which would pave the way for $85,301, $86,644, and the high of $87,423, ideally supported by a rising ADX.
The sideways trend would see Bitcoin fluctuating between the $80,365 swing low and $84,246. A bearish trend would initiate with a daily close beneath $81,603, leading to potential support levels at $80,407 and $80,365, followed by $78,003 and the zone between $75,759 and $75,093, where the 200-day EMA intersects with the 50% retracement level.
Disclaimer
The perspectives and insights provided by the author are solely for informational use and do not constitute financial, investment, or other types of advice.