

On October 20, Bitcoin’s value dipped by 1.2% within a 24-hour period, as diminished institutional interest and fresh selling pressure halted the positive trend observed last week.
Summary
- The value of Bitcoin dipped to around $81,730 on October 20, following weak demand for ETFs and selling pressures that kept BTC from maintaining levels above $82,000.
- Approximately $228.6 million flowed out of U.S. spot Bitcoin ETFs this past week, compounded by ongoing inflation concerns and uncertainty regarding the Federal Reserve’s next interest rate moves.
- Technical indicators, including the Ichimoku Cloud and Chaikin Money Flow, are signaling persistent bearish trends, with critical support levels identified at $81,144 and $80,000.
- The four-hour MACD shows signs of potential momentum improvement, but Bitcoin must reclaim values over $82,587 and subsequently $83,457 to facilitate a stronger upward movement.
As per reports from crypto.news, BTC was trading at $81,730.70 at the time of writing, having slipped from near $83,000. The cryptocurrency saw a temporary drop to about $81,200 but faced challenges in maintaining levels above $82,000 in subsequent attempts.
Bitcoin’s recent downturn comes after a challenging start to October, marked by worries over persistent U.S. inflation and ambiguity regarding the Federal Reserve’s next policy decisions, putting strain on investor confidence.
Consequently, BTC is now trading below several crucial resistance thresholds.
Weak Demand is Harming Bitcoin’s Price
The absence of institutional demand is alarming for Bitcoin stakeholders. U.S. spot Bitcoin ETFs noted about $228.6 million in withdrawals over the last week.
This follows nearly $681 million in outflows recorded the previous week. Although the rate of withdrawals has started to decline, it illustrates that investors are consistently reallocating their funds elsewhere.
According to its market evaluation published on October 19, the on-chain analytics company Glassnode indicated that the selling pressure responsible for Bitcoin’s early October drop had eased, yet there is insufficient demand from spot market participants and ETF investors to initiate a recovery.
The report highlighted that perpetual futures traders have primarily fueled the recent selling trend. Concurrently, ETF trading volumes have also slipped below typical ranges.
In the options market, traders continue to invest more in protective measures against further declines, with the 25-delta skew indicating rising concerns about potential further downturns.
On-chain activity has also declined during this period, with transaction fees and transfer volumes both dropping by roughly 10%. Meanwhile, the number of active addresses has remained relatively stable.
The latest statistics followed Bitcoin’s brief recovery on October 19, when BTC temporarily climbed above $82,000 amidst widespread fears of another market downturn.
Investor Anxiety Amid Inflation and Fed Uncertainty
Macroeconomic factors have significantly complicated Bitcoin’s recovery attempts, especially after the U.S. consumer price index climbed to 3.7% in September, exceeding market expectations of 3.6%.
This elevated inflation figure has dampened hopes that the Federal Reserve may ease its monetary policies in the near future.
Bitcoin remains susceptible to shifts in interest rate expectations, particularly when rising Treasury yields make interest-bearing assets more appealing compared to cryptocurrencies.
The upcoming Federal Reserve policy meeting is set for October 27 and 28, adding another crucial event for investors to consider before committing additional capital to the market.
Additional U.S. economic reports and corporate updates are also on the radar. The economic calendar from October 19 to 23 features earnings reports from Tesla and Meta, along with weekly jobless claims and U.S. oil inventory figures, any of which could influence market sentiments.
Previous assessments from crypto.news identified $82,000 as a critical threshold that must be maintained; otherwise, Bitcoin might slip towards the $76,000 level if selling pressure re-emerges.
Bitcoin Faces Risks on the Daily Chart
A look at the daily BTC/USD price chart shows that selling pressure persists, even as the cryptocurrency attempts to stabilize above $81,000.
According to the daily Ichimoku Cloud indicator, BTC was trading around $81,705, below the Tenkan-sen at $81,974 and the Kijun-sen at $83,457. The current positioning of the Tenkan-sen under the Kijun-sen indicates that bearish momentum is still influencing the daily trend.
As of now, Bitcoin is testing the lower boundary of the Ichimoku Cloud, with a critical level around $81,144. A decline below this could expose the $80,000 psychological support level, followed by the $77,500 to $78,000 range if selling pressure persists.
If Bitcoin can recover above $81,974, this would indicate the first sign of improvement, although the Kijun-sen at $83,457 remains the primary resistance level.
The daily Chaikin Money Flow indicator showed a reading of negative 0.10, indicating more selling pressure than buying pressure over its measurement period.
In contrast, other technical indicators for Bitcoin present a mixed outlook, with the 14-day relative strength index hovering near 47.69, signifying neutral momentum, while the exponential moving average composite maintains a bullish stance.
Short-Term Chart Displays Slight Positive Signs
However, on the 4-hour chart, Bitcoin exhibits early indications of improving momentum.
The Moving Average Convergence Divergence indicator displayed a MACD line of negative 31 and a signal line of negative 76, while the histogram stood at positive 45.
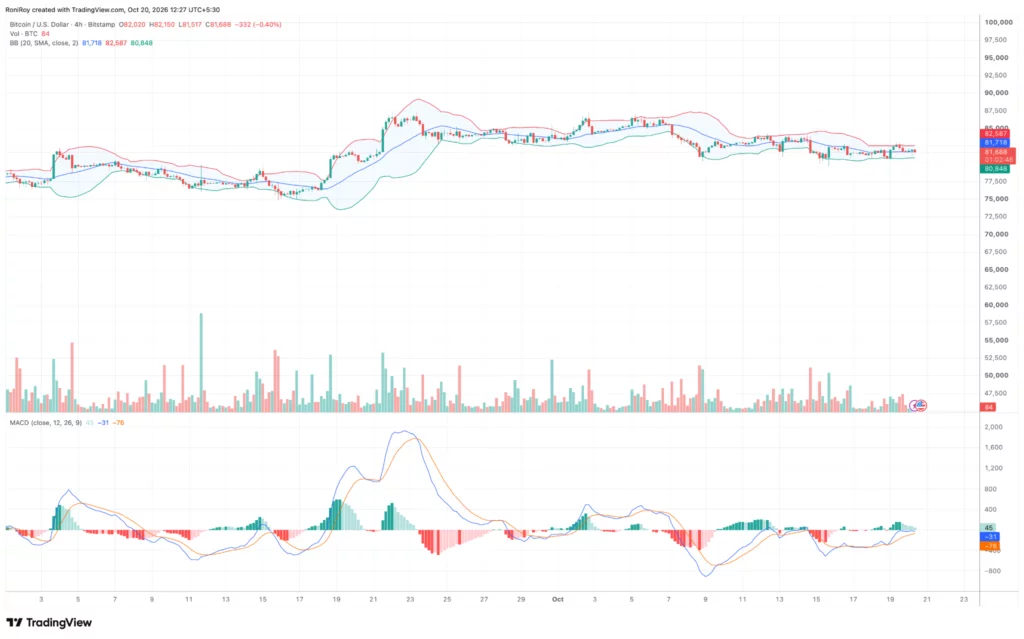
The MACD line has crossed above the signal line, which suggests a reduction in short-term bearish momentum. Nonetheless, both values remain below the zero level, indicating that the improvements are occurring within a weakened market framework.
Bitcoin is currently trading around $81,688, slightly under the middle Bollinger Band set at $81,718. The upper band is at $82,587, with the lower band at $80,848. A sustained recovery beyond $81,718 could pave the way for another attempt at $82,587, especially if the MACD histogram continues to show positive developments.
If surpassed, buyers may encounter resistance near $83,457, in line with the daily Ichimoku Kijun-sen.
Conversely, failing to reclaim the middle Bollinger Band could refocus attention on the lower band at $80,848.
A breach below this level would put the $80,000 psychological threshold under pressure, with the $77,500 to $78,000 area potentially becoming a target if selling escalates.
Analysts from Bitfinex have noted previously that $81,300 is a vital resistance level that has shifted to support. They stated that Bitcoin must recover above $84,000 to regain its upward momentum, a level lost during the early part of October.
Disclosure: This article is not intended as investment advice. The content provided on this page is for instructional purposes only.