

Bitcoin Faces Decline Following Strong US Employment Report
According to TradingView data, $BTC/USD has fallen below $75,000, a level not seen since mid-August. The overall cryptocurrency market cap has decreased by 0.5% for the day.
$BTC/USD one-hour chart. Credit: Cointelegraph/TradingView
US stock markets have rallied as investors capitalized on significantly lowered tech stock prices. At the time of writing, the S&P 500 rose by 0.6%, while the Nasdaq Composite Index saw an increase of 1.2%.
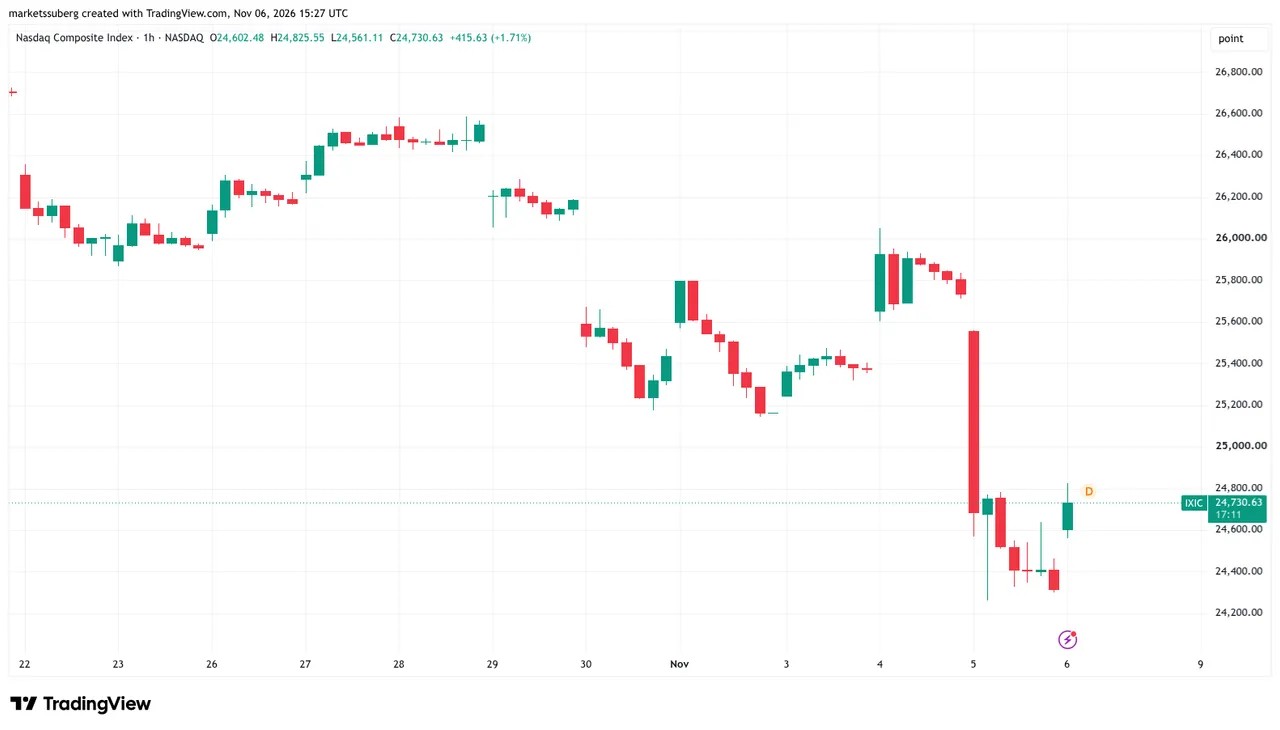
Nasdaq Composite Index one-hour chart. Credit: Cointelegraph/TradingView
Several technology stocks experienced even greater surges, with companies like SanDisk and Micron Technologies both climbing 6.3%.
On Friday, the US Department of Labor released nonfarm payroll data indicating that the economy added 165,000 jobs in October, significantly exceeding the projected 65,000. The previously reported 29,000 jobs for September were also revised upwards to 60,000.
“Job growth was evident in professional and business services, healthcare, as well as transportation and warehousing,” stated an official report from the US Bureau of Labor Statistics (BLS), noting the unemployment rate decreased to 4.1% from an anticipated 4.2%.
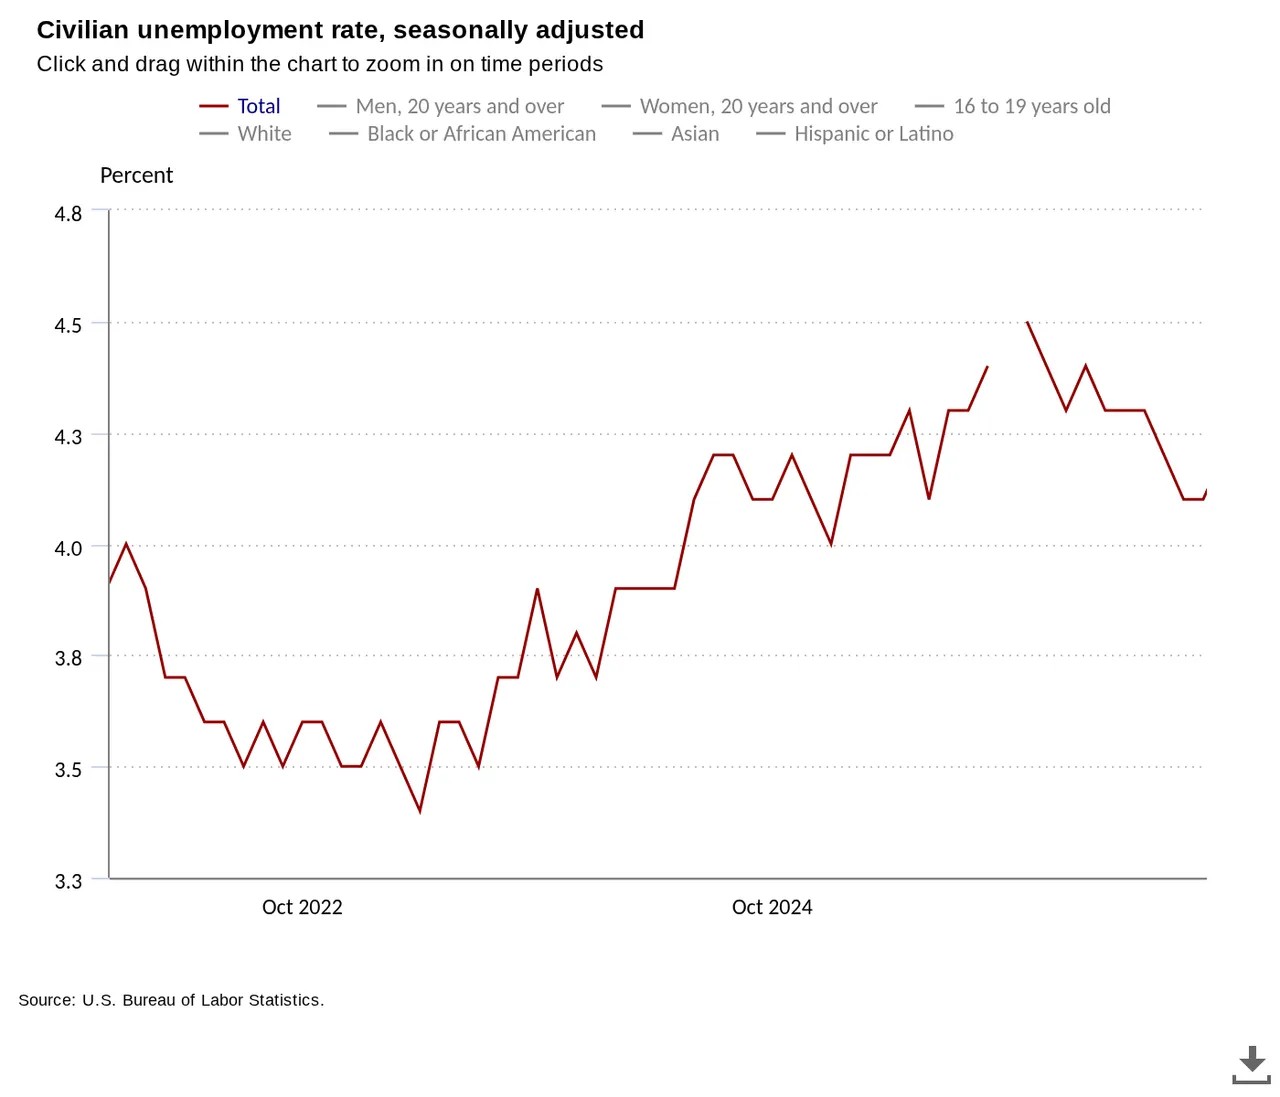
US civilian unemployment rate. Credit: BLS
Stronger performance in the labor market may pose challenges for cryptocurrencies and risk assets, as it indicates that the economy could withstand tighter financial policies, potentially leading to reduced liquidity in the market.
As a result of the latest employment data, expectations for a 25 basis point interest rate hike by the Federal Reserve during its December meeting have risen from 66.9% to 76.8%, according to the CME Group’s FedWatch Tool.
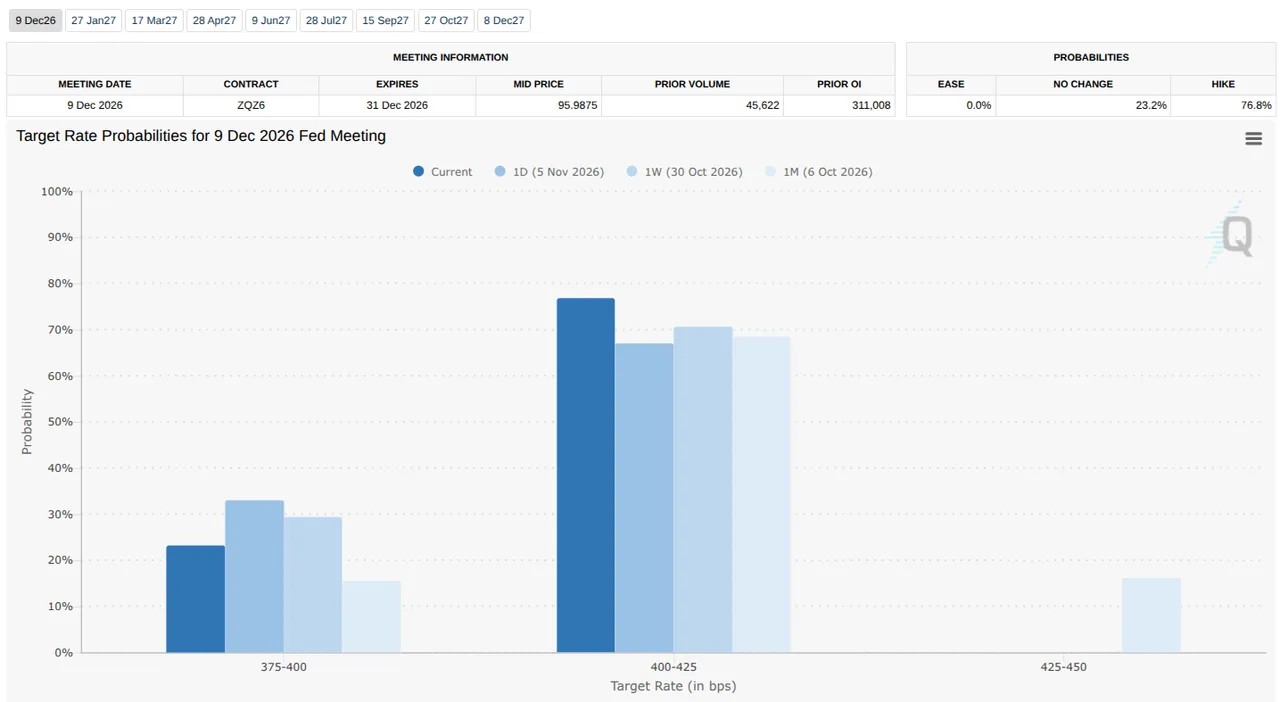
Probability comparison for Federal Reserve target rates ahead of December meeting (screenshot). Credit: CME Group
Related: Check out the latest developments in crypto
Market Analysis Indicates Possible Decline of $BTC to $69,000
Bitcoin has tested its support level at the 50-week simple moving average (SMA), which stands at $77,533.
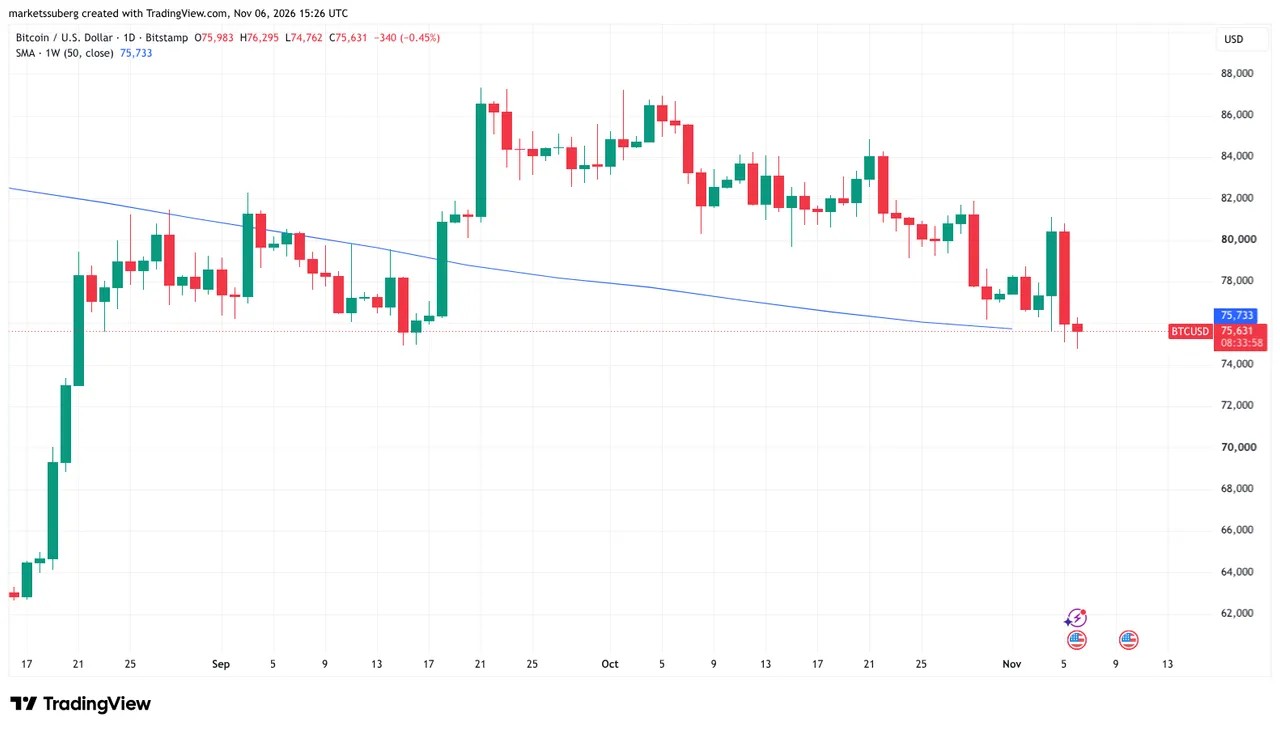
$BTC/USD one-day chart featuring the 50-week SMA. Credit: Cointelegraph/TradingView
In a recent market analysis, Keith Alan, co-founder of the trading platform Material Indicators, highlighted the potential risks of breaching this trend line, which has served as support since mid-September.
“While this support level appears robust from both technical and structural perspectives, we cannot ascertain its strength until the weekly candle closes,” he noted on X, referring to the weekly close.
Alan projected a potential decline to $69,000 for $BTC/USD if the support around $75,500 fails to hold. He emphasized that any recovery would hinge on the asset creating a series of higher highs and lows across shorter time frames.