

Since the beginning of this month, the worldwide cryptocurrency market has experienced a significant loss, totaling over $180 billion, which has reduced its overall valuation to $2.64 trillion. This decline comes on the heels of the Democrats securing victories in the midterm elections, which has sparked concerns regarding potentially stricter regulations on cryptocurrencies.
Major cryptocurrencies like Bitcoin, Ethereum, and XRP are also displaying indicators of further declines as the market trend continues downward. A pressing question remains: How low could their prices drop if the selling pressure persists?
Bitcoin May Drop to $60K
On November 5, Bitcoin saw its value dip below $75,000 after reaching a high of $81,000, which followed the release of the U.S. Initial Jobless Claims report that unexpectedly fell to 189,000, diverging from an anticipated 197,000.
Prominent crypto analyst Ali Martinez noted that Bitcoin is currently trading within a broad range on the three-day chart. The critical point to watch is the midpoint of this channel, positioned around $73,000.
Should Bitcoin fail to maintain that support level, Martinez posits that the price could plummet towards the lower edge of the channel, approximately $60,000. This would represent a 20% decrease from its current position, situating Bitcoin back in a range where buyers previously showed significant interest.
Ethereum at Risk of Declining to $1,963
Ethereum appears to be in a weaker position than Bitcoin, having dropped below the $2,385 support level on its daily chart. The chart reveals that ETH has exited a right-angled ascending broadening formation, indicating a deterioration of the previous market structure.
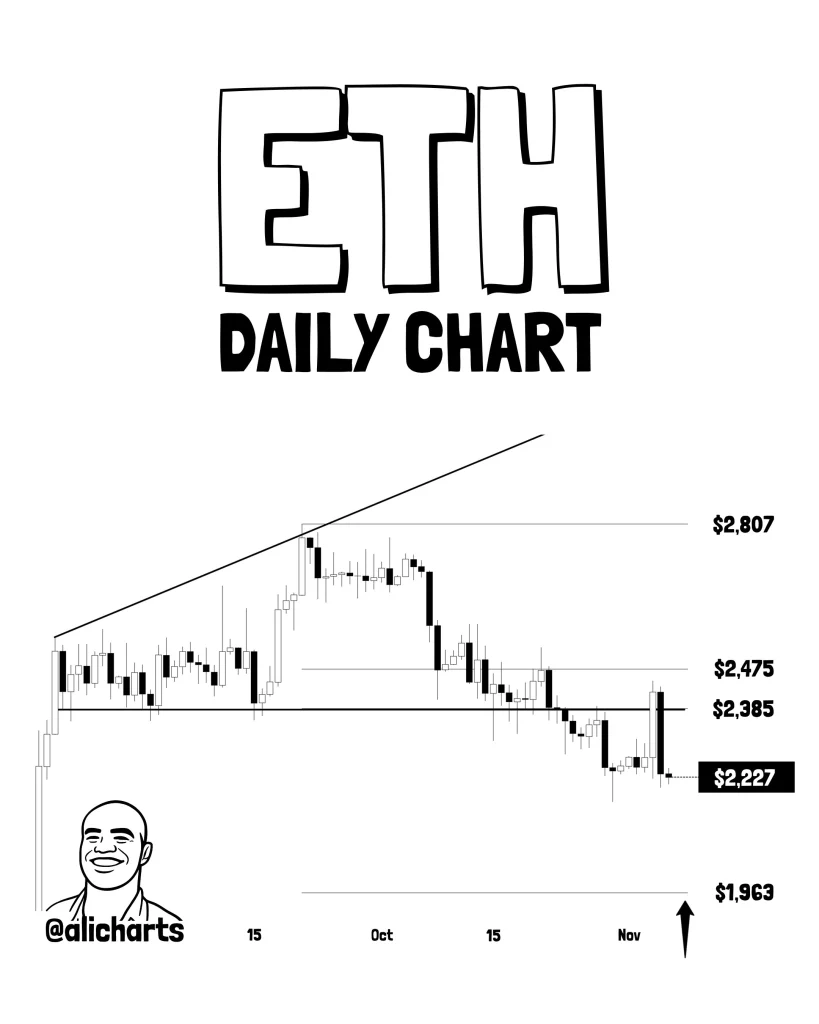
With $2,385 now serving as a significant resistance level, ongoing sell-offs could drive Ethereum towards its next major support near $1,963.
This move would mark another notable reduction from its current price around $2,245.
XRP Might Test the $0.99 Threshold
XRP is also facing sustained pressure, having dropped below the $1.61 mark and breaking beneath the midpoint of its trading channel. An analysis of the three-day chart shows XRP descending from above $1.40 toward $1.18, with $1.29 emerging as a critical level.
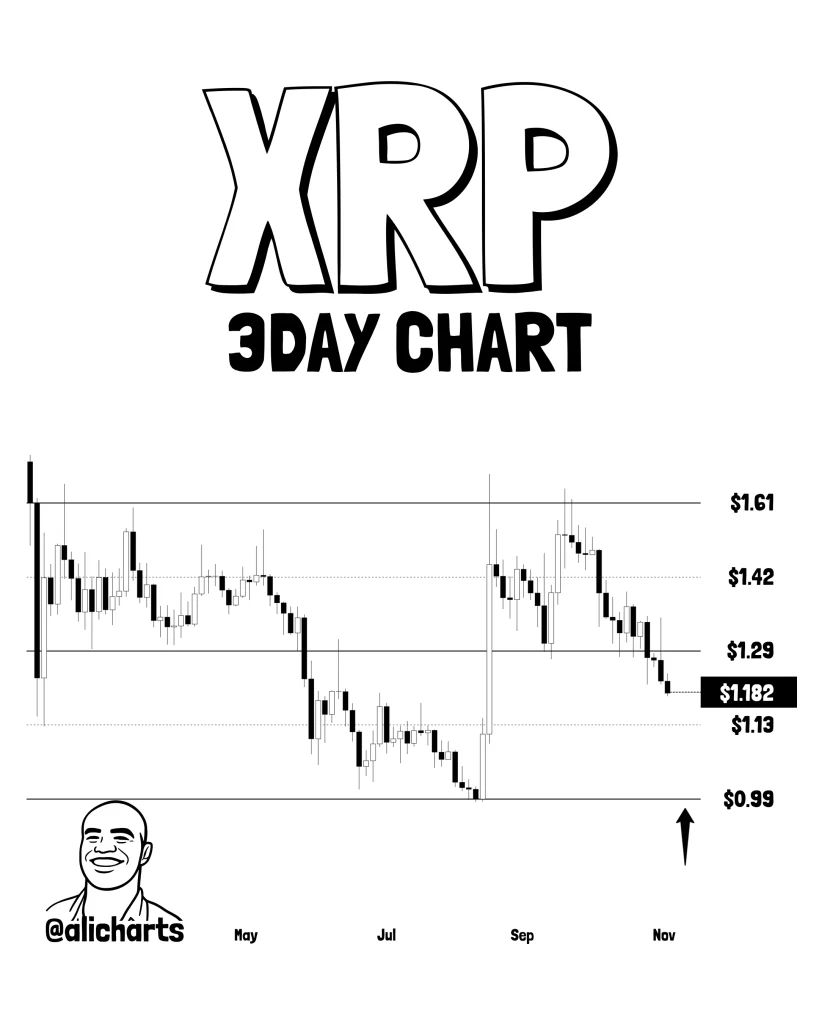
If sellers maintain their grip and the token fails to recover, the next significant support level could be the lower boundary of the channel, near $0.99.
This level is particularly notable as XRP has previously attracted strong buying interest around the $0.99 mark.