
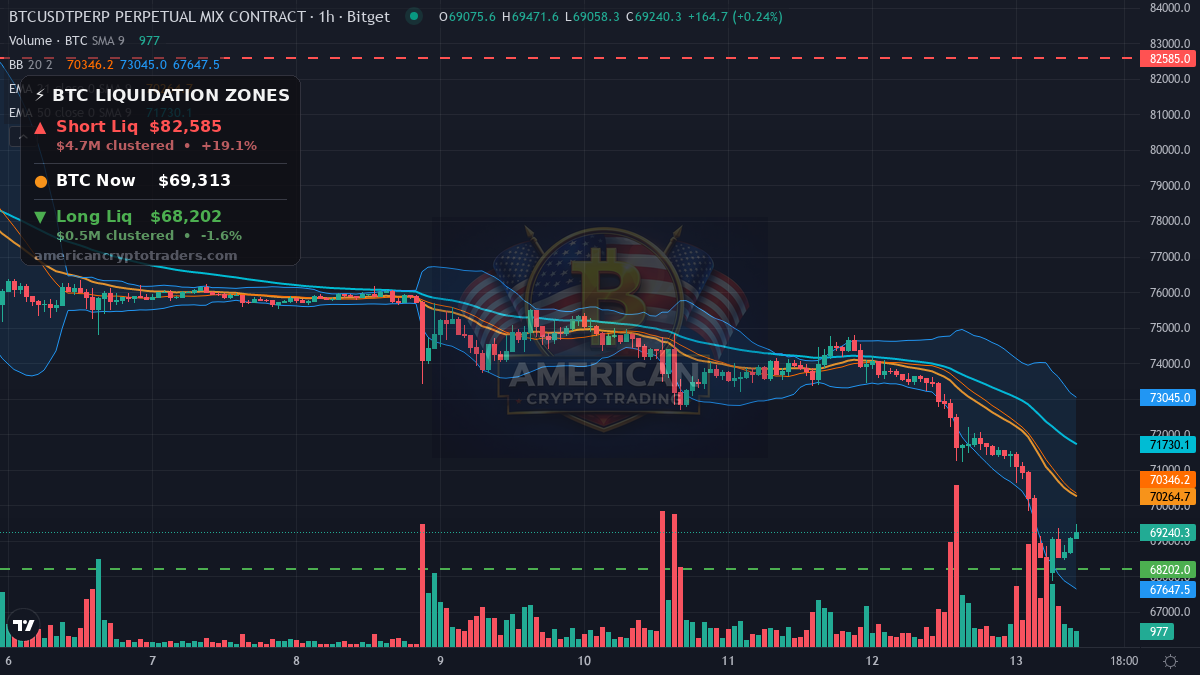
As we gear up for the New York session, Bitcoin currently sits at $69,249, down 5.82% over the past 24 hours after a sharp overnight flush from $73,578 highs all the way down to $67,492 lows — a range that ultimately deposited price directly onto the 200-week moving average, one of the most closely watched long-term support levels in crypto.
Bitcoin Market Recap: Overnight Flush Lands on the 200-Week MA
The overnight session delivered exactly the kind of swift, liquidity-vacuum move that keeps risk managers up at night. Bitcoin shed roughly $6,000 from peak to trough during the Asia session, with the selling accelerating as thin order books offered little resistance on the way down. The 200-week moving average caught the knife, but bulls will need to defend it convincingly when NY desks arrive — because a confirmed break opens the door to territory many assumed was safely behind us.
The 24-hour volume came in at approximately $5.43 billion, which is elevated relative to recent sessions. That figure tells an important story: this was not a slow bleed driven by indifference, but a pressured, conviction-heavy selloff. High-volume drops through key support levels carry more weight than low-volume ones, and that is precisely what makes the 200-week MA test credible and consequential heading into the NY open.
What Moved Markets Overnight
BTC slid below $70,000 as ETF outflows combined with thin liquidity to accelerate the move. When large ETF redemptions hit the market during an illiquid overnight window, the feedback loop is brutal — market makers widen spreads, bids evaporate, and momentum-chasing algorithms pile onto the downside. The result was a waterfall from $73,578 to $67,492 with no meaningful buyer stepping in until price met the 200-week moving average. That level absorbed the initial flush, but it now sits as the single most important price in the market.
The U.S. 10-year yield climbed 2.1% to 5.1%, adding meaningful macro headwind across all risk assets. At 5.1%, the 10-year competes seriously with speculative asset returns and historically correlates with de-risking in growth and momentum plays. S&P 500 futures are currently pricing in a 0.35% decline, and while gold is bid at $3,902 — up 0.45%, playing its traditional safe-haven role — crypto found no such bid. The DXY sits at 103.21, essentially flat, so this is a rates story, not a dollar story, for now.
The DOJ announced a move to seize $1.2 billion tied to the Binance hack, adding a fresh layer of regulatory overhang. Enforcement actions of this scale serve as reminder events — they re-activate dormant concerns about exchange risk, custody, and regulatory exposure. When sentiment is already fragile, as it clearly is at a Fear & Greed reading of 20, headlines like this do not need to be directly relevant to a trader’s portfolio to push them toward the exit. The timing into a technically vulnerable market made the news hit harder than it otherwise might.
Altcoin Action
The total crypto market cap dropped 6.91% to approximately $2.33 trillion, with BTC dominance climbing to 59.7% — a classic flight-to-relative-safety dynamic where capital concentrates in Bitcoin even as Bitcoin itself sells off. ETH led large-cap losses at -4.8%, with price ranging from $2,051 down to $1,894 before settling near $1,950. ETH funding rates have flipped slightly negative at -0.0000280, suggesting some short positioning has built in that market.
SOL shed 3.49%, trading between $83.34 and $77.87 before settling around $80.42. DOGE fell 3.33%, slipping toward $0.065 as retail-favored tokens generally underperformed in a risk-off tape. On the losers board, GT dropped 7.0%, GRAM fell 8.3%, and BTW collapsed 14.7% — that last move representing the kind of deep drawdown that tends to show up in thin-liquidity assets when the broader market flushes hard.
The rare green spots in this session were PYTH (+3.7%), BDX (+3.5%), and JUP (+2.5%). Idiosyncratic strength in a broadly red tape often reflects protocol-specific catalysts or positioning squeezes rather than macro conviction, so traders should not read these gains as a broader altcoin recovery signal.
Positioning and the Liquidation Map
The liquidation map heading into the NY open shows a highly asymmetric setup. On the downside, the long liquidation cluster sits at $68,202 — just $1,047 below current price, representing approximately $537,839 in leveraged long positions. With BTC trading at $69,249, that level is uncomfortably close. A wick or a momentum push through it would cascade those longs into forced selling, potentially deepening the flush. This is the immediate trap door bulls need to avoid.
On the upside, the short liquidation cluster sits at $82,585, which is 19.1% above current price and represents $4.73 million in short exposure. A reclaim of that level would trigger a significant short squeeze, but that scenario requires sustained buying pressure and a macro tailwind that is simply not visible in today’s pre-market data. BTC funding rates on the long side are essentially flat at 0.0000130, suggesting the market is not yet heavily short at these levels — which paradoxically means there is less fuel for a squeeze and more room for continued deleveraging if support fails.
The Macro Picture
The macro backdrop is not cooperating with bulls this morning. A 10-year yield at 5.1% is a level that historically constrains equity and crypto multiples. When the risk-free rate is this elevated, the opportunity cost of holding volatile assets rises, and institutional allocators take notice. Gold at $3,902 is finding buyers as a rates hedge, but that bid is not spilling over into digital assets, at least not yet.
One news item worth watching is the Trump nomination of a Hester Peirce successor and other SEC and CFTC picks. Regulatory personnel changes at the top of the SEC and CFTC carry long-term implications for crypto market structure, exchange oversight, and ETF policy. The market tends to react to these appointments over days and weeks rather than hours, but the directional signal matters — and crypto participants will be parsing those nominations carefully as details emerge.
Levels to Watch
Into the NY open, $68,202 is the first line in the sand — a break below that level risks triggering a long liquidation cascade. Below that, analysts have flagged $67,492 (last night’s low) as the first structural test, with $57,700 cited as the next meaningful downside target if the 200-week MA fails to hold as support on a daily close basis.
To the upside, reclaiming $70,000 on a sustained basis would be the first credible sign that bulls have absorbed the overnight flush. Above that, $73,578 — last night’s high — represents the full recovery level. If NY buyers show up with volume, a move back toward $71,000–$72,000 is a reasonable bear-market-rally target, but that remains speculative given the macro pressure.
Upcoming Catalysts
The economic calendar is relatively quiet for today’s session, meaning price action will be driven primarily by technical levels, ETF flow data as it becomes available through the trading day, and any further developments on the DOJ enforcement action or the SEC and CFTC nomination news out of Washington.
Sentiment Check
The Crypto Fear & Greed Index sits at 20, firmly in Extreme Fear territory. Historically, readings at this level have marked periods of capitulation or near-capitulation, but Extreme Fear can persist and deepen before it recovers — the index is a sentiment indicator, not a timing tool. For longer-term context on how monthly candle structure has historically interacted with these setups, see our 28-for-28 monthly candle analysis. The key question heading into today’s session is whether institutional buyers view the 200-week MA as a dip-buying opportunity or simply the beginning of a larger structural breakdown.
Bottom Line
Bitcoin is sitting on one of the most important long-term technical levels in its history — the 200-week moving average — after an overnight flush driven by ETF outflows, thin liquidity, and a macro environment made hostile by a 5.1% 10-year yield. The setup into the NY open is binary in feel: defend this level and build a base, or lose it and open a potential path toward the $57,700 target analysts are already flagging.
The liquidation map skews bearish in the near term, with a long squeeze trigger only $1,047 away at $68,202. Sentiment at Extreme Fear of 20 reflects the reality on the ground. When NY desks arrive, their response to this level — buying conviction or continued distribution — will set the tone for the week. Watch volume, watch the 200-week, and watch the 10-year yield. Those three variables will tell you everything you need to know.
Disclaimer: This recap is for educational and informational purposes only and does not constitute financial advice. Cryptocurrency trading involves substantial risk of loss. Always do your own research. American Crypto Traders and its contributors may hold positions in the assets discussed.
Originally published on American Crypto Traders
This article was syndicated from the American Crypto Traders daily brief. For original analysis and trading signals, visit americancryptotraders.com