

Bitcoin (BTC/USD) is currently valued at approximately $64,500 in the early European trading hours on Monday, November 16. This reflects a decline of roughly 1.3% for the day and a notable decrease of about 13.5% over the past week.
•
Latest update: Monday, November 16, 2026
Bitcoin (BTC/USD) is currently trading at around $64,500 during Monday’s early European session, reflecting a decrease of about 1.3% for the day and approximately 13.5% over the past week. A recent wave of forced liquidations drove the price down to $61,946 on Coinbase early Sunday, the lowest point since mid-July. Buyers have since shown interest at the critical $62,500 demand area. Although leverage has been reduced, ongoing selling from US Bitcoin ETFs remains a barrier to recovery. The crucial price level to watch is $62,500.
My perspective: bearish sentiment exists below $70,582. While oversold conditions may trigger a short-term recovery, a daily close beneath $62,500 could lead to targets of $57,970 and $53,351.
The Weekend Selloff Eliminated Leveraged Positions
Approximately $2 billion in cryptocurrency positions were liquidated within the 24 hours leading up to early Sunday, based on CoinGlass data referenced by Bloomberg. Bitcoin was responsible for $774 million of this, while Ether accounted for $488 million. A liquidation occurs when an exchange forcibly closes a trader’s leveraged position due to significant losses. About 87% of the wiped positions were long trades, reflecting bets on rising prices, impacting over 312,000 traders.
Glassnode, an on-chain analytics firm, indicated a concentration of leveraged positions between $59,500 and $62,600, with the weekend low occurring precisely within that range. The sparse trading volume during the weekend contributed to a sharper decline. Currently, Bitcoin is about 26% below its closing price of $84,025 from October 21.
Leverage Reset May Signal a Short-Term Low
The open interest in coin-margined BTC futures has dropped to $1.1 billion from $1.55 billion, a reduction of around 29%, according to CryptoQuant data. Additionally, funding rates, which are fees paid by one side of perpetual futures to the other, have turned negative for the first time since March. This negative funding implies that short sellers are now covering costs to maintain their positions, indicating a bearish market sentiment.
In my view, this is a positive sign. Such aggressive leverage liquidation often leads to a conclusion of forced selling, which, alongside crowded short positions, can lead to a strong recovery if traders rush to close their shorts. The Fear and Greed Index currently shows a reading of 10, signifying “Extreme Fear,” down from 55 just a month ago.
Ongoing ETF Selling Poses a Bigger Challenge
US Bitcoin ETFs, which directly hold Bitcoin and are traded on stock exchanges, have recorded net outflows for seven consecutive sessions, as of Friday, November 13. These outflows totaled $185.4 million, primarily driven by BlackRock’s IBIT with $143.5 million and Fidelity’s FBTC with $41.9 million, leading to approximately $1.91 billion in total outflows over the past week, as reported by Farside data. The previous week saw outflows of $1.07 billion, continuing a trend of losses since late June.
Demand from the US is showing weakness in other areas as well. The Coinbase premium, the price difference between Bitcoin on Coinbase and Binance, has remained negative for 51 days, indicating that US buyers are less active compared to their global counterparts. While the recent leverage flush may indicate a potential short-term bottom, any sustained recovery hinges on the return of ETF investors, with Monday’s flow data being the next indicator to watch.
Options Traders Are Hedging Against Sub-$60,000 Prices
On Deribit, the largest cryptocurrency options platform, the $60,000 put option now holds the most open interest at approximately $900 million, surpassing the $100,000 call option at around $867 million. A put option pays out if the asset’s price falls below the specified strike price, suggesting traders are purchasing protection against a drop below $60,000. The lowest Bitcoin price in 2026 is $57,718 from July 1, which is close to the next support level on the charts.
Looking Ahead: Warsh, Nvidia, and Fed Minutes
The overarching macroeconomic environment continues to exert pressure. Markets currently estimate a 92% likelihood of a Federal Reserve rate increase in December, and the yield on 10-year Treasury bonds stands at around 5.15%. When bonds offer such high yields, assets that do not yield interest, like Bitcoin, become comparatively less attractive.
- Monday: Fed Chair Kevin Warsh will speak at 17:00 GMT, with the first ETF flow data since the recent downturn set to be released post-US market close.
- Tuesday: Nvidia will announce its Q3 results at 22:00 GMT, marking its first earnings report since CEO Jensen Huang departed last week. A strong earnings report may enhance sentiment across tech and cryptocurrency.
- Wednesday: The Federal Reserve will release minutes from its October meeting at 19:00 GMT, revealing discussions about future interest rate decisions.
Bitcoin Technical Overview: BTC Breaks Trendline and Tests $62,500 Demand Area
On the daily chart, Bitcoin is trading at $64,463.09, down 1.31%, having broken below a rising trendline that linked higher lows since June and the essential support level of $70,582.61. The price is positioned significantly below both moving averages, which hover around $76,597 and $76,391, indicating a bearish trend. The previous trading session left a notable long lower wick, suggesting buyers entered the market around the $62,500 demand zone, an area of interest during June and August.
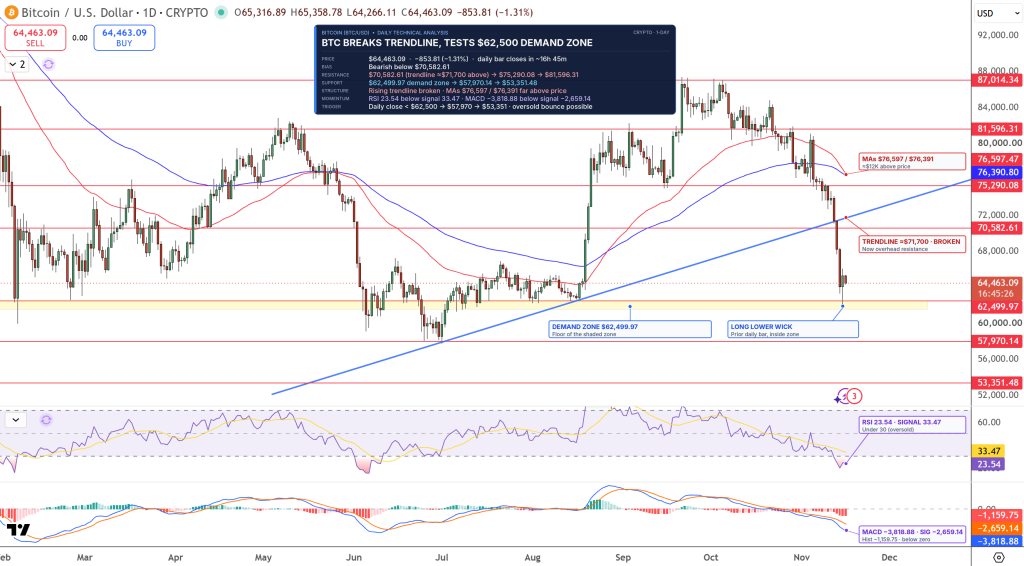
The RSI, which measures momentum on a scale of 0 to 100, currently reads at 23.54, indicating deeply oversold conditions below the 30 mark. The MACD, another momentum indicator, is at -3,818.88, beneath its signal line at -2,659.14, suggesting sellers retain dominance.
I remain bearish when the price is below $70,582.61. Although oversold indicators may prompt a bounce, a daily closing beneath the $62,500 mark would open up downside targets of $57,970 and $53,351.
- Resistance Levels: $70,582.61 | $75,290.08
- Support Levels: $62,499.97 | $57,970.14 | $53,351
Frequently Asked Questions
What caused the Bitcoin crash this weekend?
Approximately $2 billion in leveraged crypto positions were liquidated due to thin trading conditions over the weekend, dropping Bitcoin to $61,946, the weakest it has been since July. Most of the losses affected those who had bet on price increases.
Are there still outflows from Bitcoin ETFs?
Yes. US spot Bitcoin ETFs have experienced about $1.91 billion in outflows over the past seven sessions as of November 13, primarily due to BlackRock’s IBIT fund.
What is the critical support level for Bitcoin?
The crucial support level is positioned at the $62,500 demand area. A daily close below this level could lead to targets of $57,970 and subsequently $53,351.

Arslan Ali Butt
Lead Markets Analyst – Multi-Asset (FX, Commodities, Crypto)
Arslan Ali Butt is the Lead Commodities and Indices Analyst with extensive expertise in the field. He holds an MBA in Behavioral Finance and is currently progressing towards a Ph.D. His background includes a significant position as a senior analyst at a prominent brokerage firm, along with a wealth of experience as a market analyst and day trader. He is commended for his ability to educate others and has a solid track record as an instructor and public speaker. His insightful analyses, especially in cryptocurrencies and forex, have been featured across respected financial platforms such as ForexCrunch, InsideBitcoins, and EconomyWatch, affirming his standing in the financial sector.