

Key Points to Consider
Ethereum’s price increase was largely influenced by substantial inflows into spot markets and significant purchasing by corporations. However, the futures market shows signs of overheating, which might lead to a price correction from just above the $4,000 mark.
The Ethereum [ETH] market exhibits an elevated Relative Strength Index (RSI) alongside 95% of its supply being in a profitable state. Both indicators suggest the market may be reaching its peak. Subsequent profit-taking could potentially hinder further upward price movement. Yet, recent activity indicates that major players are still accumulating more Ethereum. The sizable inflow into spot ETFs is a crucial factor contributing to Ethereum’s price surge.
Trading volumes are primarily concentrated in derivatives, raising concerns about a potential price bubble for ETH. The increasing basis reflects a strong demand for leveraged long positions on ETH. Without consistent spot market activity, the possibility of a significant price decline increases.
Will Ethereum Soon Give Back Its Gains?
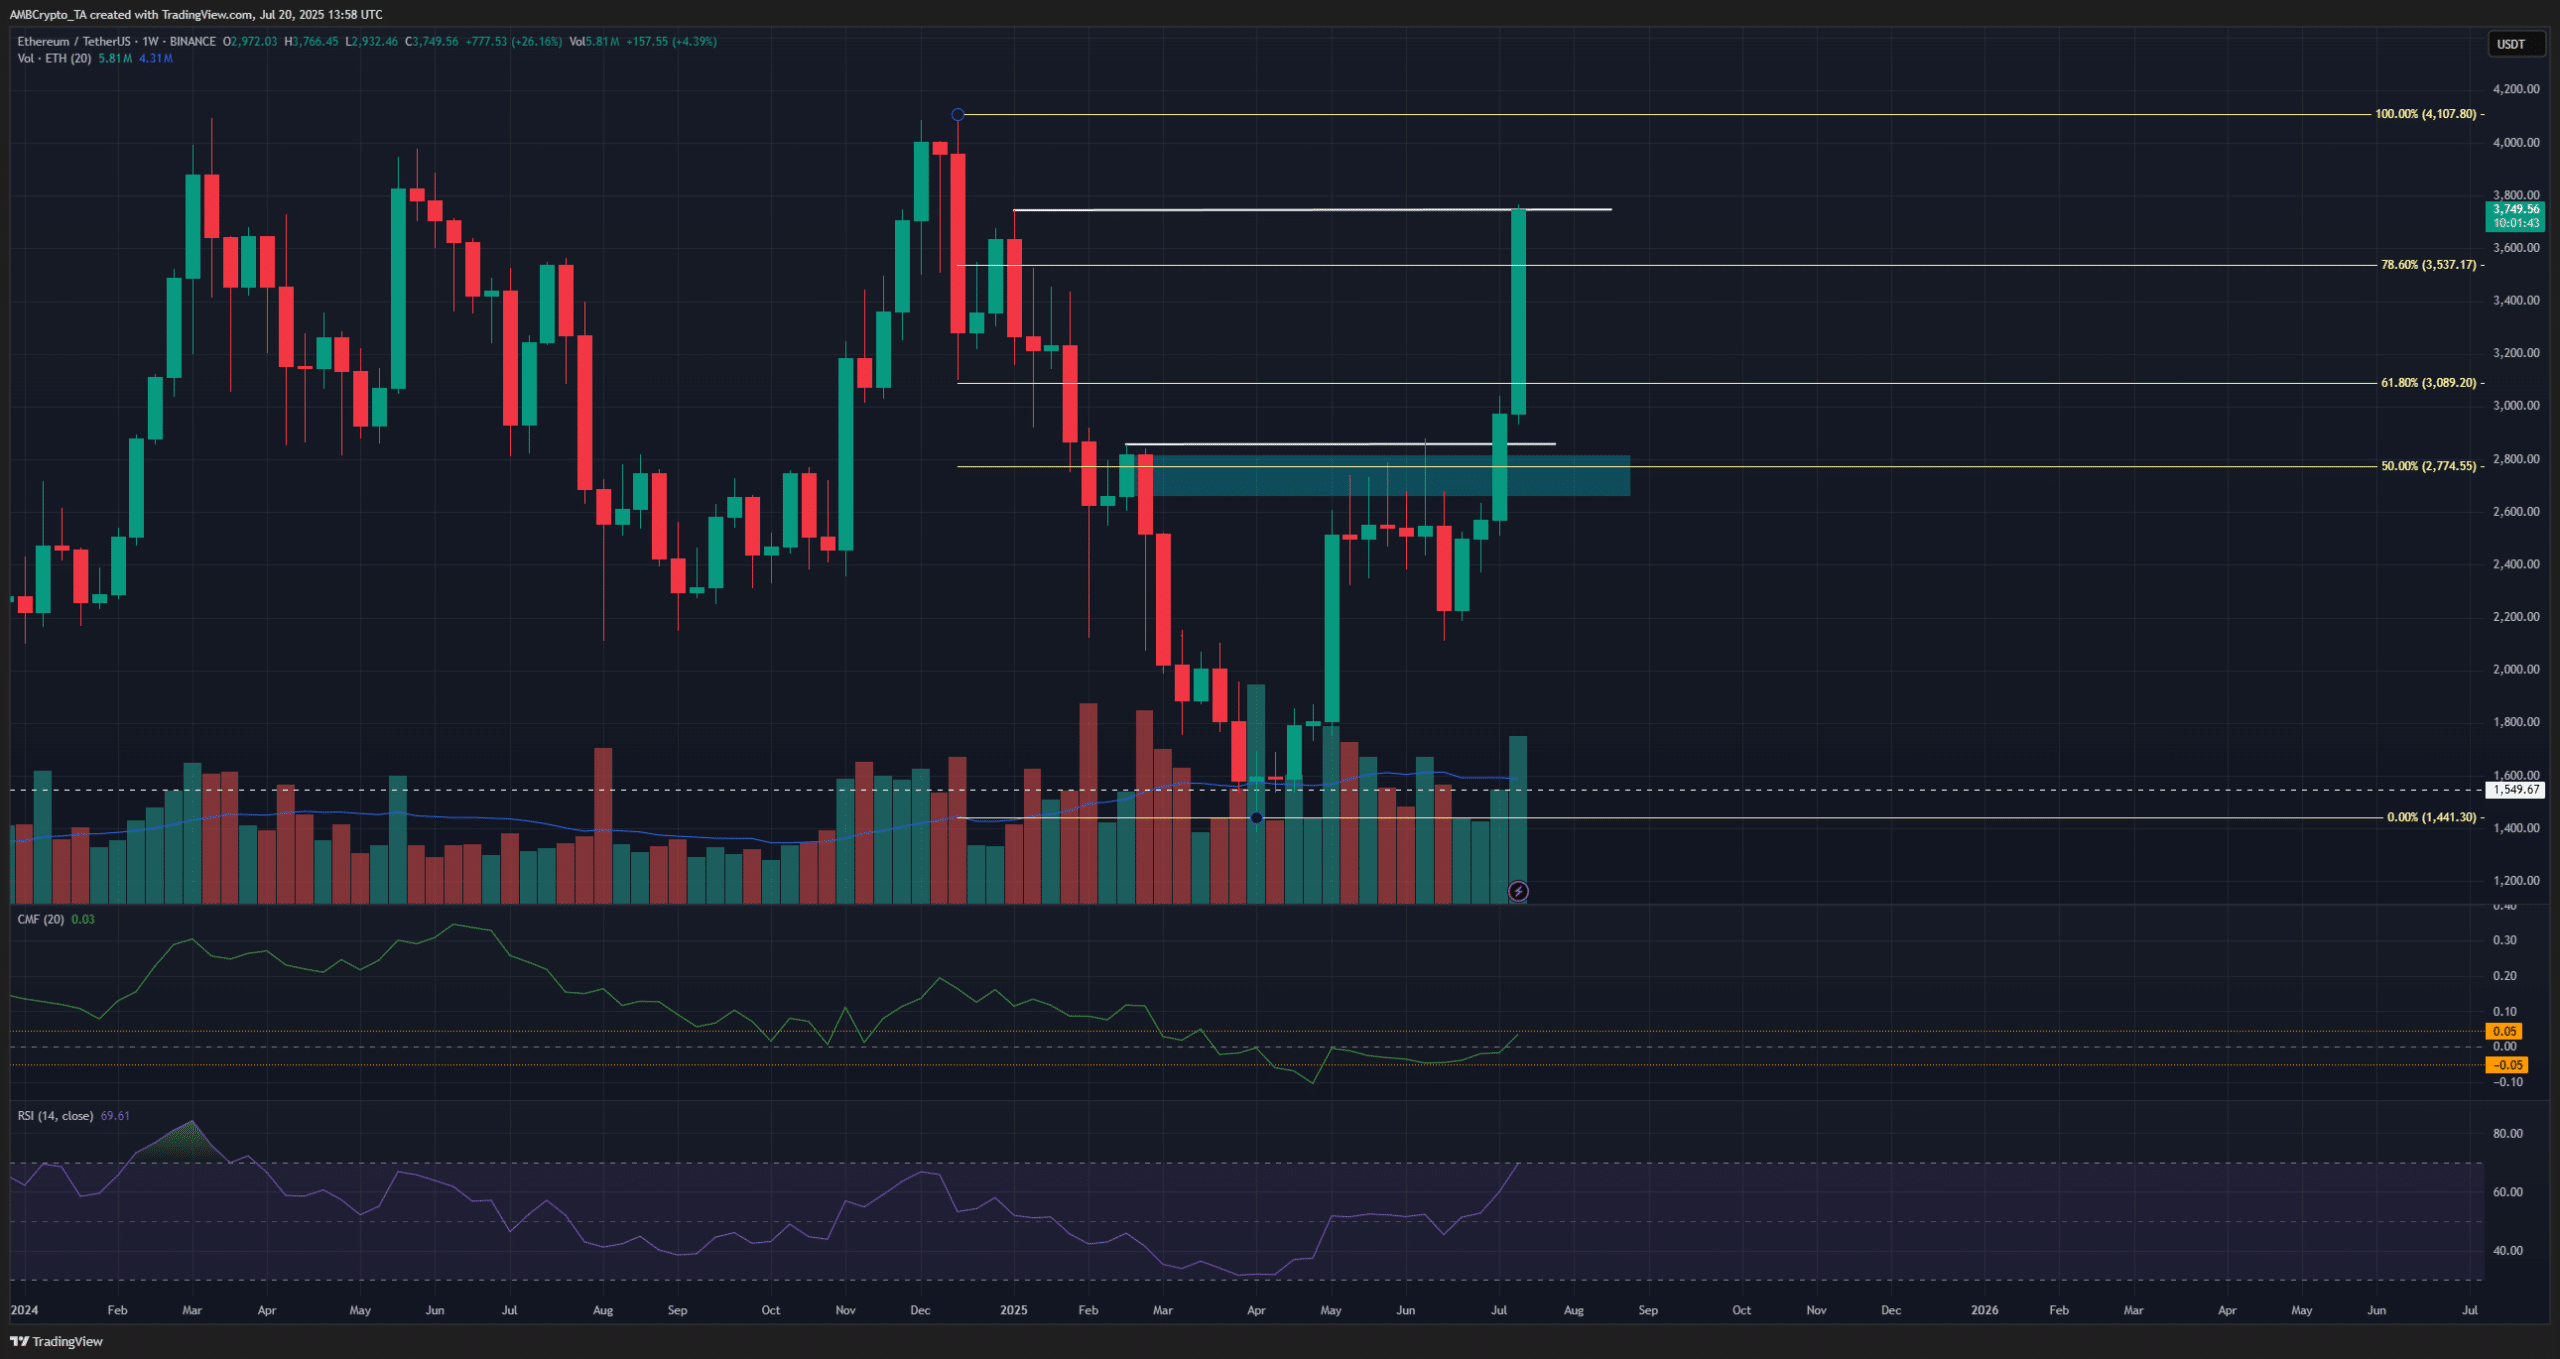
Source: ETH/USDT on TradingView
Analyzing the weekly chart, key levels to watch for a potential recovery from November 2024 are $2,850 and $3,750, represented in white. Ethereum is approaching a breakout past the second resistance level, which could further solidify bullish sentiment.
However, traders should exercise caution. Ethereum’s price has risen for seven straight days, gaining 27.4%. The $3,750 area may act as a liquidity zone, potentially triggering a short-term bearish reversal.
Current technical indicators provide mixed signals. The RSI is not yet in overbought territory, and the Chaikin Money Flow (CMF) remains below +0.05.
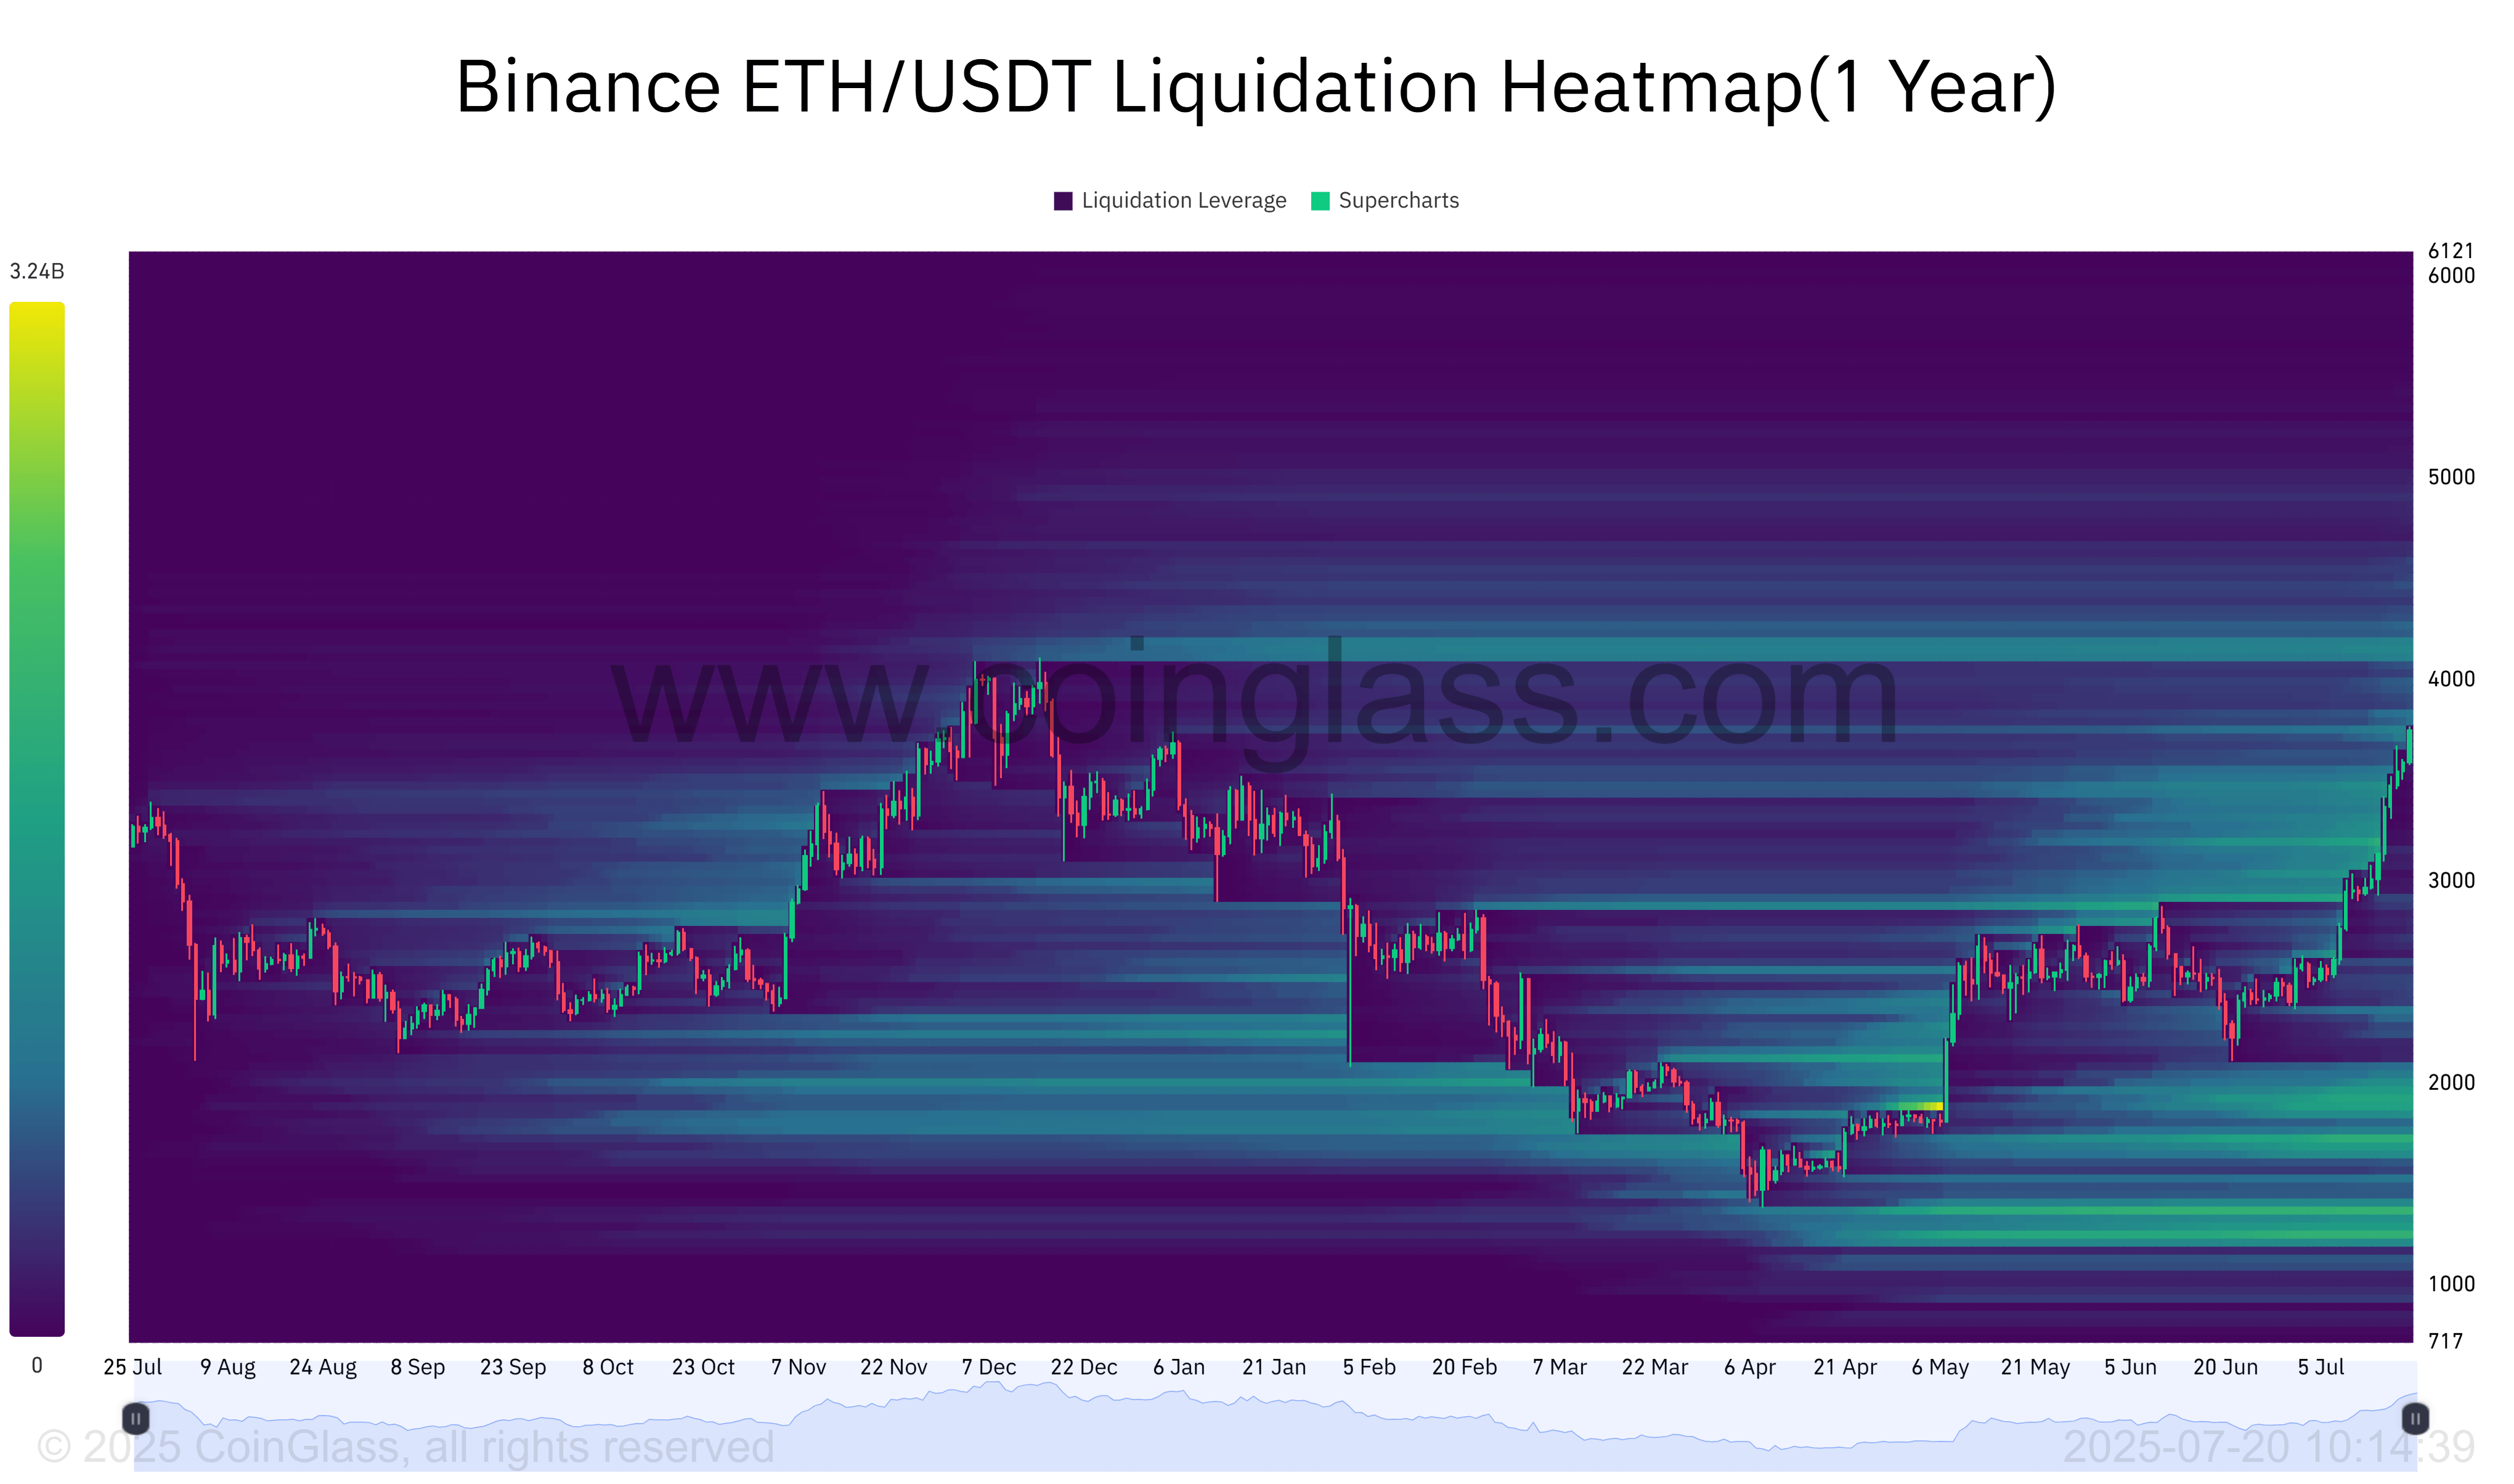
Source: Coinglass
Based on the one-year liquidation heatmap, the $3.8k and $4.1k levels are identified as significant zones of interest.
Ethereum’s upward trend may pause or reverse in these zones. There are also considerable liquidity pools down to the $2k level, which could act as support.
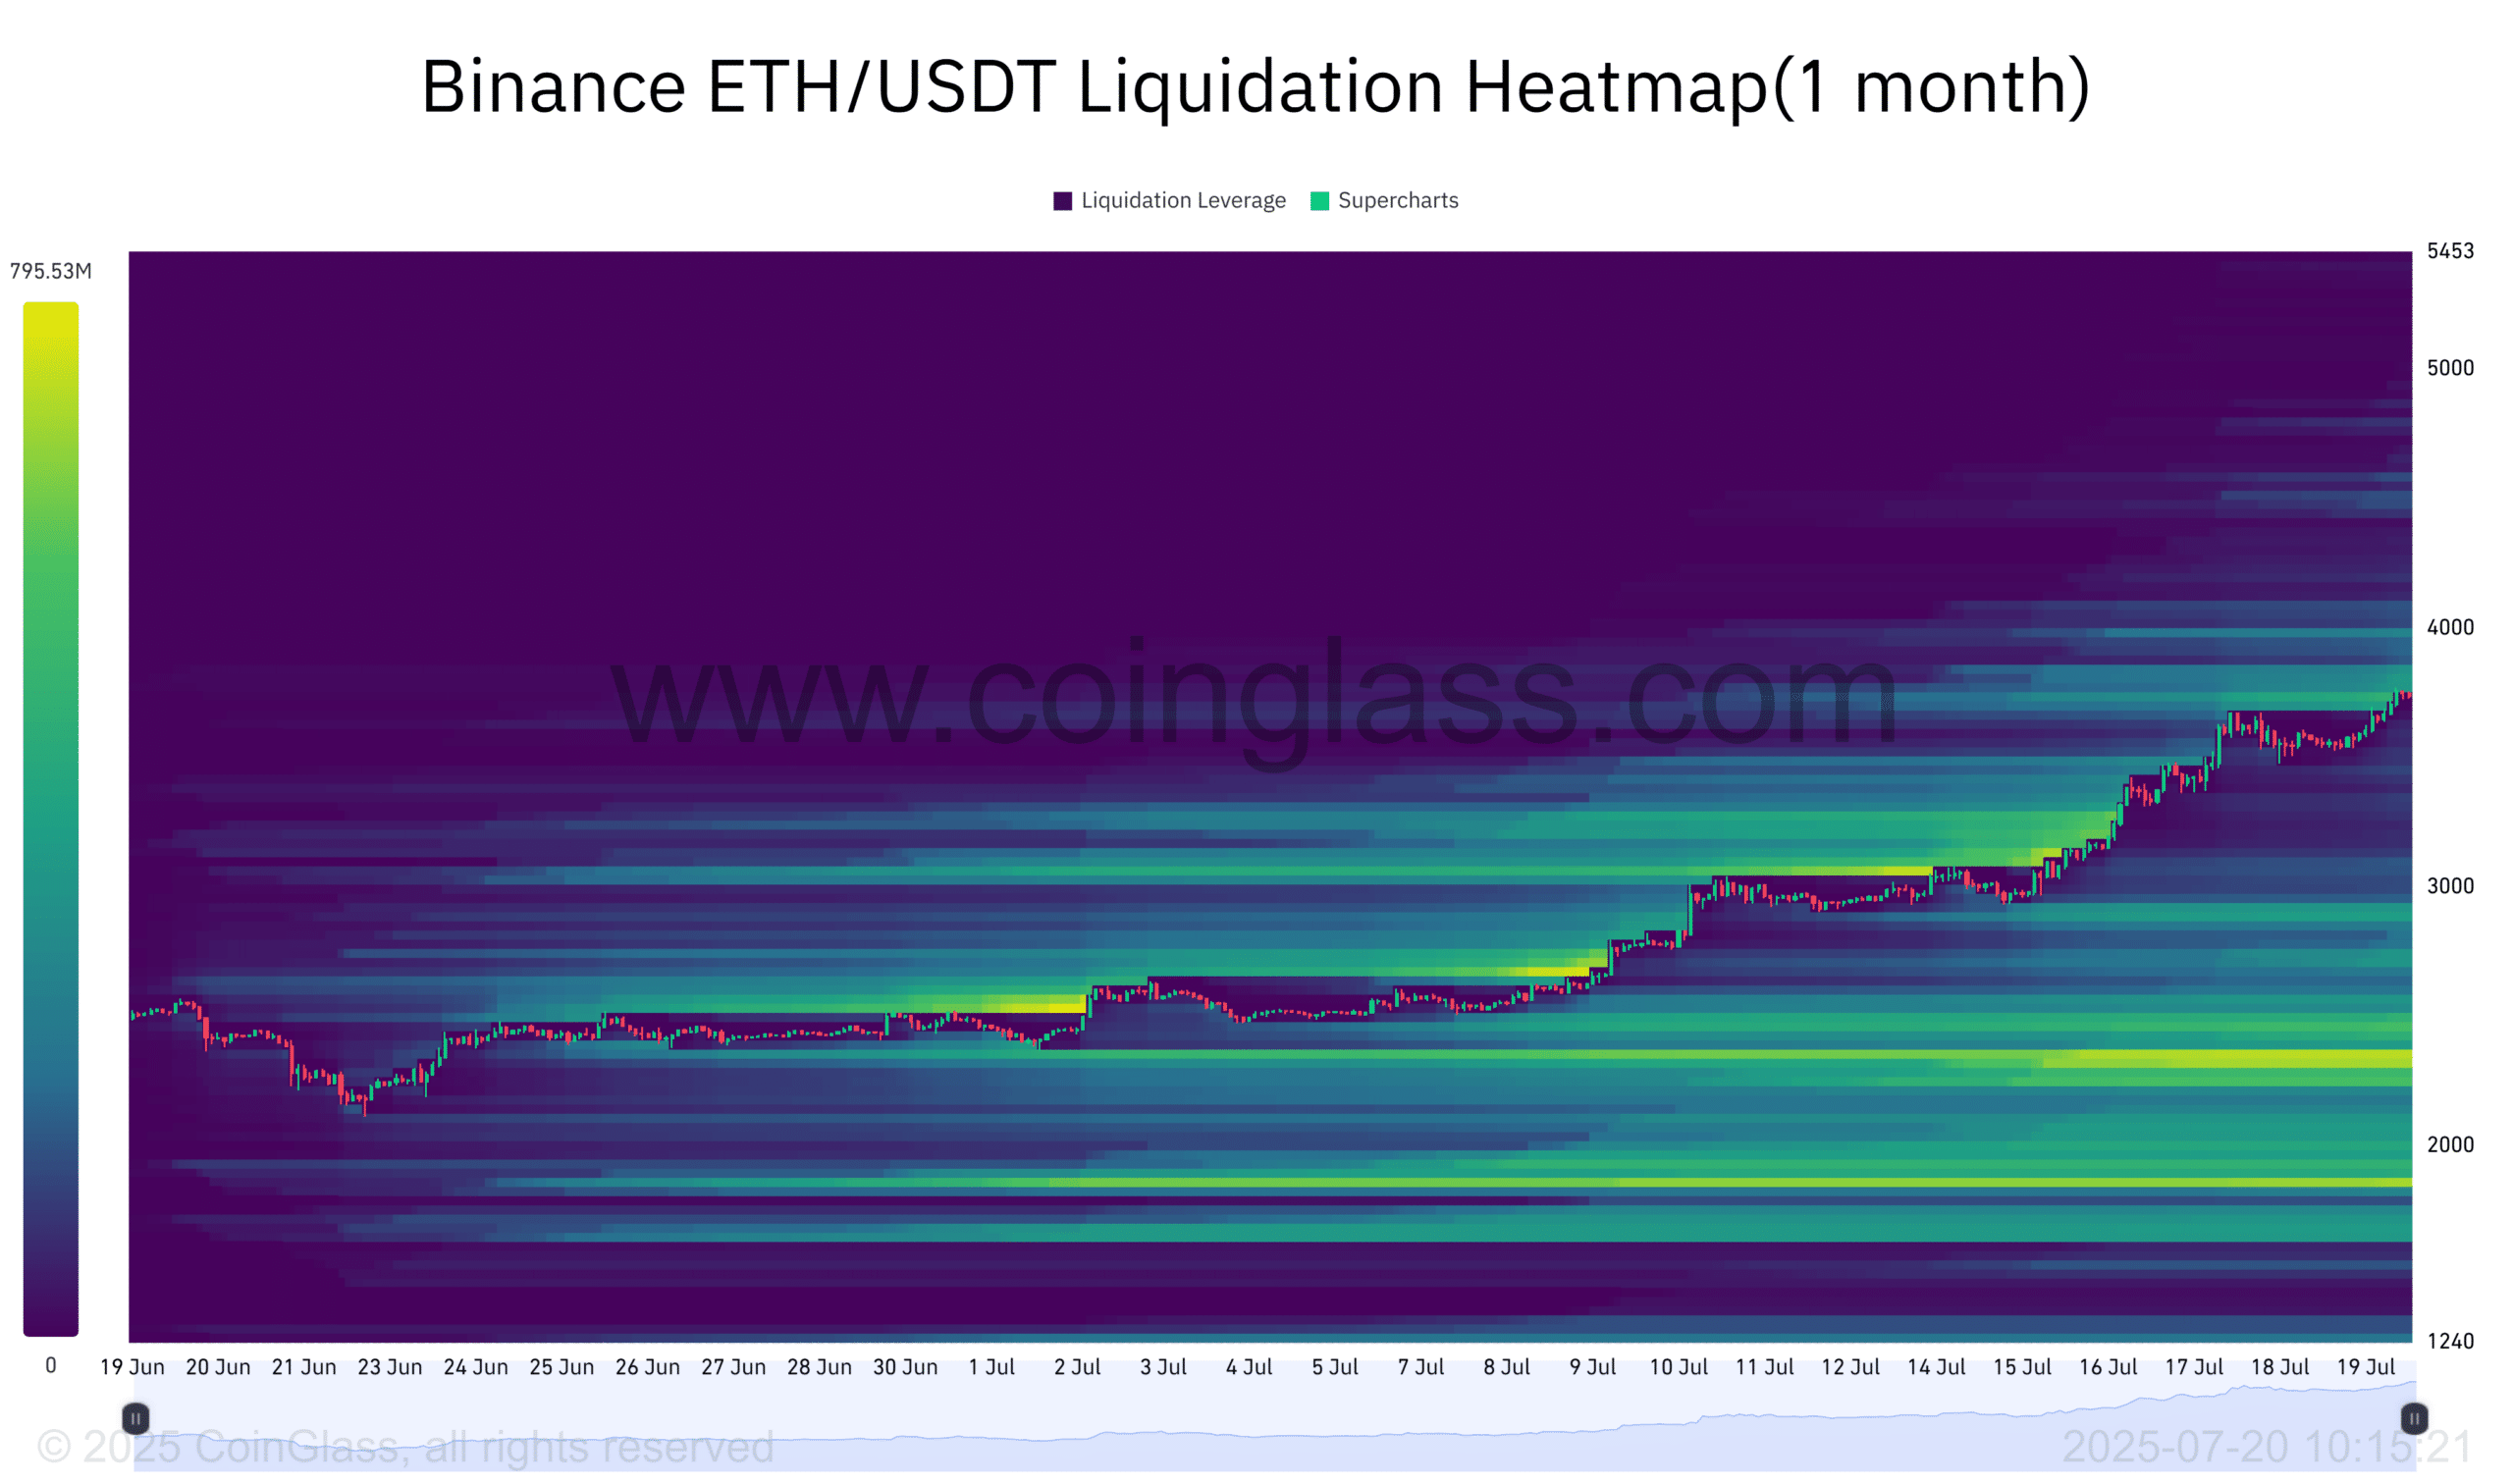
Source: Coinglass
The one-month chart provides further insights, emphasizing relatively thin liquidity on the downside. This suggests that Ethereum is likely to advance towards the $4.1k resistance, previously tested in December 2024. That test preceded a bearish correction that lasted nearly five months.
Ethereum might consolidate around the $4,000 level before continuing its upward movement. Support levels at $3.5k and $2.8k are unlikely to be tested soon, unless Bitcoin [BTC] experiences a sell-off, dropping below $116,000.
Disclaimer: This information is for informational purposes only and should not be considered financial, investment, or trading advice. The views expressed are solely those of the author.