

Important Points:
- A temporary dip in Bitcoin’s value to around $115,000 could occur before the price continues to rise.
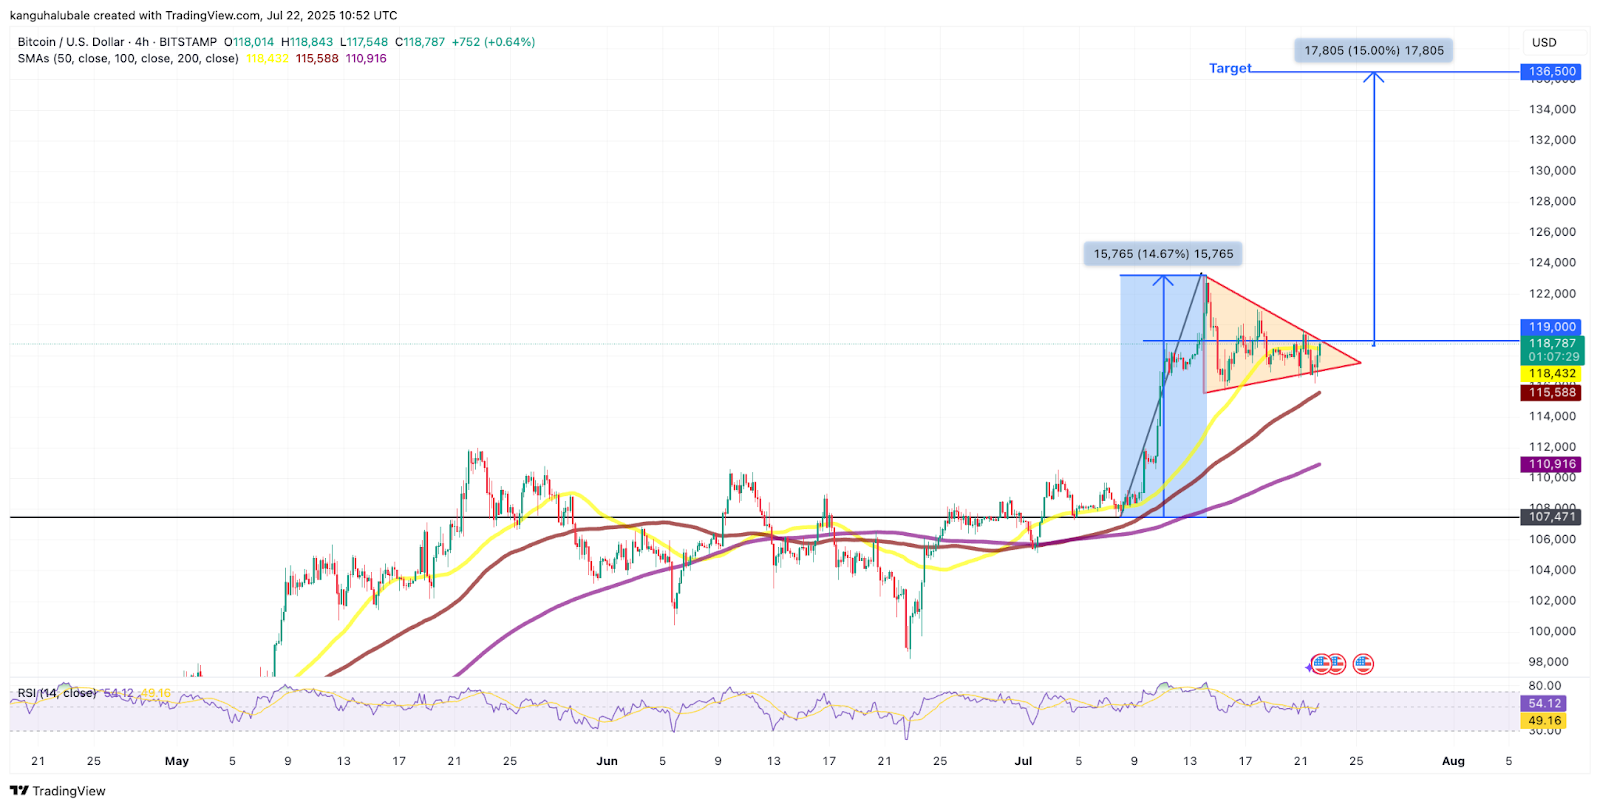
- A “bull pennant” formation suggests a potential surge of 15% in the price of BTC, possibly pushing it beyond $136,000 to new record levels.
For much of the past week, the price of Bitcoin (BTC) has struggled to break through the $120,000 mark, an area identified by numerous experts as a significant point of resistance. However, a newly observed technical pattern indicates that BTC may be consolidating its position within a “bull pennant” formation, suggesting a likely continuation of its upward trajectory.
Bitcoin “Bull Pennant” Formation Points to $136,000 and Beyond
Between July 8 and July 25, Bitcoin experienced a 14% increase, reaching a new all-time high, approaching $123,000. Subsequently, the price of BTC has retreated slightly, stabilizing between this peak and the $115,000 level.
Recent data from Cointelegraph Markets Pro and TradingView reveals that BTC is currently trading within a bull pennant pattern. This pattern often suggests that an “explosive phase” of price increase is likely to follow.
According to a Monday post on X by the well-known crypto analyst, Titan of Crypto, Bitcoin is experiencing a “bull pennant breakout targeting $140,000.”
A bull pennant is a type of chart formation that typically emerges after a significant upward price movement. It is characterized by a period of consolidation at the higher end of the price range, before breaking out to higher levels.
“Prepare for the final and most powerful stage of this bull market.”
Should Bitcoin experience a successful breakout from this pennant formation, it could trigger a new upward surge, potentially reaching $136,500, representing a 15% increase from current values.
It’s worth remembering that bull pennant formations have a success rate of only around 54%, making them among the less dependable indicators.
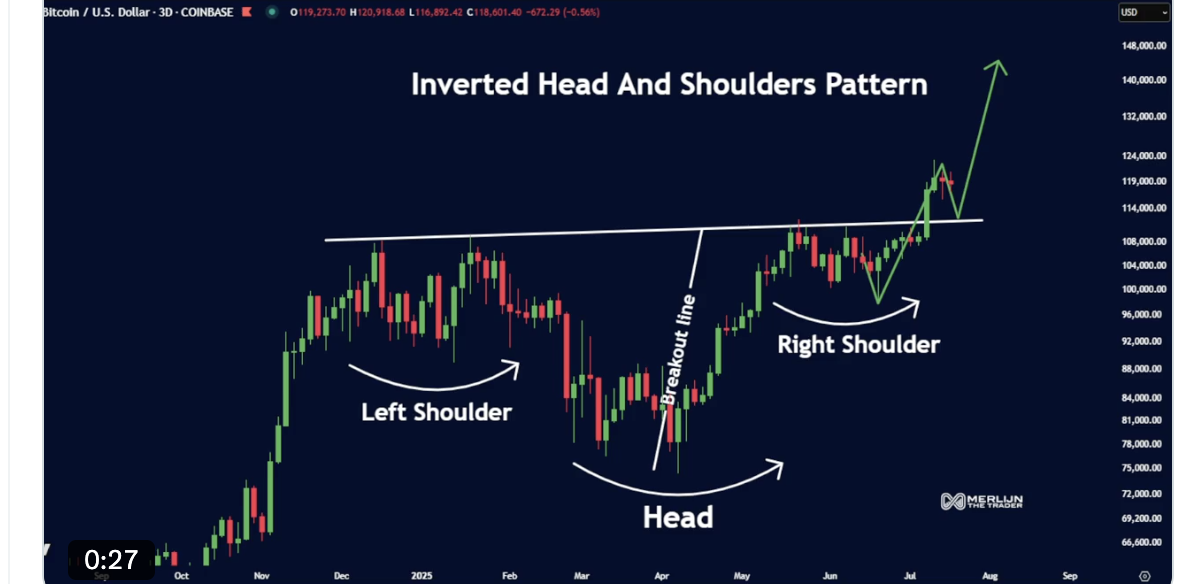
Another classic pattern, an inverse head-and-shoulders pattern on the three-day chart, was identified by the Bitcoin analyst Merlijn The Trader, who suggests that Bitcoin’s price could reach $140,000.
“The breakout has indeed occurred. The momentum is undeniable. A target of $140,000 is anticipated.”
Other forecasts are even more optimistic. One analyst points to a golden cross formation on the daily chart, which historically signals significant gains, projecting a Bitcoin price of $155,000.
The popular trader, Marcus Corvinus, has provided a more conservative estimate, suggesting that a symmetrical triangle breakout could push the price to $125,000.
Bitcoin May Dip to Test Support Levels Initially
Given that the majority of Bitcoin’s apparent selling pressure has been absorbed during its rise to $122,000, some analysts are cautioning that the next move for BTC could involve a brief decline to test the $115,000 support level.
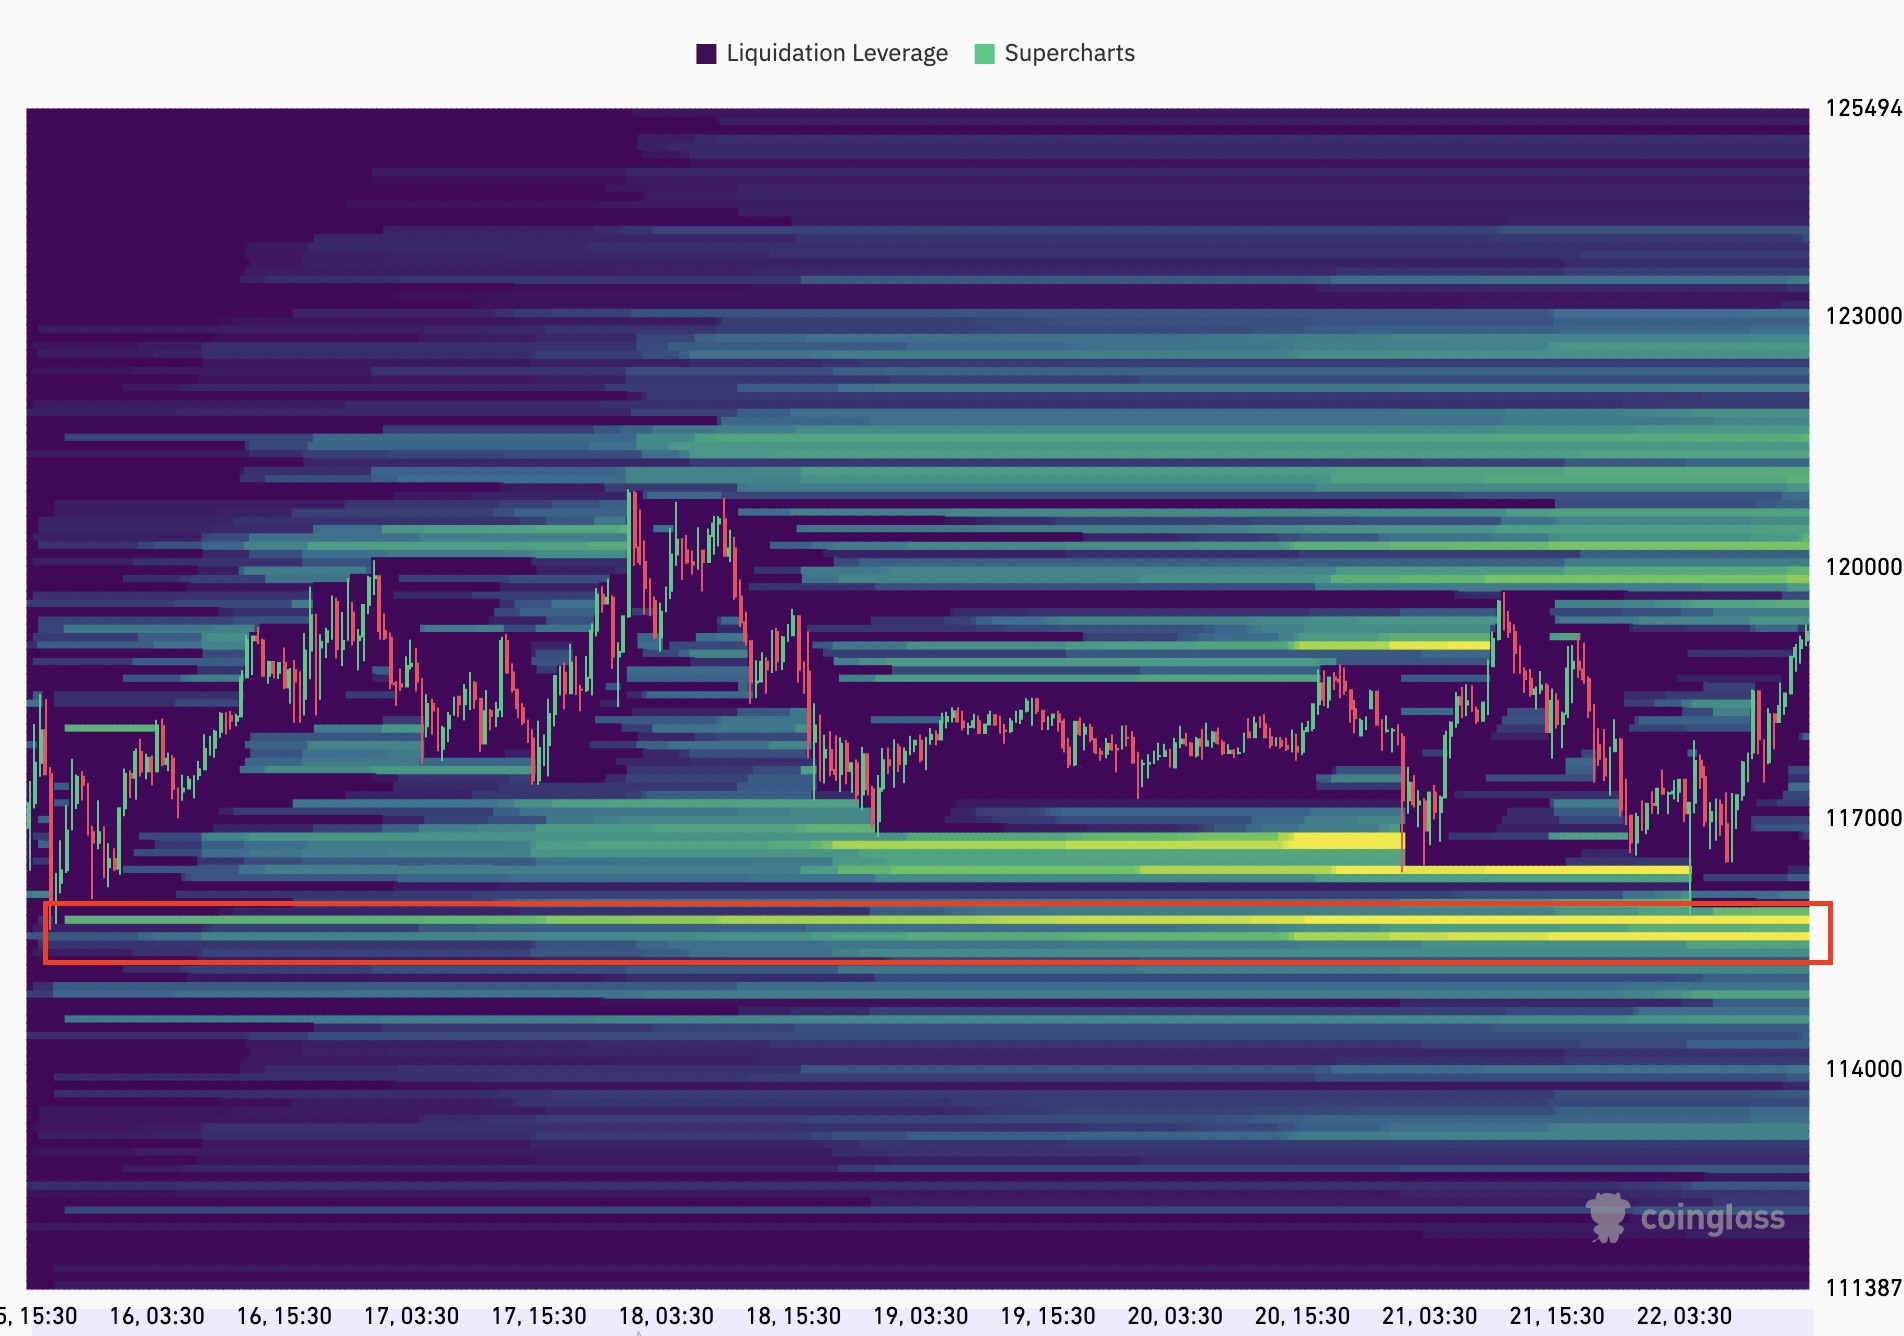
“Liquidity swept during a low liquidity weekend!” According to popular analyst AlphaBTC, Bitcoin might drop a bit further to capture liquidity near the $115,000 mark.
The BTC liquidity map indicates that the order book appears poised for such a move, with substantial bid clusters situated between $115,000 and $116,100.
“A small dip may give bulls the necessary momentum for another push upward.”
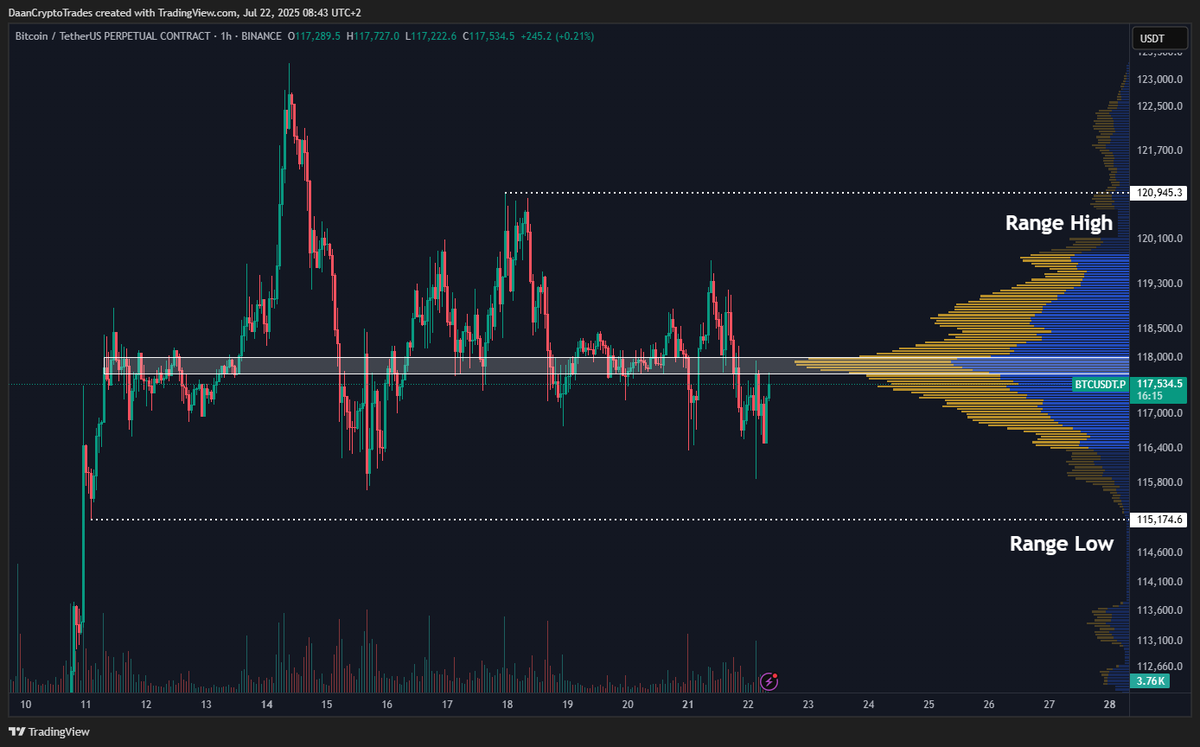
Analyst Daan Crypto Trades observed that the price of BTC has paused near its all-time high, noting that the bulk of the trading volume has been concentrated around $118,000, placing it at the midpoint of the current trading range.
The analyst advised followers to watch the $115,000 level as a support point and the $121,000 level as resistance.
“Monitor these local highs and lows for potential liquidity sweeps.”
This article should not be interpreted as investment advice or recommendations. All investment and trading actions involve risk, and readers are encouraged to perform thorough research before making any decisions.