

Bitcoin demonstrates fresh upward momentum, recovering losses from its prior price correction. Currently, BTC’s value exceeds $89,000, trading around $89,062 – reflecting a 2.3% gain over the last day.
With the $90,000 milestone within reach, analysts are focusing on investor behavior and how their average acquisition costs might shape future price fluctuations.
Beyond traditional technical analysis relying on support and resistance levels, data-centric insights derived from blockchain analytics are gaining prominence.
Key Levels Revealed Through Cost Basis Zones
CryptoQuant’s Crazzyblockk recently pointed out critical cost basis levels across various Bitcoin holder groups, providing valuable information regarding potential price reaction hotspots.
These zones, calculated from the realized prices of Bitcoin holdings categorized by age, are proving effective in pinpointing likely support and resistance areas.
The analysis hinges on realized prices, which represent the average purchase price for different holder groups, organized by the duration their assets remain untouched.
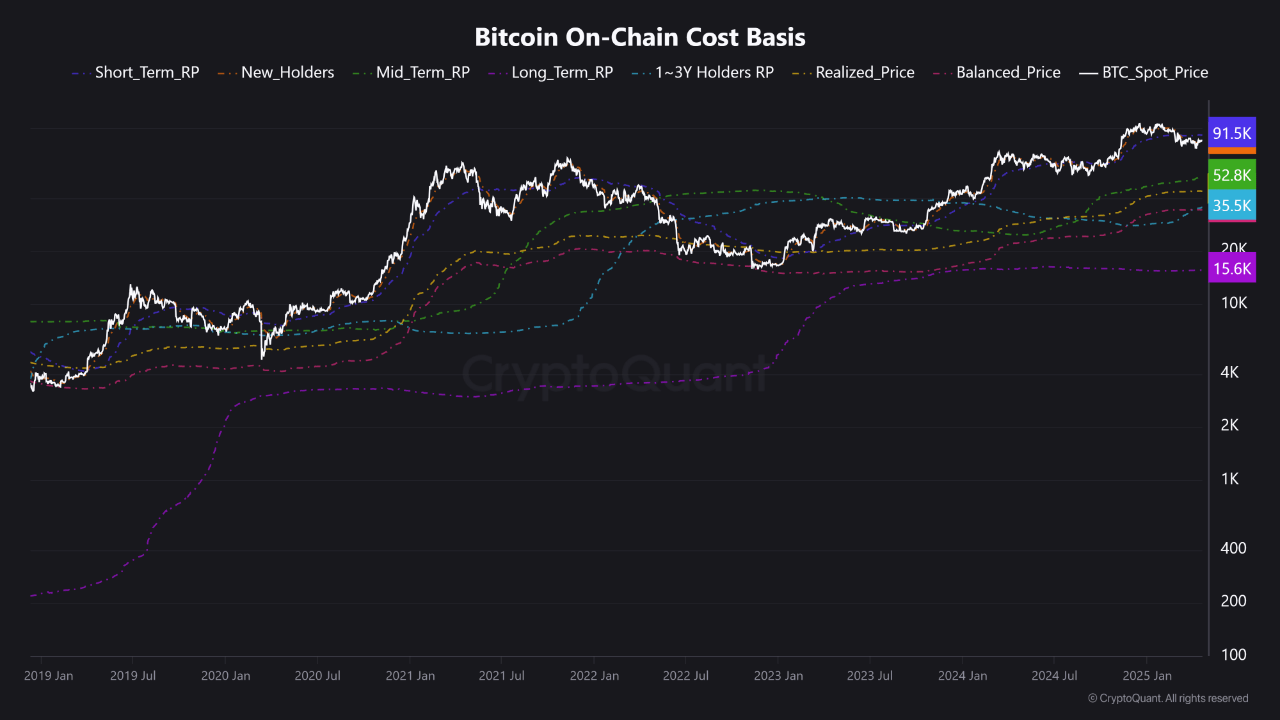
The analysis indicates that short-term holders, typically those who’ve held BTC for a maximum of 155 days, possess an average cost basis around $91,500. This level currently acts as a significant resistance point, signifying the price at which many recent investors would transition from losses to profitability.
Concurrently, the cost basis for new entrants, specifically those holding for 1–3 months, is estimated at approximately $83,700. This range serves as a support zone, reflecting the average entry point for recent market participants.
When Bitcoin’s price remains above this threshold, new buyers are more inclined to maintain their holdings, potentially lessening near-term selling pressure. Conversely, a drop below this level could trigger capitulation among newer holders, increasing downside volatility.
Deciphering Investor Conduct Via Cost Basis Assessment
The methodology underpinning these observations involves segmenting Bitcoin’s Unspent Transaction Outputs (UTXOs) according to their age and calculating realized prices for each segment.
This allows experts to pinpoint where investor clusters might be holding profitable or loss-making positions. Crazzyblockk explains these zones operate as adaptive support and resistance levels, derived not from technical indicators, but from actual market participant behavior.
Such data-driven metrics provide context beyond short-term market conjecture. Should Bitcoin surpass the short-term holder realized price near $91,500, it could signal continued bullish momentum, as more holders return to profitable positions.
Conversely, a decline below the $83,700 support level may introduce new selling pressures, particularly from individuals who entered the market during the recent price surge.
Featured image created with DALL-E, Chart from TradingView

Editorial Integrity at Bitcoinist is paramount, ensuring thoroughly researched, precise, and impartial content. We adhere to stringent sourcing protocols, with each article rigorously reviewed by leading technology experts and veteran editors. This process guarantees the integrity, relevance, and value of our content for our readership.