

Key Points to Consider
AAVE displays positive indicators: a “supertrend” indicator suggesting a buy, a completed cup and handle pattern, and a decrease in exchange holdings. Overcoming resistance in the $330-$345 range could lead to a price surge toward $360, though selling activity may present a challenge.
Aave (AAVE) has recently shown a weekly “supertrend” buy signal, a pattern historically linked to significant price increases of 870% and 400% in previous market cycles.
Currently trading around $318, AAVE appears to be mirroring a bullish pattern, especially as this signal surfaces near a zone where prices have broken out after several months. In the past, this indicator has marked the beginning of substantial upward price trends.
Therefore, its return at this pivotal time reinforces the optimistic perspective, potentially setting AAVE up for another major rally if buyers can push prices beyond immediate resistance levels.
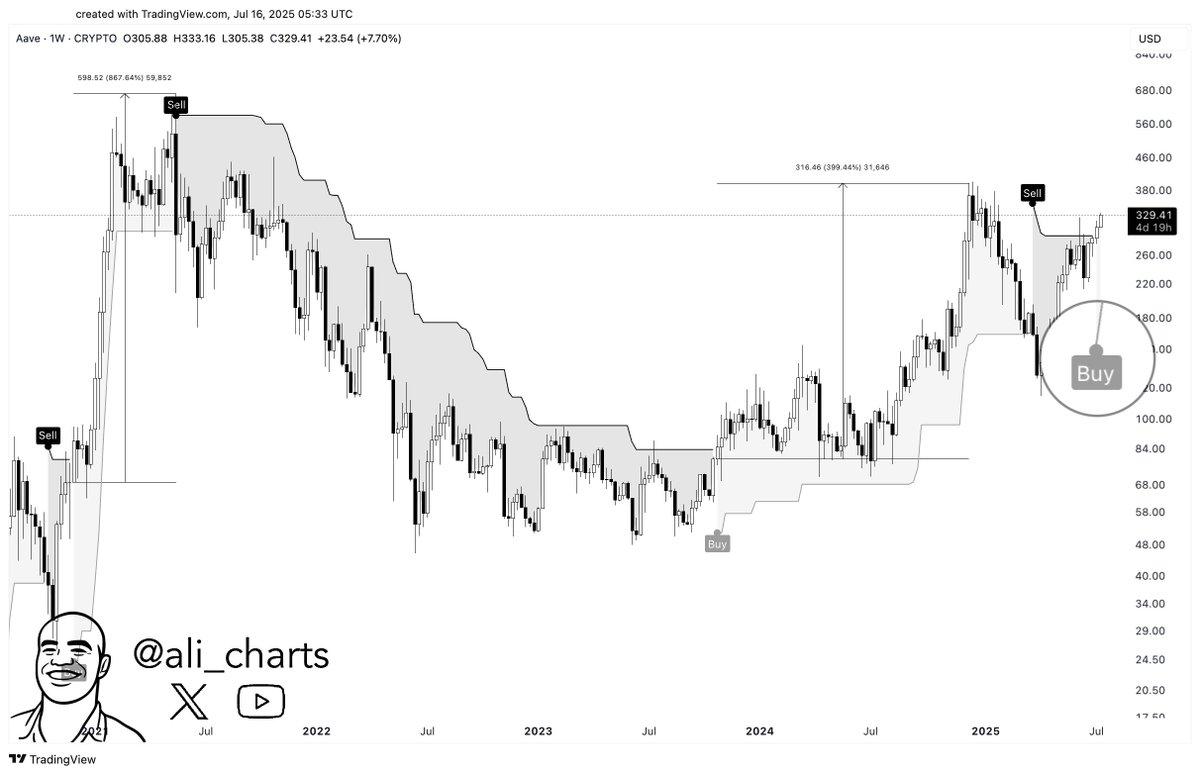
Source: X/Ali Charts
Could AAVE’s Cup and Handle Pattern Propel Further Gains?
AAVE has recently validated a classic cup and handle pattern, which is commonly regarded as a strong signal that an upward trend will continue.
The price broke out above the $308 level, and current price movement is steadily nearing the subsequent resistance point at $339.
This market structure frequently precedes substantial price increases, especially when supported by growing trading volume and upward momentum. The pattern’s balance and duration suggest significant accumulation activity.
Therefore, this formation offers a robust technical foundation for additional gains, particularly if AAVE decisively surpasses the $339 resistance level.
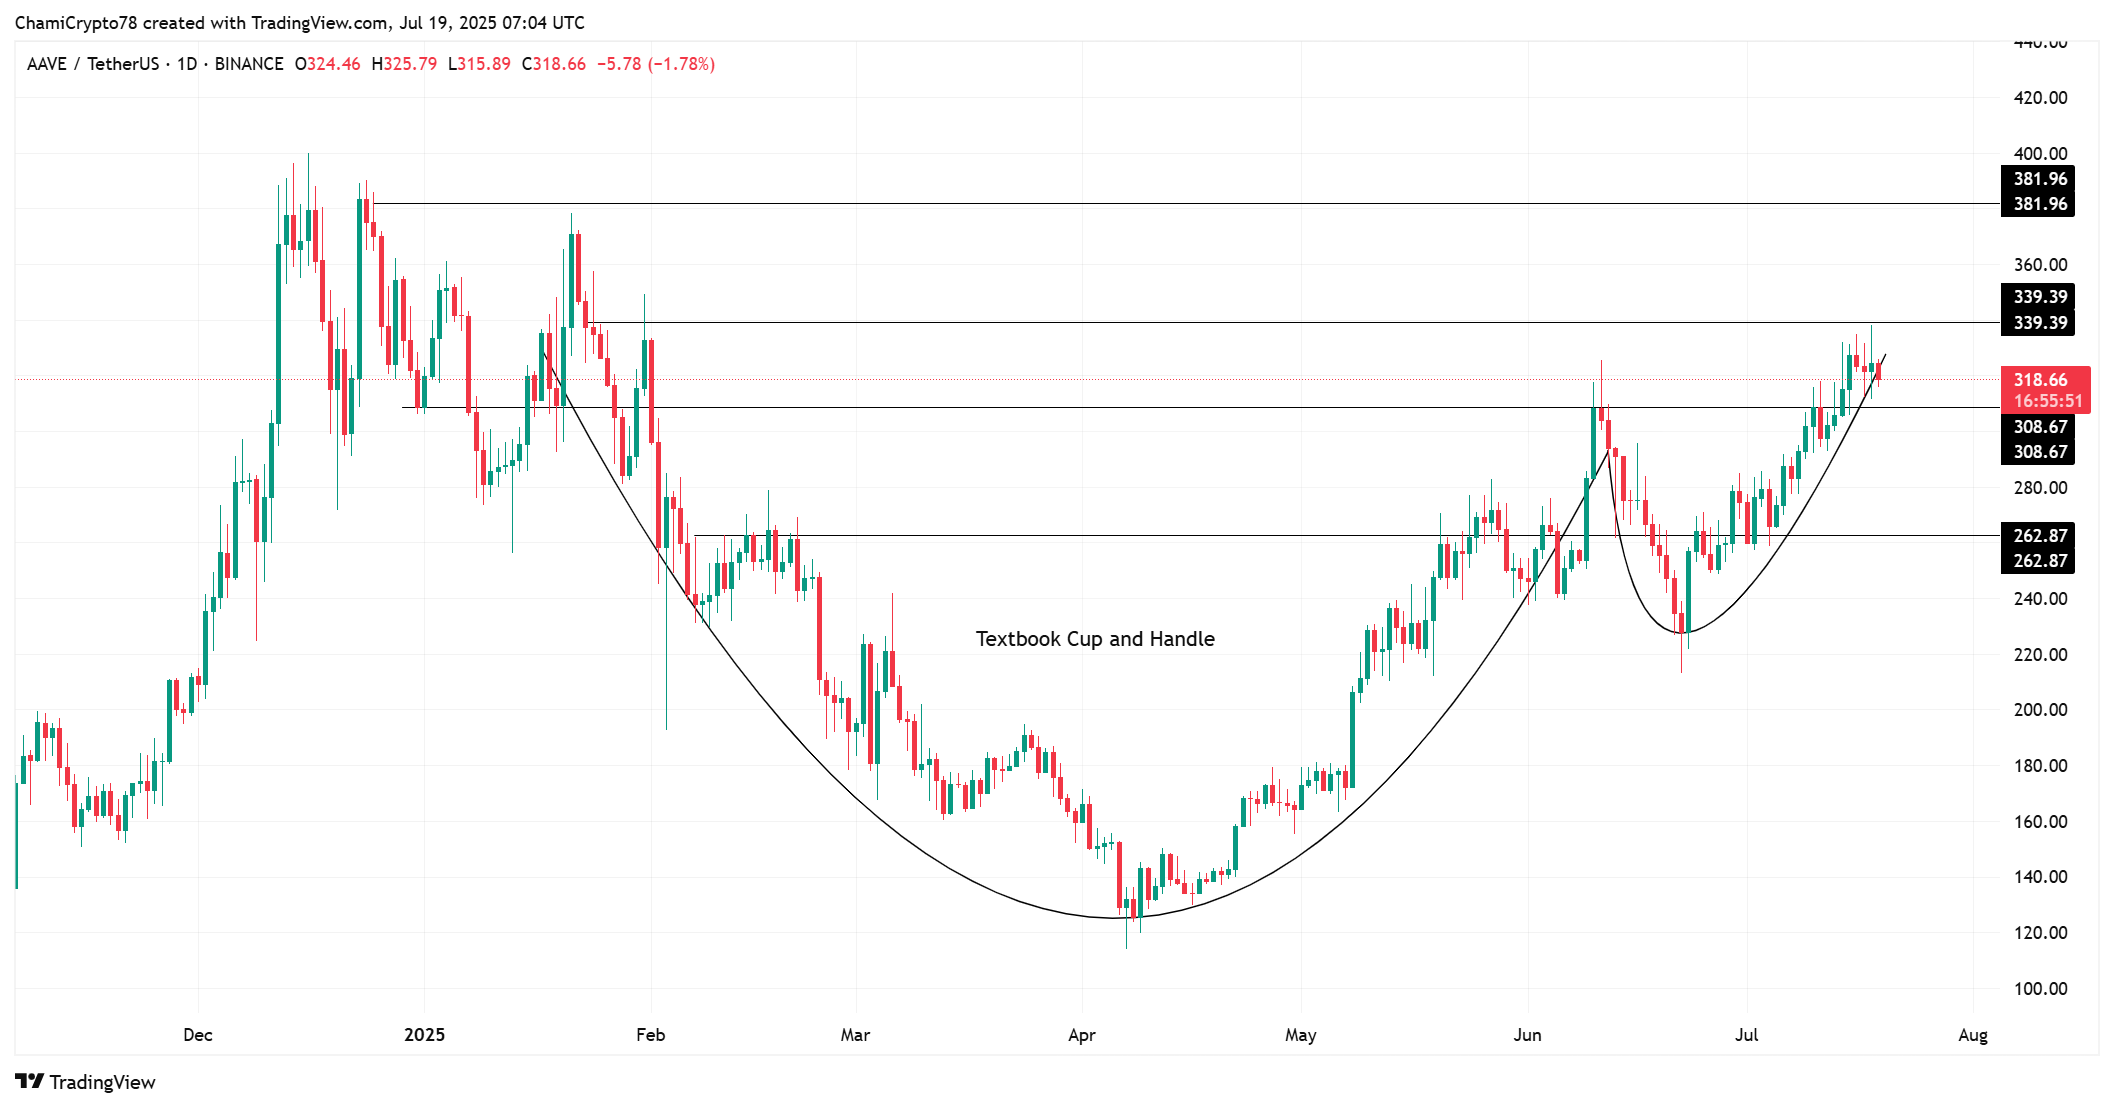
Source: TradingView
Does the 3.79% Reduction in Exchange Holdings Suggest a Positive Outlook?
Information gathered from the blockchain indicates that the total value of AAVE held on exchanges has decreased by 3.79%, currently sitting at $754.37 million.
This decrease suggests a lessening of potential selling pressure, as investors are transferring their assets away from centralized trading platforms.
Historically, these types of movements have preceded increases in price, since the amount of available supply for immediate sale decreases.
Although this factor alone does not guarantee an upward price movement, it does support the positive outlook suggested by the technical indicators.
Therefore, the reduction in exchange reserves aligns with the ongoing narrative of growing investor confidence and a reduced intent to sell in the short term.
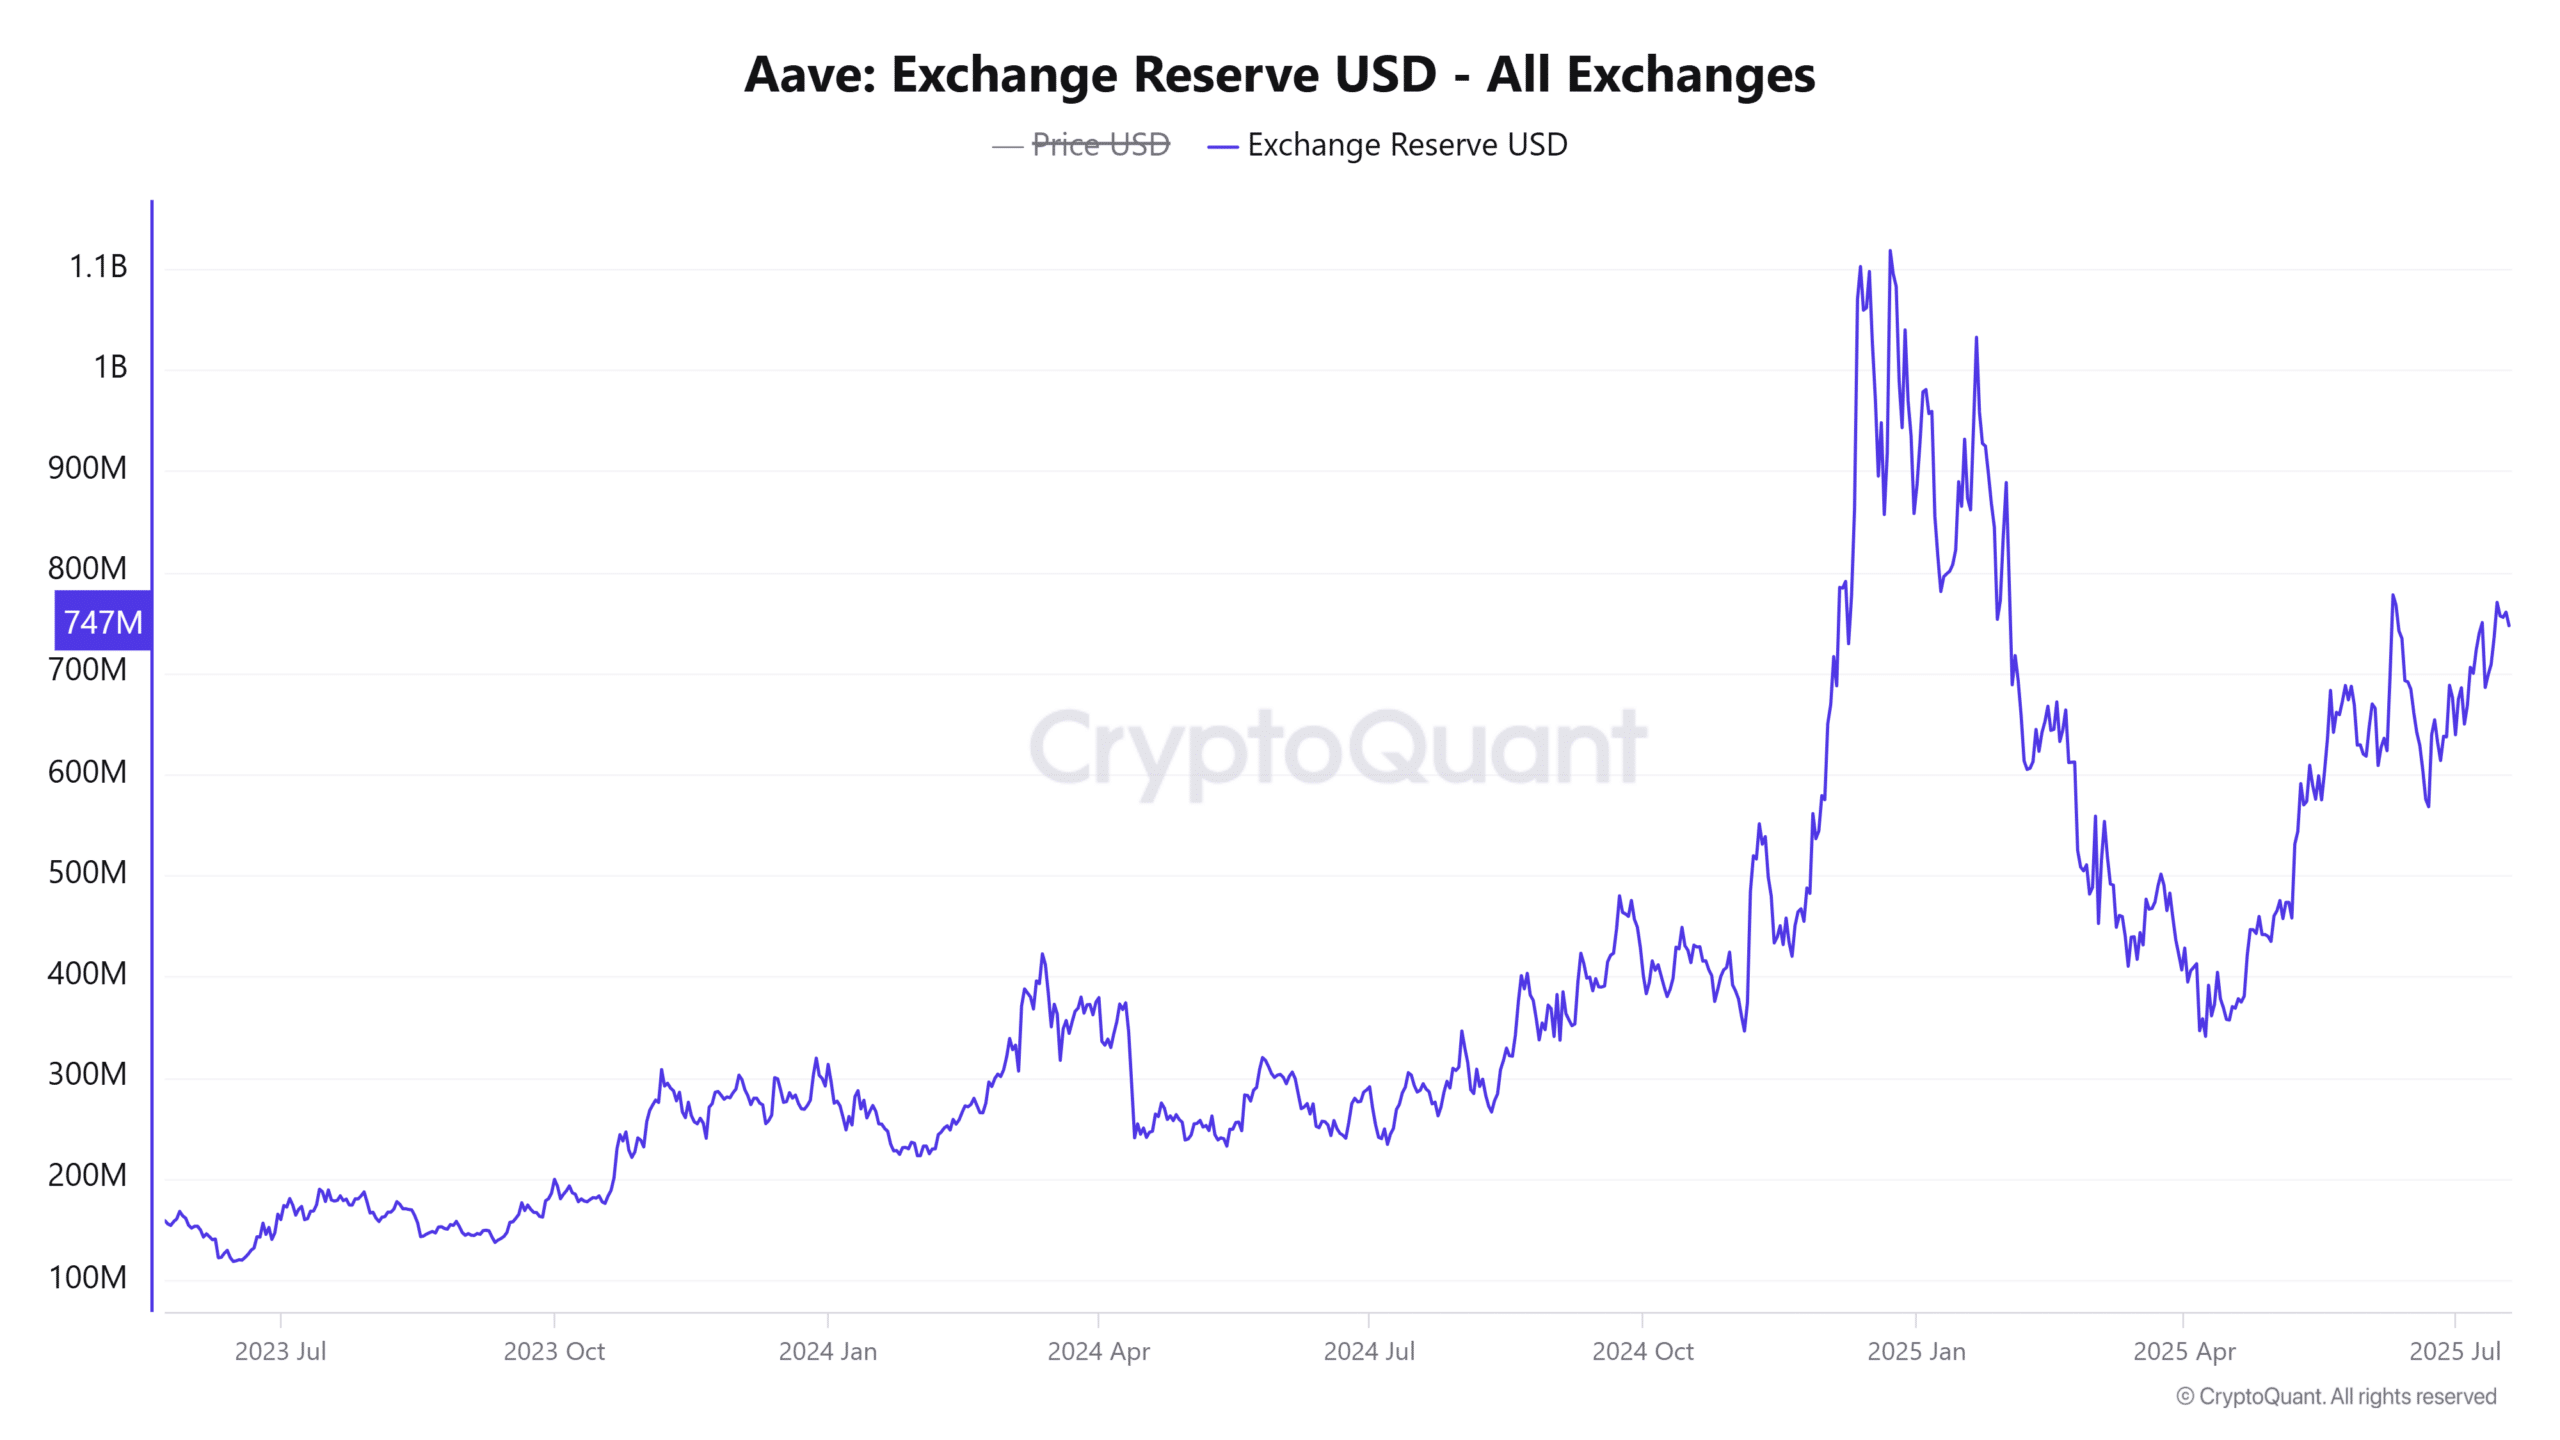
Source: CryptoQuant
Could Consistent Selling Limit AAVE’s Progress?
Despite the promising technical signals, the Spot Taker CVD over a 90-day period currently indicates that selling activity is more prevalent than buying.
This suggests that traders who aggressively execute trades are still more inclined to sell rather than buy. While the overall market structure supports potential gains, this data indicates ongoing caution among short-term investors.
Therefore, buyers need to overcome this selling pressure in order to sustain any potential breakout.
If this selling trend continues, it could temporarily hinder upward momentum; however, a significant surge in buying activity could reverse this trend and support the bullish market structure.
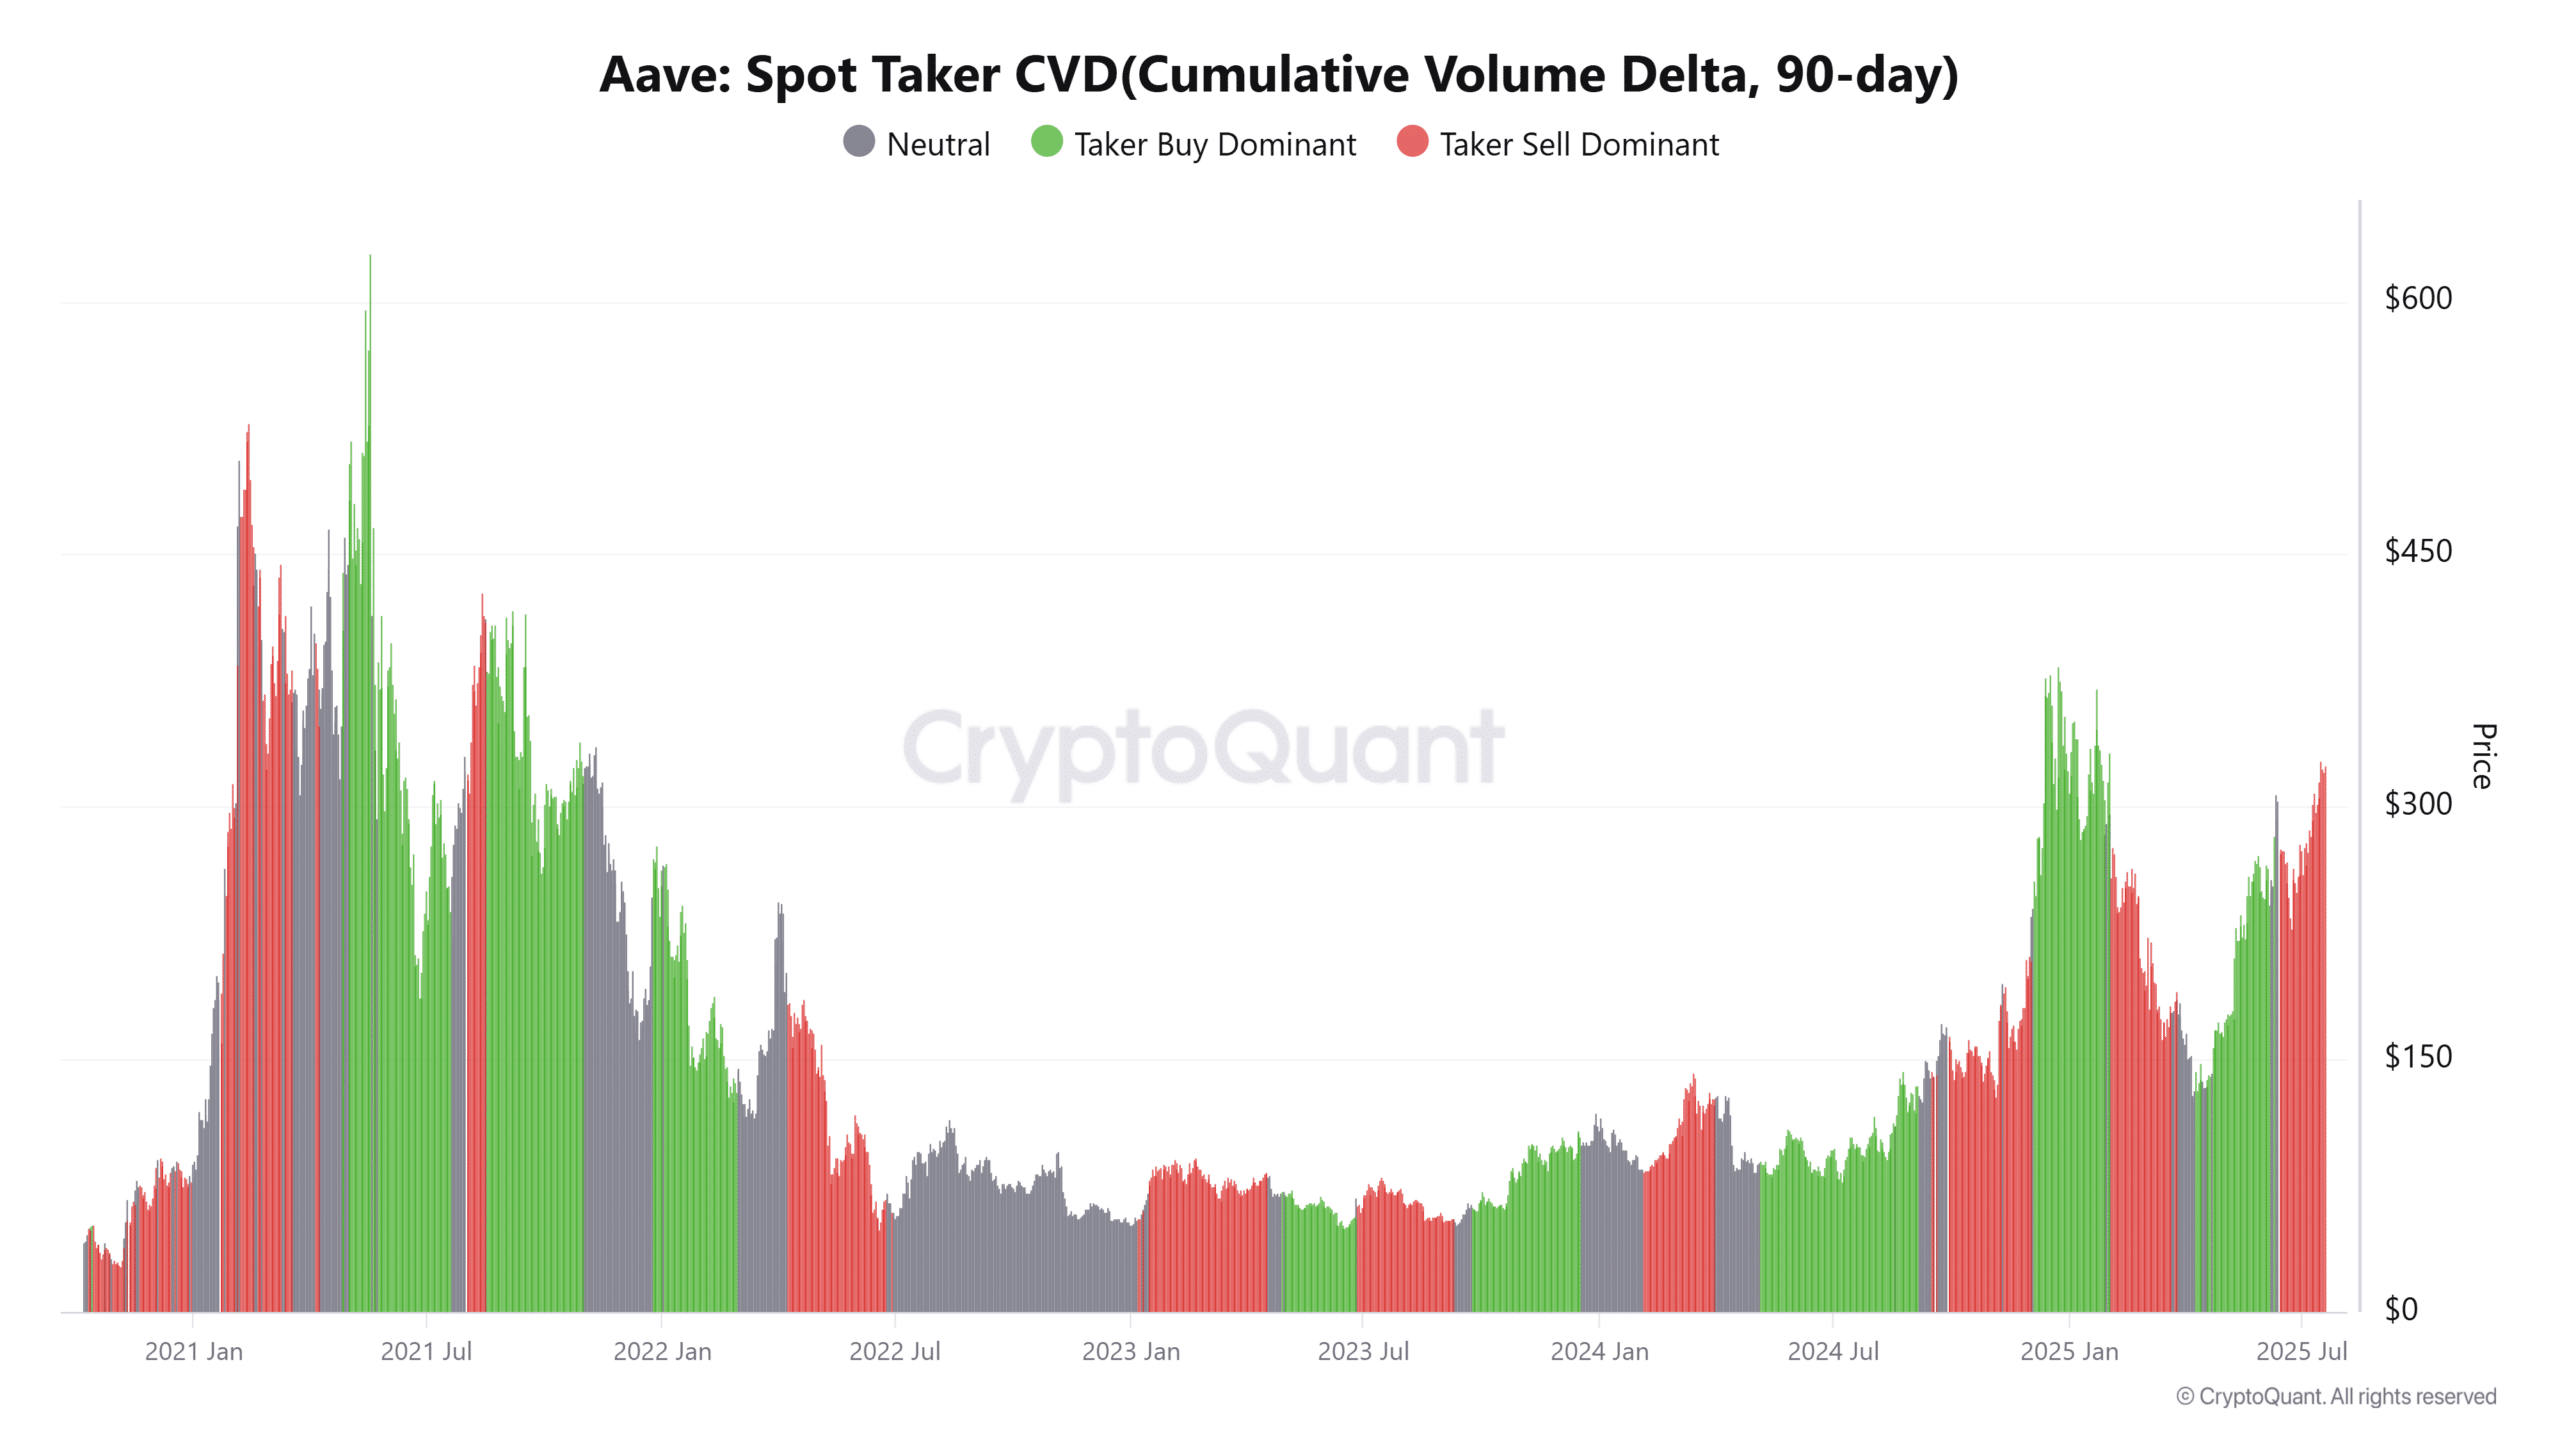
Source: CryptoQuant
Will Liquidation Levels Between $330 and $345 Initiate a Breakout Rally?
Data from CoinGlass indicates significant liquidation levels clustered between $330 and $345, suggesting numerous short positions are concentrated in this range.
These levels might act as temporary resistance points; however, a breakthrough above them could trigger a cascade of liquidations.
Such events frequently accelerate price movements due to forced buying to cover short positions. Therefore, if AAVE successfully exceeds this range, it could quickly advance towards $360 or even higher.
Monitoring price behavior around these levels will be essential to determine the strength of any potential breakout.
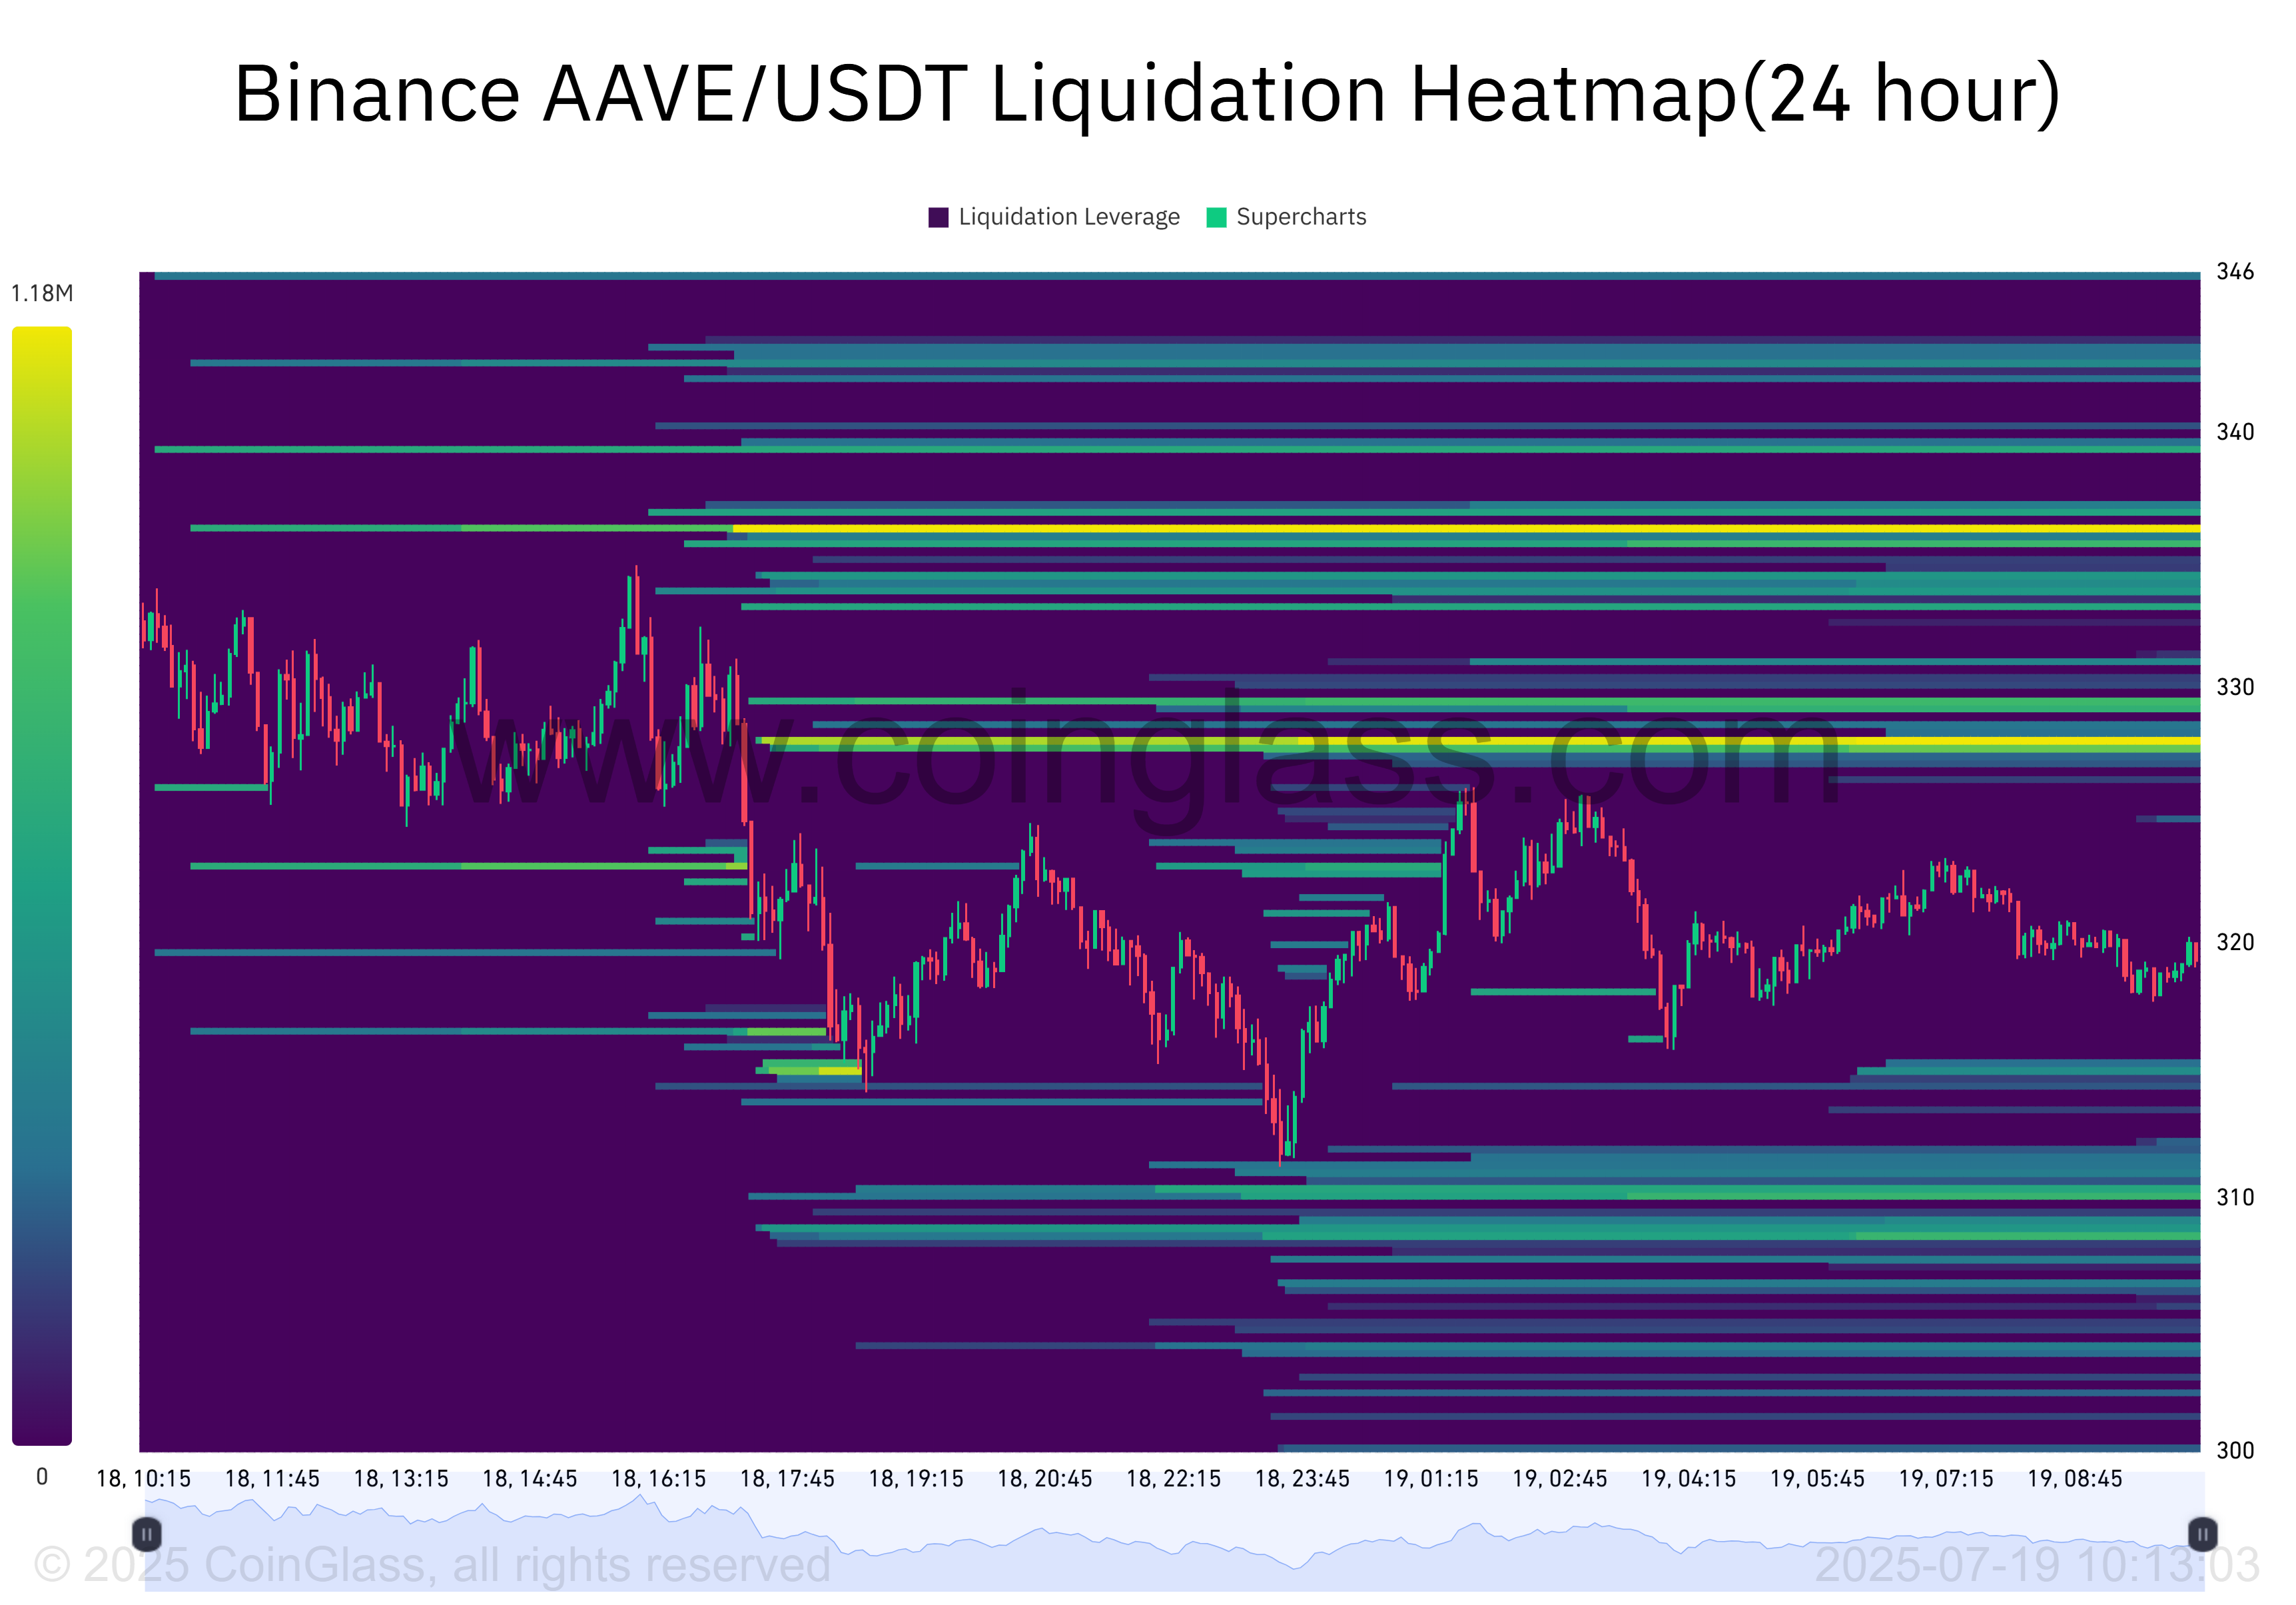
Source: CoinGlass
In conclusion, the convergence of positive signals for AAVE—including the SuperTrend buy indicator and the completion of a cup and handle pattern—points to significant potential for upward movement.
However, the resistance around $330–$345 and the persistent selling activity indicate a need for caution. If buyers maintain their momentum and overcome key resistance levels, another substantial rally could be on the horizon.