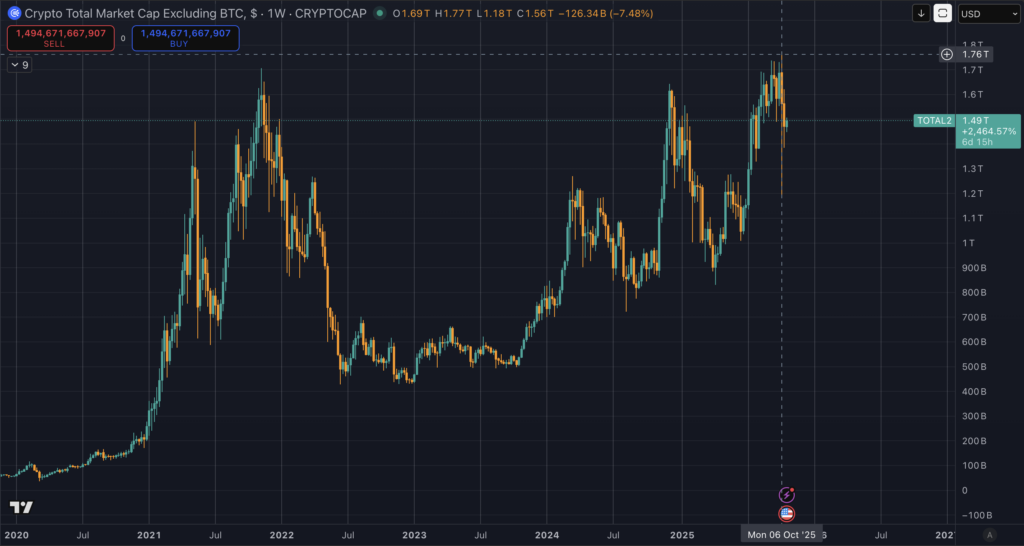
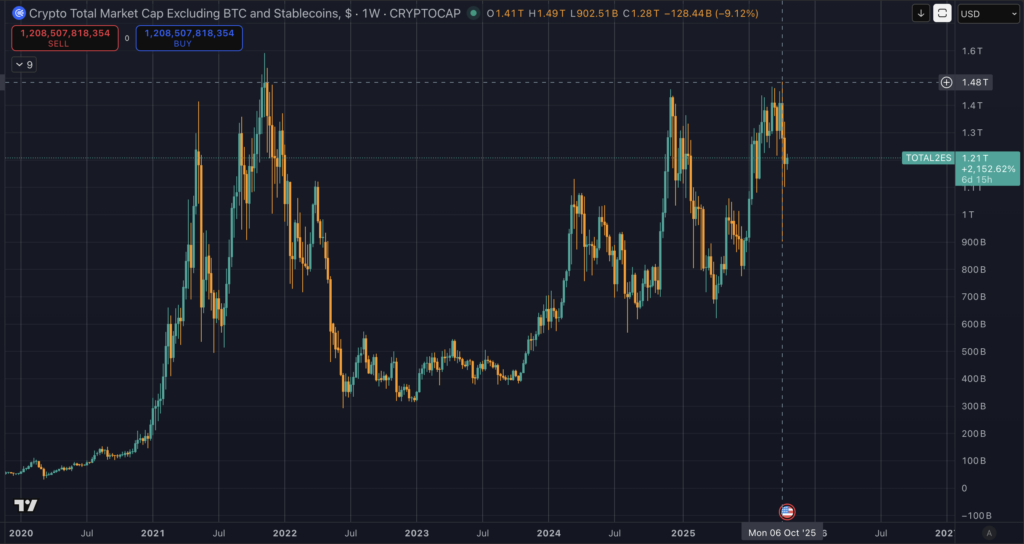
In early October, Bitcoin reached a new peak valuation, approaching $126,000. However, a wider view of the cryptocurrency landscape, specifically altcoins excluding stablecoins as gauged by TradingView’s TOTAL2ES index, hasn’t yet mirrored this achievement. The index remains shy of its prior apex around $1.6 trillion from November 2021, which is significant as the rotation beyond just Bitcoin to altcoins is yet to be confirmed in this market cycle.
As we move further into October, the TOTAL2ES index continues to show performance below that key resistance zone. While Bitcoin is soaring to new heights, altcoins are still struggling to match their previous cycle’s performance.
On the same day Bitcoin marked its most recent high, the altcoin market cap peaked at $1.48 trillion. That’s about $120 billion short of the 2021 peak, while Bitcoin has exceeded its former high by a notable 84%.
Several factors are influencing the market in the short term, determining whether we’re at a market top or if there’s potential for further gains.
Firstly, the clearest signal of evolving demand stems from tracking the flow of funds into and out of US-based Bitcoin ETFs. Farside’s data provides a daily overview of net ETF creations versus redemptions. Sustained streaks of positive inflows have historically correlated with upward market movements. Notably, digital asset ETPs achieved a weekly inflow record of approximately $5.95 billion in early October, indicating substantial demand but highlighting that continued inflows are needed to sustain price gains.
Secondly, liquidity conditions and policy expectations are influencing crypto asset pricing. The White House’s proposed 100% tariffs on imports from China starting November 1st has injected uncertainty into the market. This macroeconomic headwind has affected risk assets, including cryptocurrencies, as trade-related news coincided with Bitcoin’s recent peak and subsequent decline.
Retailers and supply chains are preparing for the potential tariff impact, which is further complicated by the upcoming holiday season influencing inventory management and pricing strategies. Simultaneously, Federal Reserve members are publicly considering another interest rate reduction in October. The probabilities implied by futures contracts are monitored via the CME FedWatch tool. Typically, a weaker dollar resulting from dovish Fed guidance would support risk assets, while renewed tightening would have the opposite effect.
Thirdly, ongoing dollar funding constraints present a practical limitation. A recent report in the Financial Times highlighted a notable increase in the use of the Federal Reserve’s Standing Repo Facility (SRF) – a safety net for banks facing short-term funding shortages. Increased SRF usage is a clear indicator that dollar liquidity is strained, which typically limits speculative investment until the situation improves.
Considering these dynamics, the market’s near-term direction hinges on ETF flows, options market positioning, and the availability of US dollar liquidity.
The following scenarios outline the necessary conditions for either a market top, a slight upward extension, or a prolonged period of top formation.
| Scenario | Conditions to watch | Plausible path & timing | Price ranges to model | Invalidation |
|---|---|---|---|---|
| Top already in | U.S. spot-BTC ETFs showing neutral or negative net flows across multiple days (tracked via Farside), put options remain dominant in the 25-delta skew on Deribit (as monitored by Laevitas), sustained elevated usage of the SRF indicating tight USD liquidity (as reported by the FT). | A distribution pattern emerges between $94,000 and $122,000 for several weeks, followed by a breakdown indicated by repeated daily closes below approximately $108,000. | Model a potential drawdown of 35% to 55% from the $126,000 all-time high, suggesting stress-test low points between $82,000 and $57,000, consistent with historical bear market durations of 12 to 18 months. | Five to ten consecutive days of strong ETF inflows, a shift in options skew toward call options, and a decisive daily close above $126,300. |
| Late marginal high | Positive ETF creations across multiple days combined with easing trade tensions related to the tariff situation, and a more relaxed USD tone based on dovish commentary from the Fed and tracked through FedWatch probabilities. | A quick move through the previous high, a brief rejection, followed by a retest and then a marginally higher top before entering distribution. | Target a price range of $135,000 to $155,000 in Q4, reflecting a measured move of 7% to 23% above the prior all-time high, consistent with late-cycle extensions. | A return of net ETF outflows and a persistent premium on put options within the skew. |
| Extended top-building | Mixed ETF flow data, contained implied volatility, unresolved tariff issues, and intermittent SRF usage. | A trading range between $100,000 and $125,000 extending through late November, creating a time-based top that delays a clear attempt at further upside. | A second attempt pushed into early 2026, with the path dependent on whether inflows broaden beyond just Bitcoin. | A clear breakout with strong volume or sustained, multi-day ETF creations. |
The potential drawdown estimates are based on historical market cycles. Research from NYDIG shows past bear markets experienced deeper retracements, including around 57% after the 2017 peak and approximately 76% following the 2013-14 peak. The presence of ETFs and increased spot market liquidity could lead to a potentially less severe, but still significant, range for risk management.
The missing confirmation for altcoins is what distinguishes this moment.
Historically, during bull markets, the market cap of altcoins eventually surpassed the highs of the previous cycle as risk appetite broadened. Currently, TOTAL2 remains below the $1.63 trillion to $1.7 trillion range, even after Bitcoin’s recent all-time high in early October.
This discrepancy suggests that either ETF-driven inflows are concentrating on Bitcoin for a longer period compared to previous cycles, or that broader liquidity conditions are limiting capital rotation, causing higher-beta altcoins to underperform. The key indication of rotation is a weekly close for the TOTAL2ES index above that resistance band.
Inflows and derivatives positioning provide further insight into the rotation. The surge in ETP subscriptions in early October coincided with broad interest in Bitcoin and Ethereum, along with significant activity in Solana and XRP.
If these inflows persist over multiple sessions on the daily ETF reports, the probability of a late-stage marginal high increases. Conversely, if ETF creations stall or reverse, the case for a market top strengthens.
In the options market, the 25-delta skew on Deribit, tracked by Laevitas, provides a simple gauge of whether downside protection remains in demand after recent macroeconomic events. A shift toward call option demand typically precedes follow-through on upward breakouts, while persistent put option demand often limits rallies.
On the supply side, Bitcoin miners are facing tighter profit margins. Hashprice, which measures miner revenue per PH per day, dropped below $50-$53 in October as hashrate exceeded 1 ZH per second, putting pressure on older mining equipment. Luxor’s Hashrate Index tracks this trend in real time. Further price declines, higher energy costs, or a combination of both could force miners to sell their Bitcoin holdings into a market with limited liquidity, potentially amplifying price drops.
Cycle timing still aligns with historical post-halving patterns.
Previous market peaks occurred approximately 526 days after the 2016 halving and about 546 days after the 2020 halving. Applying this timeline to the April 20, 2024 halving, places mid-October through late November within the historical peak window. While the timing itself isn’t a guarantee, it highlights a period when market flow and liquidity signals are most crucial.
The central question is whether the demand driven by ETFs will expand to include altcoins, and whether liquidity conditions will ease sufficiently to sustain that demand.
If ETF creations return across multiple sessions, option skew shifts towards calls, and SRF usage declines, a marginal new Bitcoin high in the $135,000 to $155,000 range is possible before entering distribution. If inflows remain mixed or negative, and put option demand persists, the distribution scenario becomes more likely, and the potential drawdown range becomes the relevant consideration for risk management.
The cycle lacks the traditional altcoin confirmation until TOTAL2ES breaks above the 2021 high on a weekly closing basis. The market is currently reflecting this dynamic.
Notably, TOTAL2, which *does* include stablecoins, surpassed its 2021 all-time high by $20 billion on October 7, reaching $1.77 trillion.
However, our analysis focuses on TOTAL2ES (excluding stablecoins) because the presence of stablecoins is not indicative of a true altcoin bull run. High levels of parked stablecoins often suggest investors are rotating out of riskier assets.