

- Currently priced at approximately $568.36, Bitcoin Cash (BCH) is hovering near the bottom edge of its upward trend channel, established since April. This proximity raises concerns about a potential price decline.
- Recent activity reveals substantial accumulation by large investors (“whales”), along with a yearly peak price of $632.64, indicating robust buyer confidence.
- However, several technical indicators – including decreasing trading volume and bearish signals from the Elliott Wave Oscillator (EWO), Relative Strength Index (RSI), and Moving Average Convergence Divergence (MACD) – suggest waning upward strength and a considerable chance of a price correction towards the $500 mark.
Strong Underpinnings: Whale Activity and Retail Interest Despite Macro Uncertainty
In recent weeks, Bitcoin Cash achieved a new annual high of $632.64, driven by a noticeable surge in open interest and a strong buying trend in the derivatives market, highlighting significant investor appetite. Concurrently, there’s been considerable accumulation by large-scale investors: the most significant net influx of Bitcoin Cash since last July, reinforcing the presence of institutional backing. Furthermore, an increasing influx of retail liquidity appears poised to further bolster BCH’s price, especially as a new altcoin season begins and supported by a more favorable regulatory environment.
Nevertheless, in relation to the wider economy and regulatory landscape, caution is advisable. While the broader digital asset sector is gaining traction with institutional investors (through mechanisms like ETFs, enhancing the broader crypto landscape), BCH lacks specific regulatory advancements. The impending cessation of USDT support on the Omni platform (connected to BCH SLP), scheduled for September, could also constrict liquidity within that specific network. Thus, while strong accumulation and investor interest create a sturdy foundation for the cryptocurrency, its near-term trajectory will hinge largely on the evolution of technical demand amid ongoing uncertainty.
BCH Technical Analysis
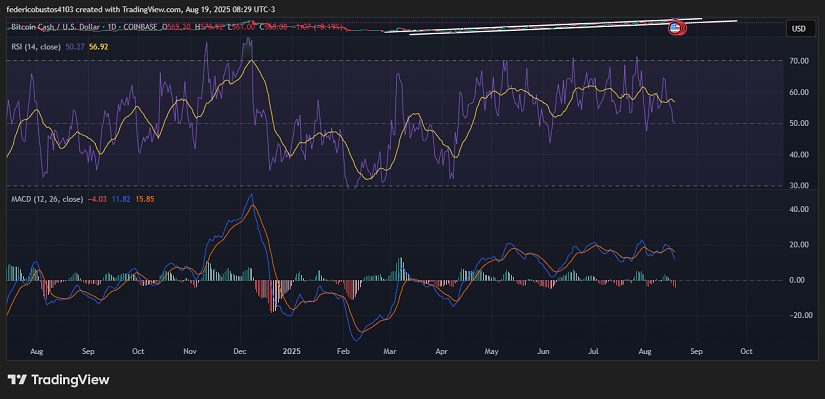
Bitcoin Cash has enjoyed a remarkable surge of over 152% since April 7th, ascending from approximately $250 to $632 during the August 13th session, nearly reaching the upper limit of its bullish channel. Since then, the price has begun a downward correction and currently trades around $568.36, very close to the lower support level of the channel.
Trading volume was substantial during the initial upward movement, but has notably diminished during the pullback, signifying diminishing buying conviction and early indications of technical exhaustion. The Elliott Wave Oscillator (EWO) corroborates this loss of momentum: the green bars have shrunk, signifying growing selling pressure.

The Relative Strength Index (RSI), presently near a neutral level (around 50), is showing a slight downward trend, indicating decreasing upward momentum with ample room to decline before reaching oversold levels. Lastly, the Moving Average Convergence Divergence (MACD) indicates a bearish shift: the faster-moving line has descended beneath the slower-moving line, and the histogram is now displaying negative values, further cementing the narrative that sellers are now influencing price movement.
Conclusion and Potential Scenarios
The technical pattern suggests a substantial possibility of a bearish breakthrough below the channel. Should this occur, the price will likely find support and liquidity near the $500 level, a crucial point for preventing a more extensive correction. To negate this negative prediction, a robust recovery characterized by increased trading volume would be necessary, enabling BCH to regain the $630–$640 price range.
Technical charts provided by TradingView.
Disclaimer: This analysis is for informational purposes only and should not be considered financial advice. Consult with a qualified financial advisor before making any investment decisions.
If you found this analysis useful, explore our ALTCOINS News section for further insights.