

- Bitcoin Cash saw a modest rise of 2%, building on Wednesday’s strong 6% gain within an established upward channel.
- Analysis of Market Value to Realized Value (MVRV) suggests further upward potential for BCH before reaching levels historically associated with price reversals.
- Open Interest in Bitcoin Cash futures contracts experienced a significant jump of over 7%, signaling increasing market optimism.
Bitcoin Cash (BCH)
is currently trading up by 2% on Thursday, following a robust 6.39% increase the previous day. Trading within a defined rising channel pattern, BCH displays growing positive momentum and is approaching the key $500 price point. Furthermore, on-chain data using the MVRV ratio implies there is room for price advancement before hitting a zone where significant pullbacks have occurred in the past.
On-Chain Metrics Suggest Potential Fueling Further Bitcoin Cash Gains
Weekly data from Santiment’s Market Value to Realized Value (MVRV) indicator points to the possibility of Bitcoin Cash extending its current bullish trend. MVRV is calculated by measuring the average profit or loss realized by BCH investors. A higher MVRV typically means more investors are in a profitable position, raising the possibility of them taking profits.
The current MVRV ratio stands at 0.665. Historical data indicates that when the ratio reached 0.729, profit-taking activity emerged, as observed during March and May of 2024. This suggests additional upside is feasible before a similar wave of profit-taking might occur.
Bitcoin Cash MVRV data. Source: Santiment
Notably, a rise beyond 0.729 could propel the MVRV towards its December 2024 peak of 1.01, further increasing investor profitability.
Derivatives Market Signals Expectations for Extended Rally
Data from CoinGlass indicates that Bitcoin Cash Open Interest (OI) has risen to $471.99 million, reflecting a substantial 7.85% increase over the last 24 hours. A surge in OI suggests a significant influx of capital into the derivatives market, generally driven by increased buying pressure.
Further supporting this positive
forecast, the OI-weighted funding rate is now positive at 0.0014%, indicating call option purchases are outpacing short positions. A positive funding rate signifies that bullish traders are paying a fee to maintain their positions, compensating for any imbalances between spot and swap prices caused by heightened futures activity.
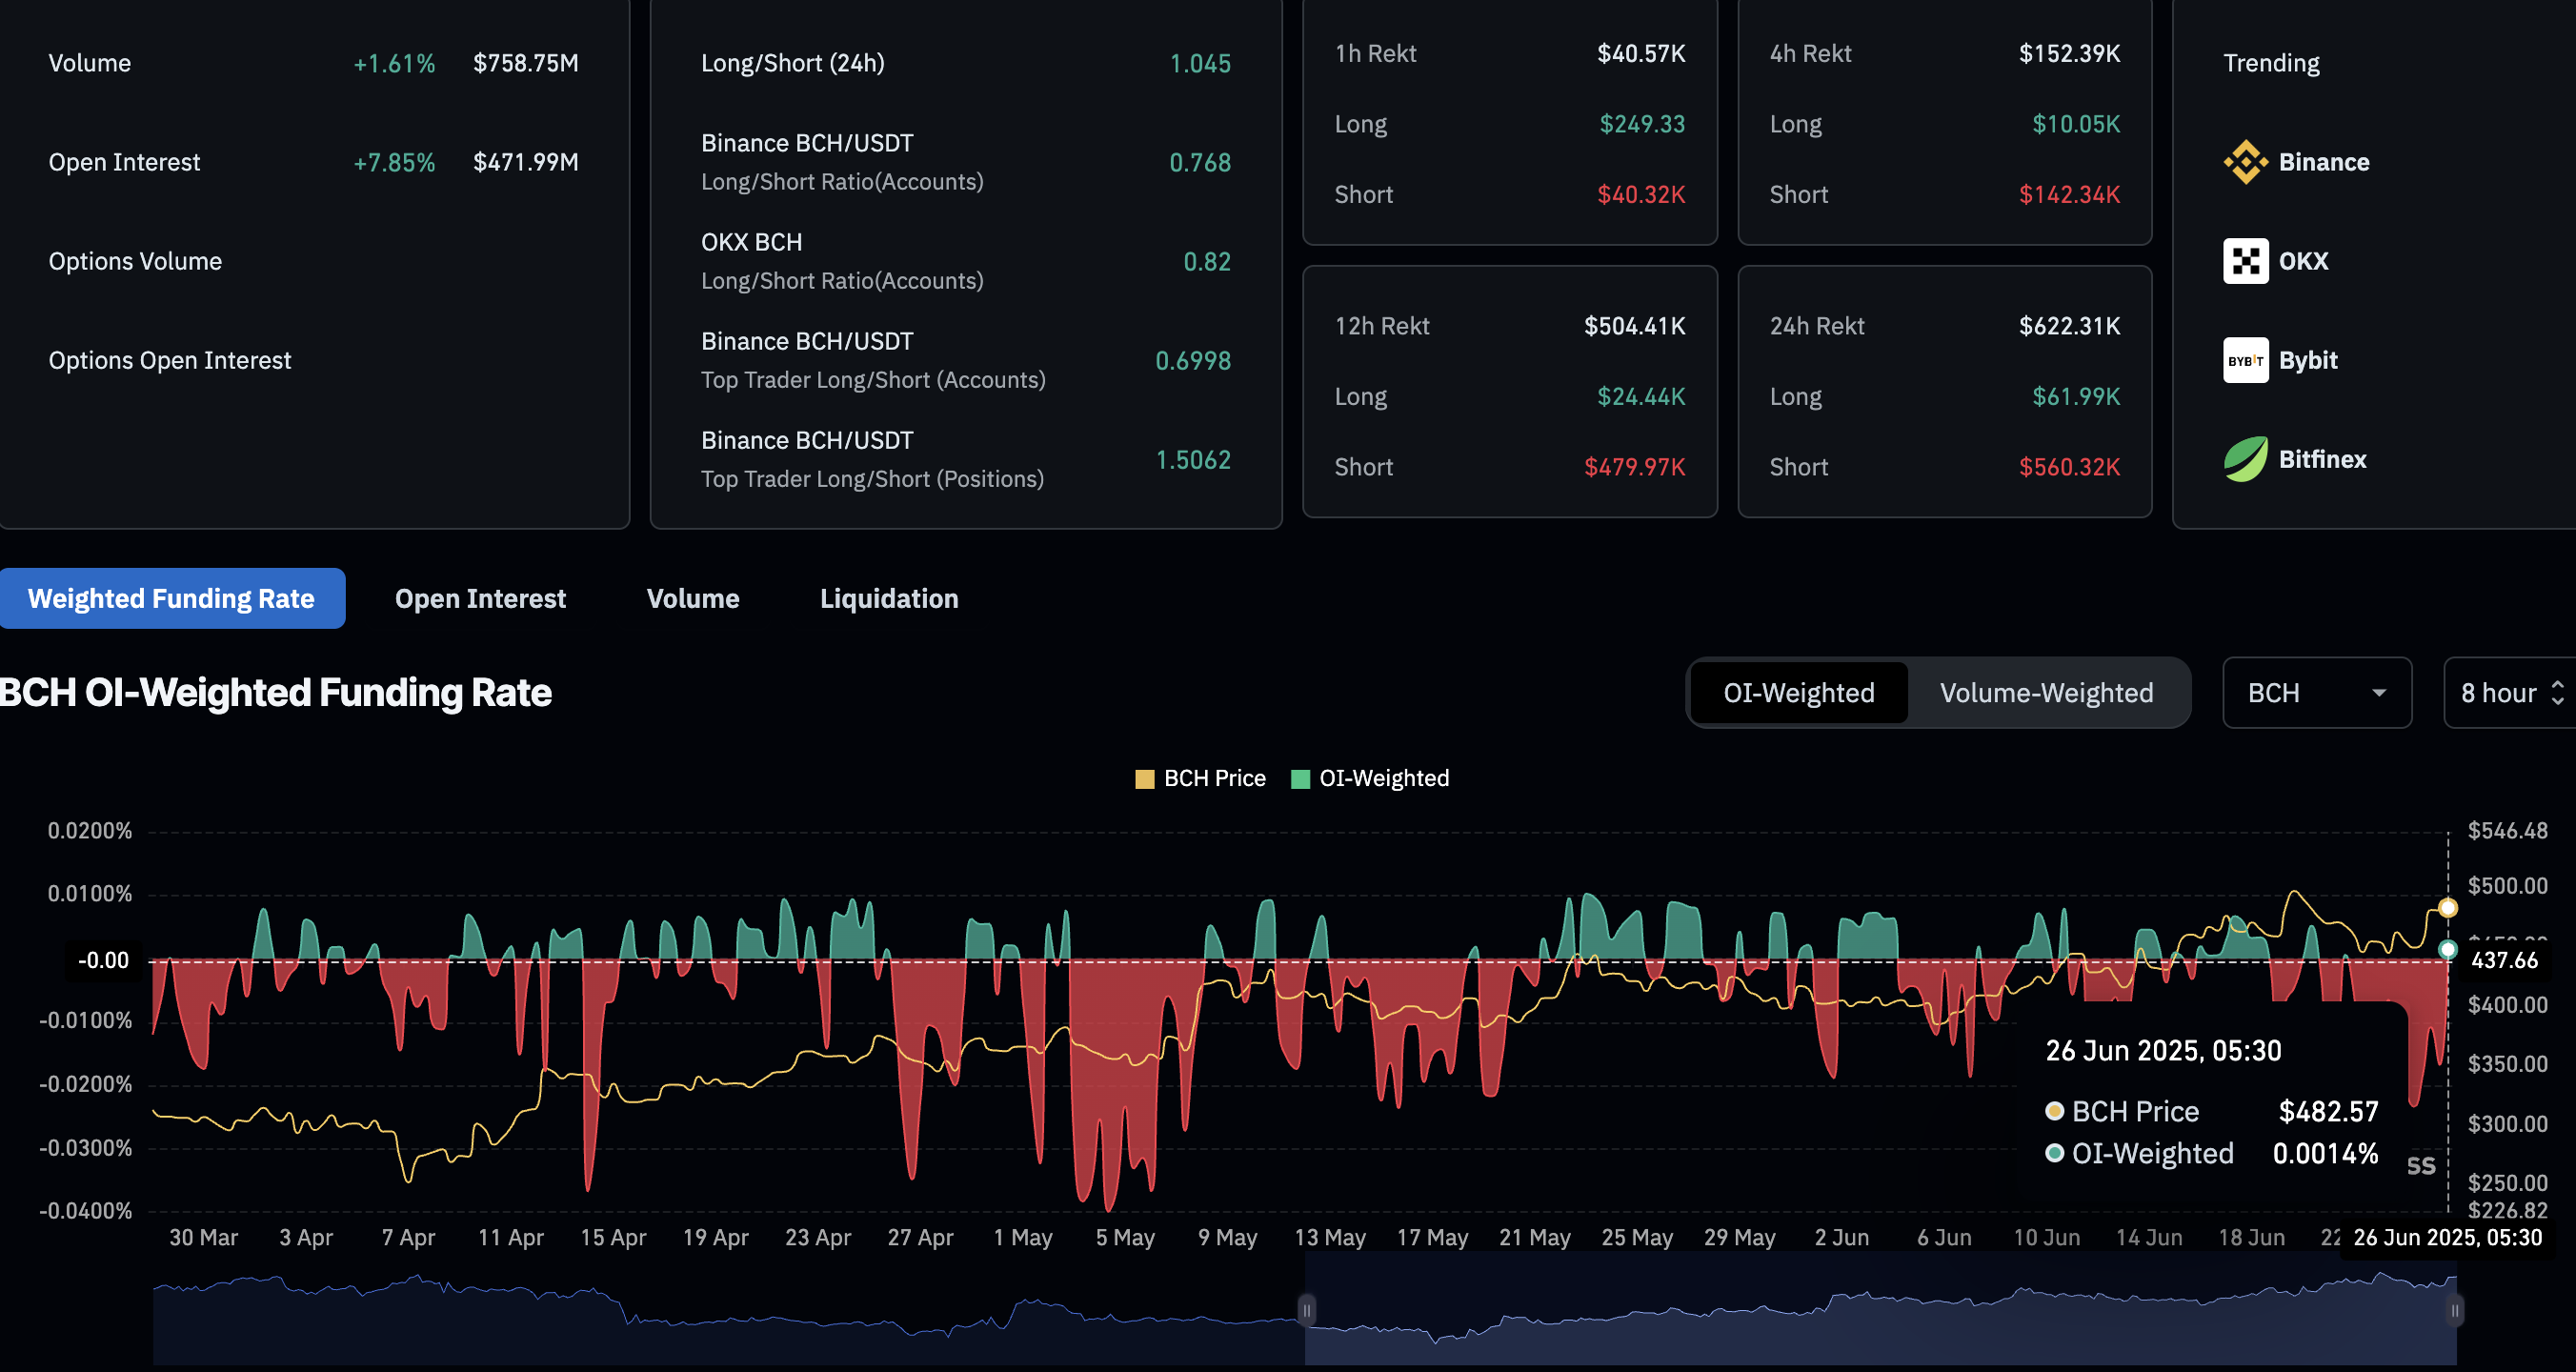
Bitcoin Cash derivatives data. Source: Coinglass
Bitcoin Cash Approaching Rising Channel Breakout
Bitcoin Cash is currently showing its second consecutive bullish candlestick pattern, recording a 2% gain at the time of this report on Thursday. BCH is nearing its year-to-date high of $505, which is positioned near an upward-sloping trendline formed by the peaks observed on May 10, May 23, and June 19.
The series of swing lows exhibited by Bitcoin Cash on April 16, May 5, May 30, and June 22, when connected, form a parallel support trendline. Together, these trendlines establish a rising channel pattern, which often suggests continuation of the existing upward trend.
The intraday upward movement of BCH has exceeded the 61.8% Fibonacci retracement level at $490. This retracement level is derived from the 52-week high of $640 down to the year-to-date low of $249. A confirmed close above the upper trendline resistance could drive the recovery towards the 78.6% Fibonacci level located at $556.
Considering the weekly MVRV data indicating potential for further growth, investors could see a move toward the 52-week high.
The Moving Average Convergence/Divergence (MACD) indicator is showing signs of bullish strength, avoiding a cross below its signal line.
The Relative Strength Index (RSI) reads 64, exhibiting an upward bias and maintaining above the neutral 50 level with recent positive momentum.
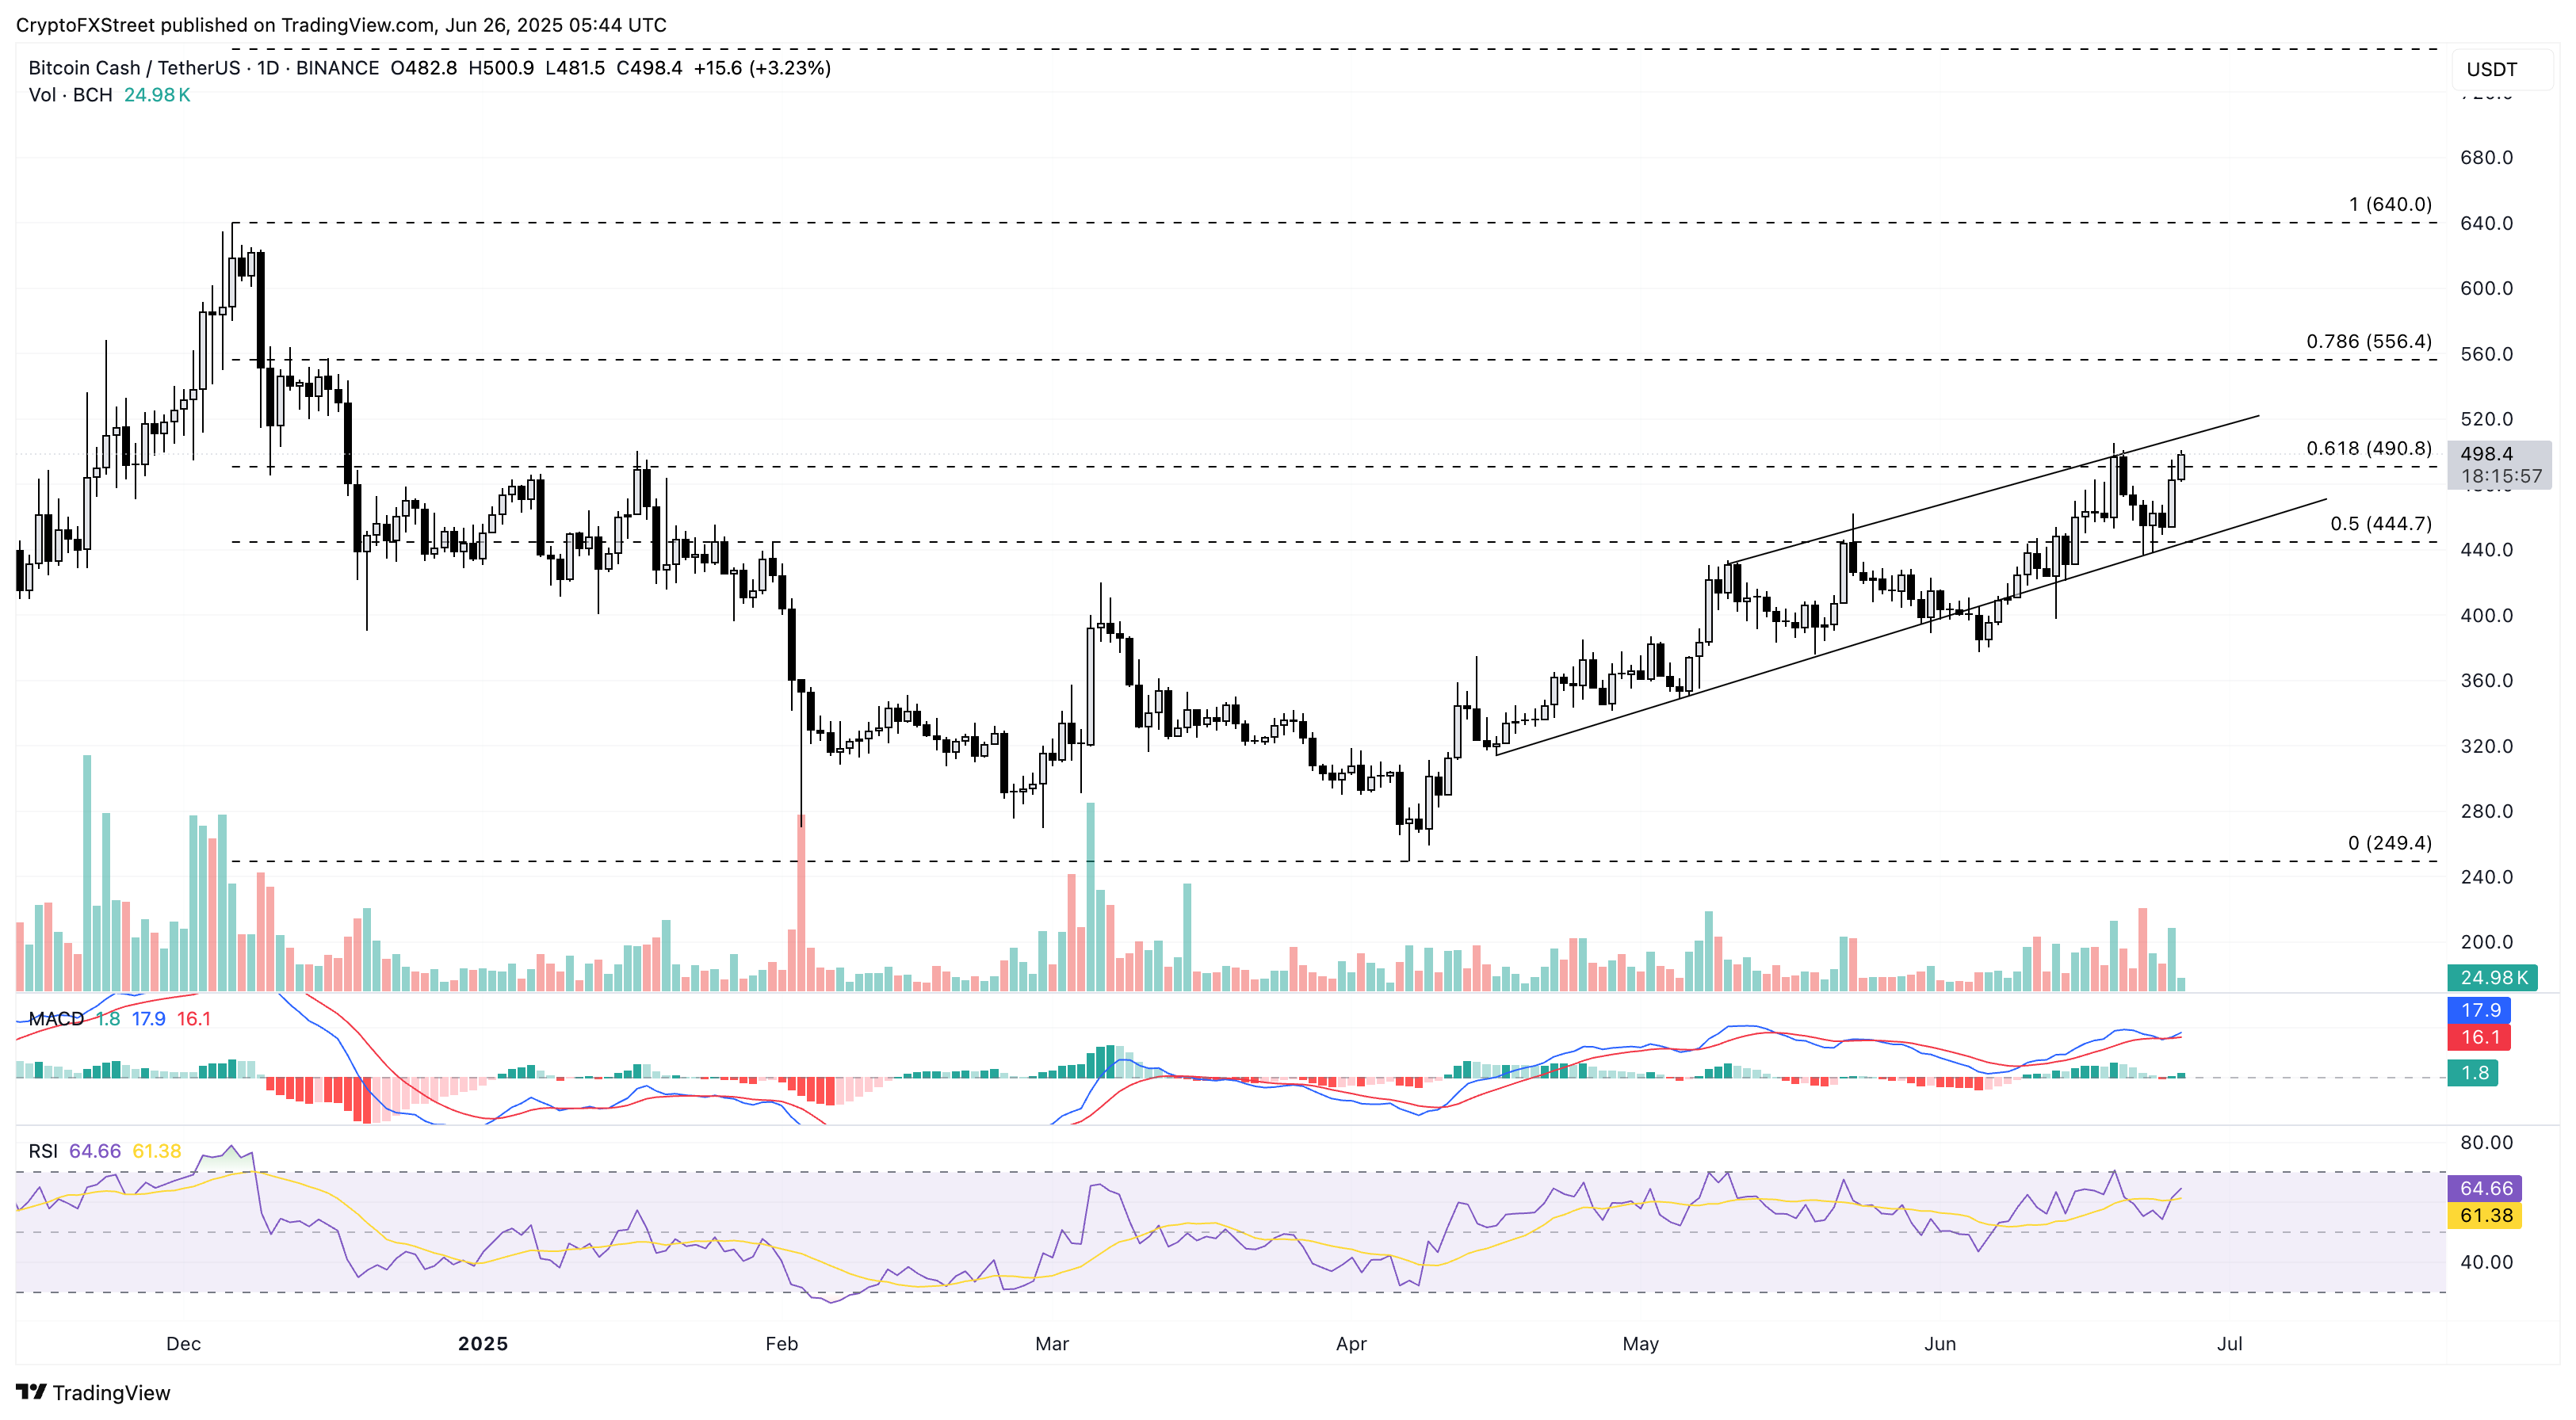
BCH/USDT daily price chart.
If Bitcoin Cash is unable to sustain a close above the 61.8%
Fibonacci
level at $490, it may retest the lower boundary of the rising channel pattern around $450.