

Bitcoin dipped below the $63,000 mark on Thursday as the cryptocurrency market witnessed increased selling pressure.
Summary
- Bitcoin’s price plummeted below $63,000 as sellers broke out of the May trading range, resulting in over $1.1 billion in liquidations.
- Market analysts are now closely monitoring support levels at $60,000, $55,000, and $50,000 as selling pressure intensifies in Bitcoin’s derivatives market.
- Current RSI and MACD indicators reveal that Bitcoin is significantly oversold, though bearish momentum persists.
This movement has taken Bitcoin to its lowest point since February, extending a significant decline that began after its May performance.
The downturn coincided with rising tensions between the U.S. and Iran, impacting broader risk markets. According to The Kobeissi Letter, Bitcoin has witnessed a loss of approximately $400 billion in market capitalization since May 11, alongside over $1.6 billion in liquidated leveraged crypto positions in just 24 hours.
Bitcoin’s value dips below critical May range
Prior to this latest decline, Bitcoin had already given up price levels around $72,000 and $68,000. The drop beneath $64,000, followed by $63,000, indicates that sellers are maintaining control over the short-term trend.
The cryptocurrency is presently trading within the $60,000 to $64,000 range, which is significant due to its proximity to previous demand levels that could determine whether Bitcoin steadies itself or plunges further toward deeper support.
As per market data from crypto.news, Bitcoin was reported at approximately $63,753 at the time of this report, marking a nearly 5% decrease, with a 24-hour low of about $61,557. This recent decline follows a week characterized by intense selling, erasing roughly 16% from Bitcoin’s value.
The latest market signals demonstrate considerable downward pressure, with buyers yet to establish a clear point of recovery. Bitcoin would need to surpass higher price thresholds for the short-term outlook to improve.
Increased liquidations exacerbate market turmoil
The derivatives market added further strain to the dropping spot prices. Over $1.6 billion in leveraged positions were liquidated within a 24-hour period, according to data from Coinglass.
Liquidations occur when exchanges mandate the closure of leveraged positions because the collateral is insufficient to cover the trades. In a declining market, this can exacerbate price drops since forced selling compounds regular market sell-offs.
This liquidation trend coincided with a broader shift in market sentiment as risk assets faced pressure following renewed tensions between the U.S. and Iran amid stalled ceasefire discussions.
Analysts monitoring critical levels at $60K, $55K, and $50K
Analyst Captain Faibik observed that Bitcoin remains above a significant eight-year trendline. He stated, “If bulls can defend this level and create a solid base, we may be entering the early phases of another significant bull run.”
$BTC is sitting right above its major 8-yr trendline..!!
If Bulls defend this level and build a base, we could be witnessing the early stages of another mega bull run..
Bitcoin could briefly sweep liquidity around 54-55k, shake out weak hands & then Reverse into a massive… pic.twitter.com/x3Xr0tt2Is
— Captain Faibik 🐺 (@CryptoFaibik) June 4, 2026
He cautioned that Bitcoin could temporarily reach liquidity around the $54,000 to $55,000 zone before any robust recovery takes shape. This timeframe is critical for determining Bitcoin’s long-term trajectory.
Ali Charts noted that Bitcoin’s breakdown beneath $72,000 places it in a precarious position. He indicated that the next major support zone is likely between $54,000 and $50,000 based on MVRV pricing bands.
CryptoQuant founder Ki Young Ju also highlighted unusual selling pressure, stating that the average cost basis for Bitcoin investors hovers around $53,000, suggesting a significant transfer of holdings during this distribution phase.
Technical indicators signal weakness
Bitcoin’s RSI currently stands at 18.69, indicating that it is well within oversold territory. While this suggests extreme selling momentum, it does not necessarily signal an imminent reversal.
A more definitive recovery would require the RSI to climb above 30, and a subsequent return to the 50 range would imply that buyers are regaining market control.
The RSI moving average held at 35.57, considerably higher than the current RSI figure. This disparity indicates the rapid pace of the selloff and illustrates that buyers have yet to close the momentum gap.
MACD indicators also remain in a bearish state, with the MACD line around -2,917.77, positioned below the signal line near -1,584.86, while the histogram shows a negative value near -1,332.92.
Volume data from Binance reflects ongoing selling pressure
Arab Chain reported that the Binance CVD Confirmation Score reached approximately 0.80, marking its highest level in four months. This reading coincided with Bitcoin trading within the lower $60,000 range during the downturn.
CVD, or cumulative volume delta, measures the balance of buying versus selling activity. A significant value during a market decline indicates that selling pressure is supported by substantial trading volume.
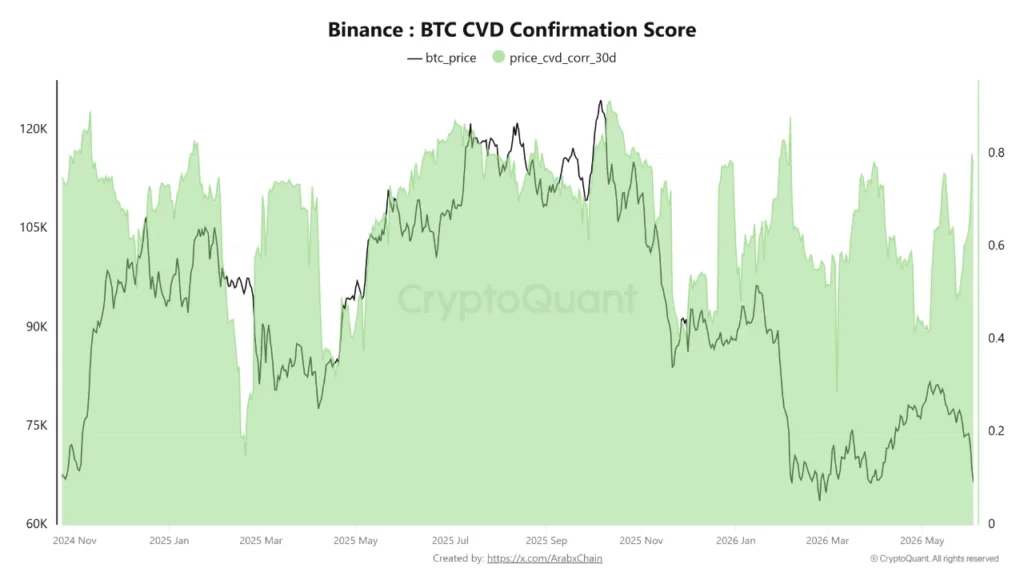
This is significant as it suggests that the recent price movement was not simply the result of limited liquidity, but reflects active seller involvement throughout the downturn.
Currently, Bitcoin remains in an oversold state but is still technically bearish. A recovery above $64,000 and then $68,700 could alleviate some selling pressure, whereas a clear drop below $60,000 might shift the focus toward $55,000 and $50,000.
Disclosure: This article does not constitute investment advice. The information provided here is intended solely for educational purposes.