
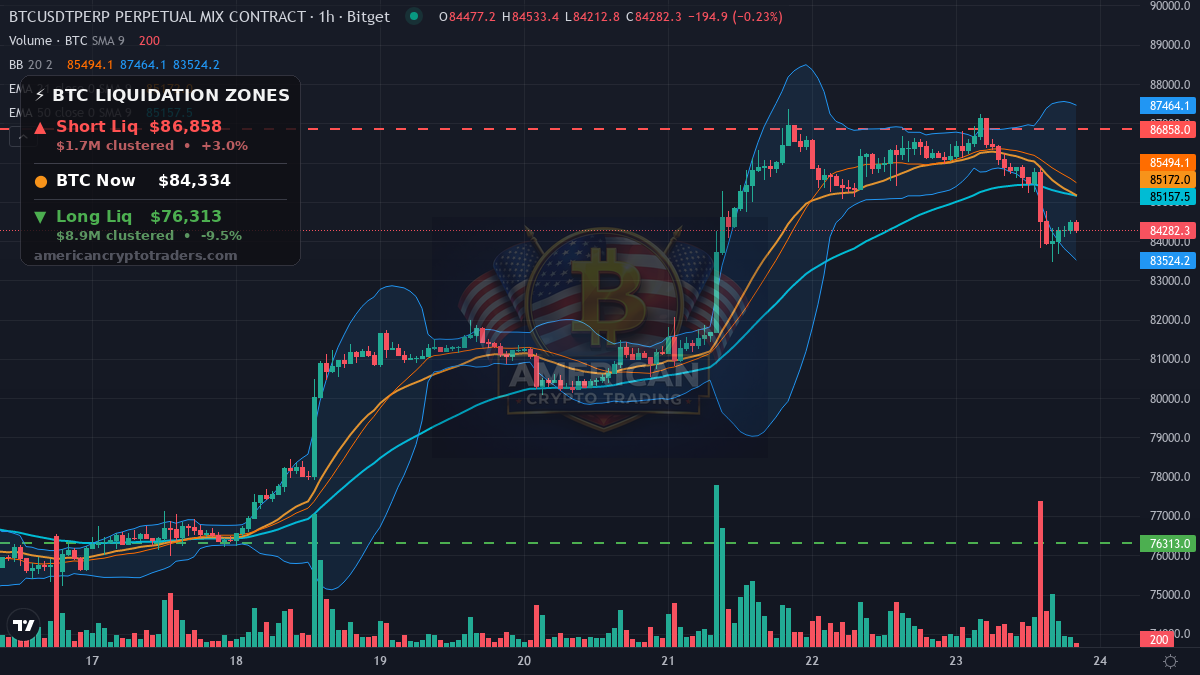
Wednesday’s New York session delivered a sharp reality check for leveraged bulls. This bitcoin market recap covers the full story: Bitcoin sold off from a 24-hour high of $87,241 down to a session low of $83,469 before stabilizing near $84,267 at the close, a decline of 2.36% on the day. The move was not a slow grind — it was a clean, forced flush driven by cascading liquidations, and it took most of the altcoin complex down with it.
Bitcoin Market Recap: Liquidation Cascade Breaks $84K Support
Bitcoin opened the New York session looking technically constructive, tagging $87,241 before sellers arrived in force. From that high, price broke down through several support levels in rapid succession, eventually printing a low of $83,469 — a nearly $3,800 range collapse inside a single session. The close near $84,267 left bulls holding a loss but stopped short of a full breakdown below $83K, which provides some technical context heading into the Asia open.
Volume on the day came in at roughly $3.29 billion, a figure elevated enough to confirm real distribution rather than thin-air movement. When large liquidation events occur on elevated volume, the resulting lows carry more weight as potential support — but they also leave behind a damaged order book that needs time and fresh demand to repair.
What Moved Markets Today
A $280M long liquidation cascade defined the session. When Bitcoin broke decisively under $84,000, it tripped a dense cluster of leveraged long positions that had built up during the prior rally toward $87K. Liquidations do not happen linearly — each forced sell order pushes price lower, which triggers the next band of stops, creating a self-reinforcing flush. The $280M figure reflects the total size of long positions the market forcibly closed, and it explains why the move felt vertical rather than gradual.
NYSE and Blockchain.com announced a partnership to bring tokenized U.S. stocks to crypto users. This is a structurally significant development, not a short-term price catalyst. When the world’s most recognizable stock exchange begins integrating with crypto-native infrastructure, it signals that institutional TradFi is no longer treating digital assets as a sideshow. The medium-term implication is deeper liquidity bridges between equity and crypto markets, which over time should reduce the friction that currently causes crypto to sell off in isolation during risk-off moments.
A Visa survey found that U.S. stablecoin adoption could surge meaningfully if bank-like consumer protections are put in place. The timing matters: stablecoin legislation has been gaining traction in Washington, and Visa — a payment network processing trillions annually — publishing this research adds institutional credibility to the regulatory clarity narrative. The mechanism here is straightforward: clearer rules lower compliance risk for banks, which lowers the barrier for mainstream stablecoin integration, which expands the on-ramp into the broader crypto ecosystem.
Altcoin Action
The altcoin complex absorbed far more pain than Bitcoin on Wednesday. Ethereum fell 3.12% to $2,669, touching a session low of $2,633, while Solana dropped 3.51% to $114.06 with a low of $112.87. Neither found meaningful buying interest during the Bitcoin flush, which is the typical pattern — when BTC liquidations cascade, altcoin liquidity dries up and bids step back.
Memecoins bore the worst of it. PEPE collapsed 10.8% and WLD shed 13.4%, ranking among the session’s sharpest losers. DOGE dropped 8.48%, slicing through $0.092 support to print a low near $0.0910. Memecoins carry the thinnest fundamental support and the most retail leverage, making them the first casualties when sentiment shifts.
On the other side of the ledger, BTW gained 15.4%, LIT rose 11.7%, and STABLE added 5.7% — a reminder that even in down sessions, rotation and narrative-specific flows create pockets of strength. Total crypto market capitalization fell nearly 5% on the day to approximately $2.87 trillion, while Bitcoin dominance held steady at 58.9%, confirming that altcoins bled disproportionately relative to BTC.
Positioning and the Liquidation Map
With Bitcoin sitting near $84,333 as of the latest data snapshot, the liquidation map frames the near-term risk clearly. To the upside, a cluster of short liquidations sits at $86,858 — roughly 3% above current price. A sustained push through that level would force short sellers to cover, adding fuel to any relief rally and potentially retracing a significant portion of today’s losses.
To the downside, the more consequential level is $76,313, sitting approximately 9.5% below current price. That zone holds an estimated $8.9 million in long liquidation exposure — substantially larger than the short-side cluster. A break there would be a serious structural event, triggering another forced-sell cascade that could extend losses quickly. The asymmetric size of the long liquidation pool below versus the short pool above suggests the market remains net long and vulnerable if macro conditions deteriorate further.
Funding rates on both BTC (0.0075%) and ETH (0.0074%) remain positive but modest, indicating that perpetual futures traders are still net long without the extreme crowding that typically precedes a violent squeeze. That is a small comfort — positioning is not yet at the danger zone, but it is not washed out either.
The Macro Picture
Traditional macro provided limited direction Wednesday. The DXY held flat at 101.11, the S&P 500 closed unchanged at 7,706, and the 10-year Treasury yield sat at 5.11% with no move on the day. Gold was the notable exception, falling 1.29% to $4,319 — a sign that some risk-off pressure was present across assets, not just crypto.
The flat dollar and steady equities mean Bitcoin’s decline was largely internally driven by the liquidation event rather than a broad macro deterioration. That framing is modestly constructive: when crypto sells off in isolation rather than alongside equities, the recovery window tends to be shorter, assuming no new macro shocks arrive.
Levels to Watch
For the Asia and London sessions ahead, the immediate area to defend is the $83,469 session low. A hold above that level keeps the liquidation flush contained as a single-session event. Failure opens a path toward the $80,000 psychological round number and eventually the $76,313 long liquidation cluster.
On recovery, bulls need to recapture $86,000 cleanly before making any case for a retest of the $87,241 session high. The $86,858 short liquidation level just above that makes a push through resistance self-reinforcing if momentum builds — but that requires demand to show up in size during what is likely to be thinner overnight trading.
Upcoming Catalysts
The dominant near-term catalyst is the $15.6 billion in Bitcoin options expiring Friday. Max pain and pin risk around that expiry are likely to create choppy, volatile price action through the London open and into Friday’s session — traders should expect the market to gravitate toward levels that maximize options seller profitability as expiry approaches.
Sentiment Check
Despite today’s 2.36% decline and the broader altcoin bloodbath, the Fear & Greed Index closed Wednesday at 71 — firmly in Greed territory. That disconnect between price action and sentiment is worth watching: a market that sells off hard while sentiment remains elevated has not fully reset the complacency that allowed leverage to build in the first place. For context on longer-term trend structure, the 28-for-28 monthly candle analysis remains a useful reference for where Bitcoin sits in its broader macro cycle.
Bottom Line
Wednesday was a forced-seller’s session. The $280M long liquidation cascade from the $87K rejection was a clean technical flush — painful for bulls caught with leverage, but not necessarily the beginning of a sustained trend reversal. BTC dominance holding at 58.9% while alts bled harder, combined with flat macro inputs and still-positive funding, suggests the structure has not broken down catastrophically.
The $76,313 long liquidation level below and Friday’s $15.6 billion options expiry are the two variables that define the next 48 hours. Navigating them requires patience, defined risk, and respect for what the liquidation map is telling you about where the real danger zones sit.
Disclaimer: This recap is for educational and informational purposes only and does not constitute financial advice. Cryptocurrency trading involves substantial risk of loss. Always do your own research. American Crypto Traders and its contributors may hold positions in the assets discussed.
Originally published on American Crypto Traders
This article was syndicated from the American Crypto Traders daily brief. For original analysis and trading signals, visit americancryptotraders.com