

Riot’s Analysis Reveals US Bitcoin Miners Struggle with Expenses Even After Covering Power Costs
The expenses associated with Bitcoin mining are frequently boiled down to a single number: the “cost to mine one BTC.” However, this metric can vary greatly depending on which segment of the operation is under consideration.
Electricity costs dictate operational viability, while operational expenses impact the support of the larger company, and accounting factors ultimately determine if profits are realized.
To analyze these various layers in depth, CryptoSlate developed a specialized Bitcoin Mining Cost Model. This model calculates the economics of mining based on essential elements such as network difficulty, block rewards, transaction fees, ASIC efficiency, and electricity prices.
The model utilizes specific cost inputs from Riot Platforms’ public disclosures to demonstrate real-world economic scenarios.
According to the model, at present network conditions, miners can pay for their electricity costs but fall short when it comes to overall operational and accounting expenses.
Riot’s operations in Texas highlight the gap between electricity break-even points, operating break-even thresholds, and overall accounting profitability, reflecting wider challenges even after Bitcoin’s price recovery.
Break-even Analysis Highlights Three Levels in Mining Costs
At today’s Bitcoin price of $67,200, Riot successfully navigates one break-even level but misses out on the subsequent two.
Data modeling was based on current network dynamics, encompassing a BTC difficulty of 145,042,165,424,850, a 3.125 BTC block reward, typical BTC per block, and modern ASIC efficiency around 17–19 J/TH, alongside Texas’ industrial electricity rate of around $0.0667 per kWh. We opted not to consider block fees since current averages hover around 0.02 BTC per block.
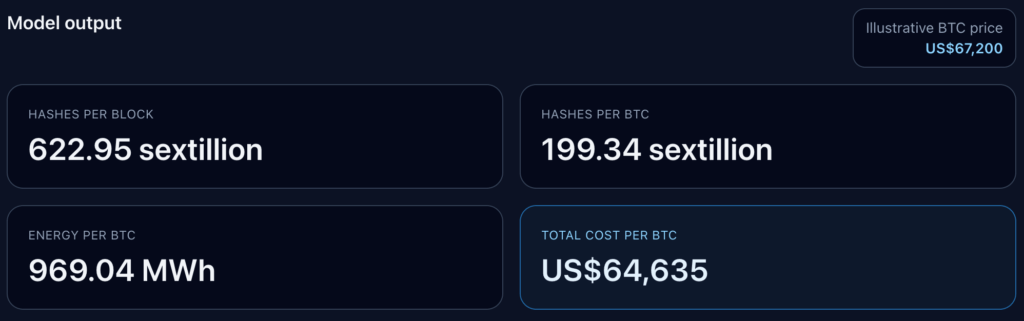
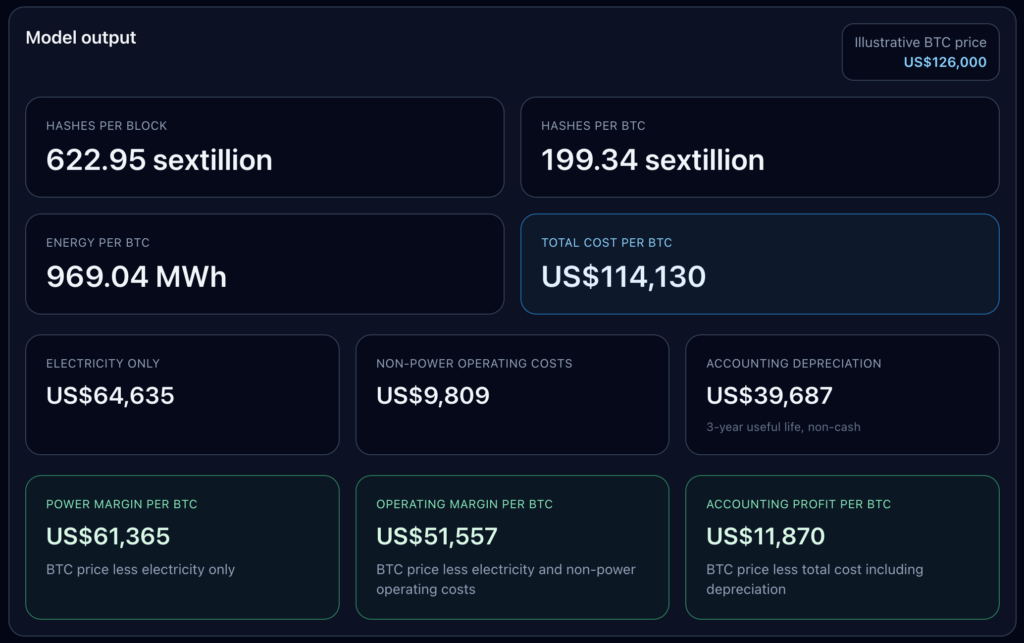
This configuration yields a total network output of 622.95 sextillion hashes per block (the computed effort required to mine one block), 199.34 sextillion hashes per BTC (reflecting the speed with which a single miner or the entire network executes this task), and a consumption of 969.04 megawatt-hours of energy for each BTC mined.
With these assumptions, the cost to mine one BTC at the current price stands at approximately $64,635, allowing for a power margin of $2,565 per BTC.
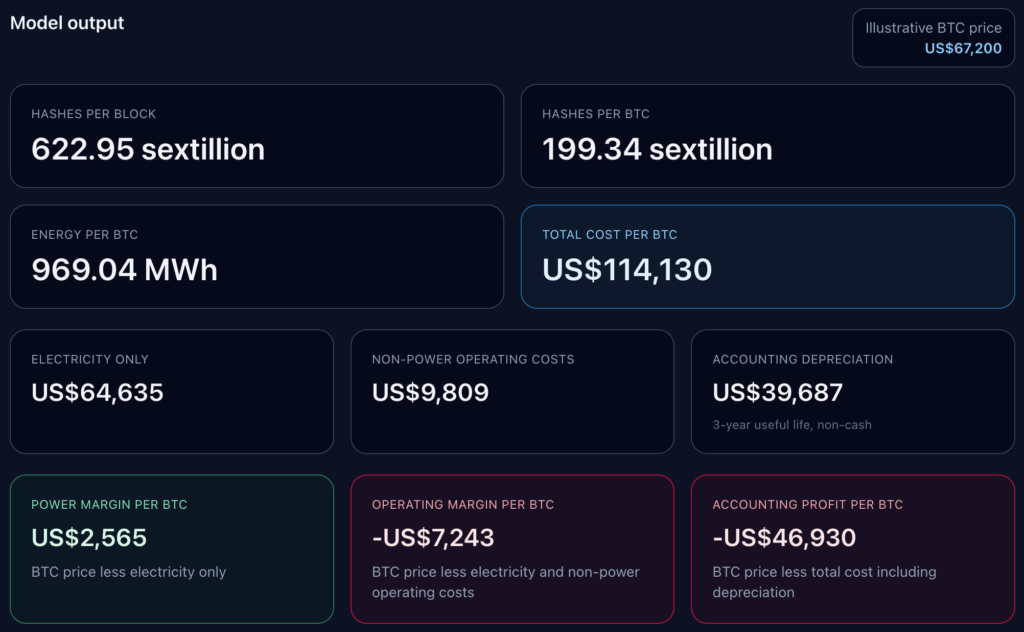
Including Riot’s operational costs not related to power, pegged at approximately $9,809 per BTC, pushes the operating margin to a negative $7,243, and total BTC costs increase accordingly. Introducing the non-cash depreciation layer, estimated at around $39,687 per BTC, drives accounting profit to a negative $46,930.
This reinforces the notion that for significant US miners, “cost to mine one Bitcoin” is not singular.
- The first layer accounts for immediate electricity expenses, influencing whether mining operations are worthwhile.
- The second layer incorporates extensive operational costs, determining if self-mining sustains the broader enterprise.
- The third layer considers depreciation, assessing whether reported profits align with cash margins.
The model juxtaposes these layers, highlighting the disparities even after market recovery efforts.
Understanding the Break-even Structure in Mining Operations
The break-even analysis offers a deeper understanding than any all-in mining-cost figure. The electricity-only break-even point sits at $64,635 per BTC.
Incorporating Riot’s operational costs not related to power raises the break-even to approximately $74,444.
Furthermore, including the depreciation layer elevates the full accounting break-even to $114,130.
This demonstrates that even while miners may report advantageous power economics, their operating and accounting outcomes can still be quite weak.
| Cost Layer | Modeled Amount per BTC | Break-even BTC Price |
|---|---|---|
| Electricity Only | $64,635 | $64,635 |
| Non-Power Operational Costs | $9,809 | $74,444 |
| Accounting Depreciation | $39,687 | $114,130 |
Four price scenarios were modeled to illustrate how this break-even structure operates in reality.
In the $67,200 current price case, Riot surpasses just above the electricity break-even point, yet only minimally. The power margin goes positive, but both operating and accounting perspectives remain negative.
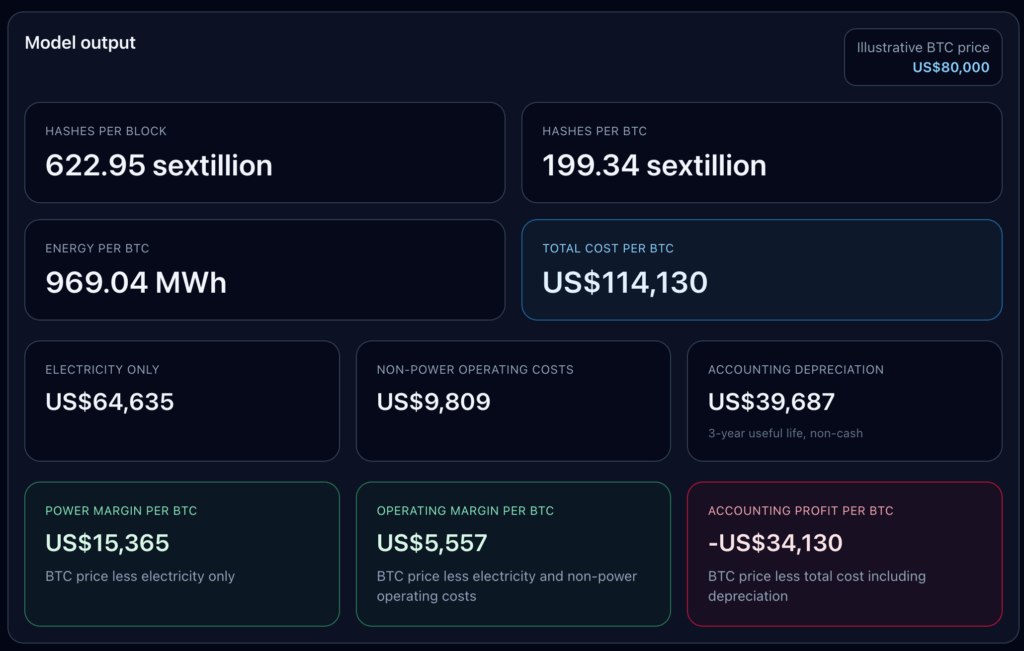
In the $80,000 recovery scenario, Riot achieves a break-even point operationally, yielding an operating margin of $5,557 per BTC. However, the accounting perspective still reflects a loss of $34,130.
For profitability across the board, including accounting margin of $11,870, Bitcoin would need to return to its all-time high of $126,000.
| BTC Price Scenario | Power Margin per BTC | Operating Margin per BTC | Accounting Profit per BTC |
|---|---|---|---|
| $49,000 | -$15,635 | -$25,443 | -$65,130 |
| $67,200 | $2,565 | -$7,243 | -$46,930 |
| $80,000 | $15,365 | $5,557 | -$34,130 |
| $126,000 | $61,365 | $51,557 | $11,870 |
This distinction is crucial. Riot’s depreciation layer is characterized as non-cash and is allocated based on a three-year lifespan. It represents an accounting measure instead of a temporary cash outlay.
Despite this, it is relevant because public mining companies do not operate solely on power margins. They must also present financial statements, upgrade equipment, and manage corporate costs.
Thus, the pertinent inquiry becomes which profitability metrics investors, analysts, and management teams prioritize, and at what moments they deem a miner profitable.
Future Halving Projections for Riot Extend Testing on Prices
Next, we conducted a projected cost analysis leading up to the next halving in 2028.
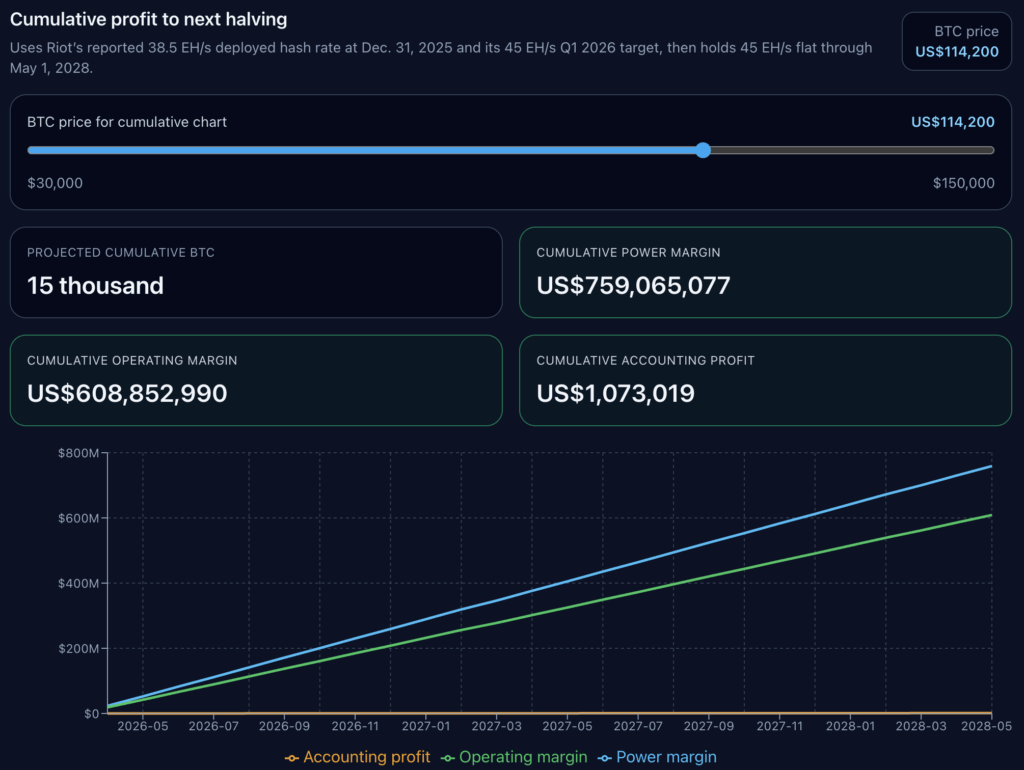
Using Riot’s latest publicly released data, we assume a hash rate of 38.5 exahash per second, increasing to 45 EH/s by March 31, 2026, remaining consistent until the subsequent halving period.
This analysis is focused on operational leverage and the heightened sensitivity to price mechanics.
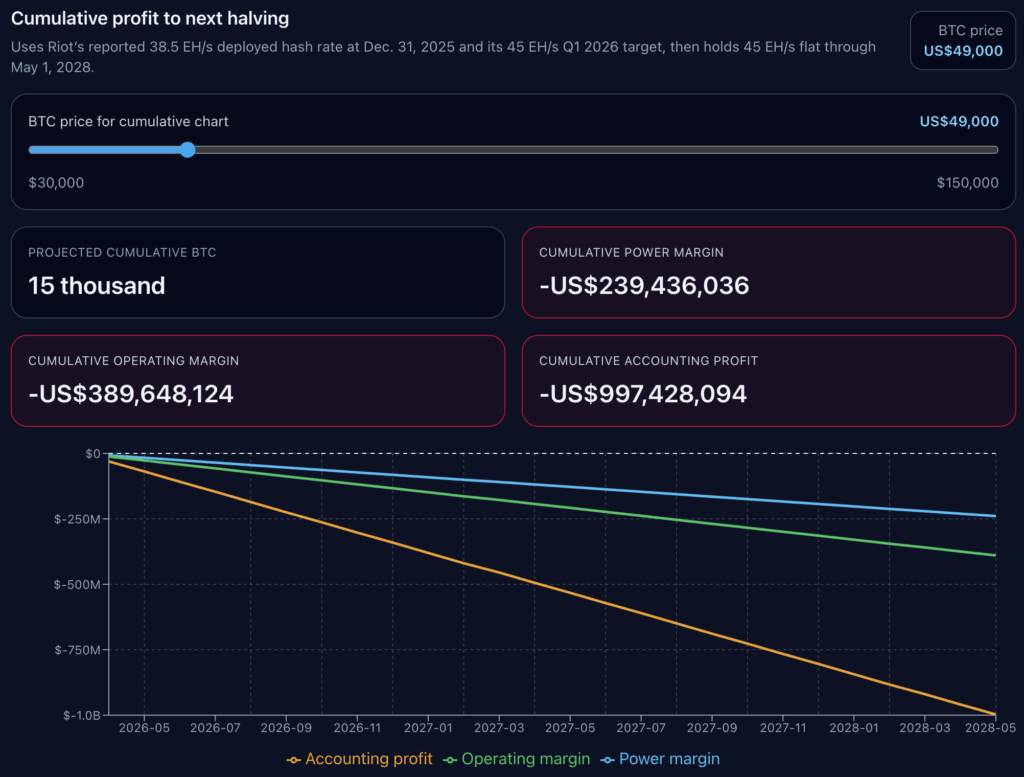
Across all four scenarios, we anticipate a total of 15 thousand BTC mined. The only variable that changes is the profitability stack.
At a Bitcoin price of $49,000, Riot’s cumulative power margin is negative $239,436,036, cumulative operating margin is negative $389,648,124, and cumulative accounting profit reflects a negative $997,428,094.
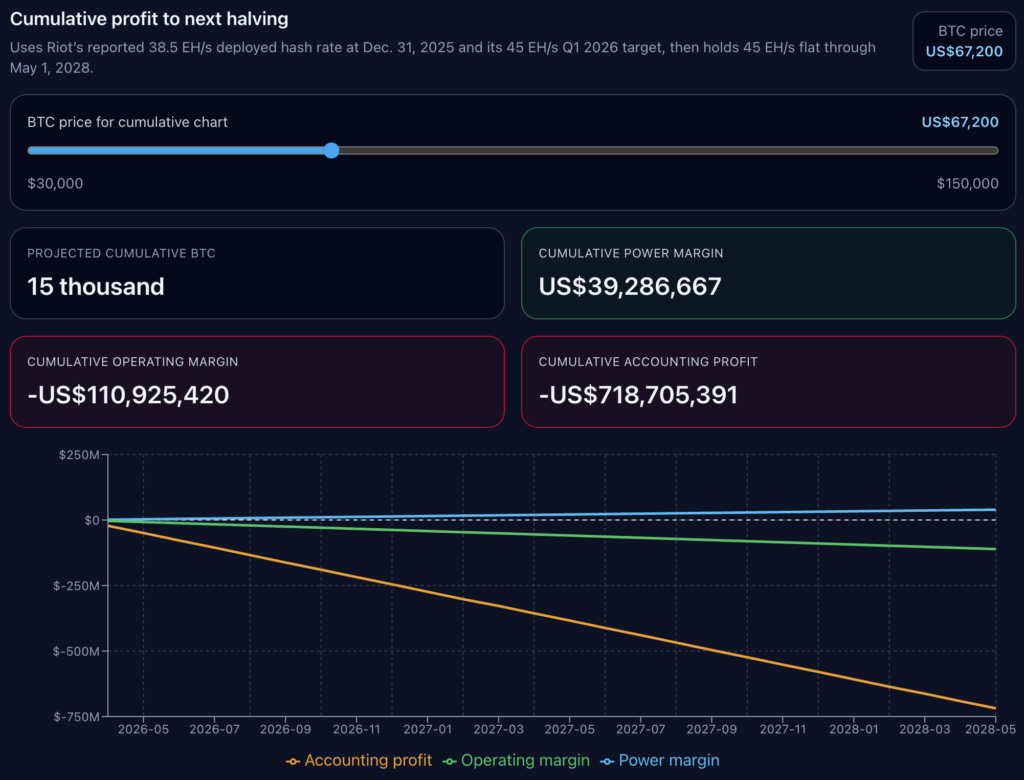
At a price of $67,200, the cumulative power margin becomes positive at $39,286,667, while the cumulative operating margin remains negative at $110,925,420 and accounting profit stays at negative $718,705,391.
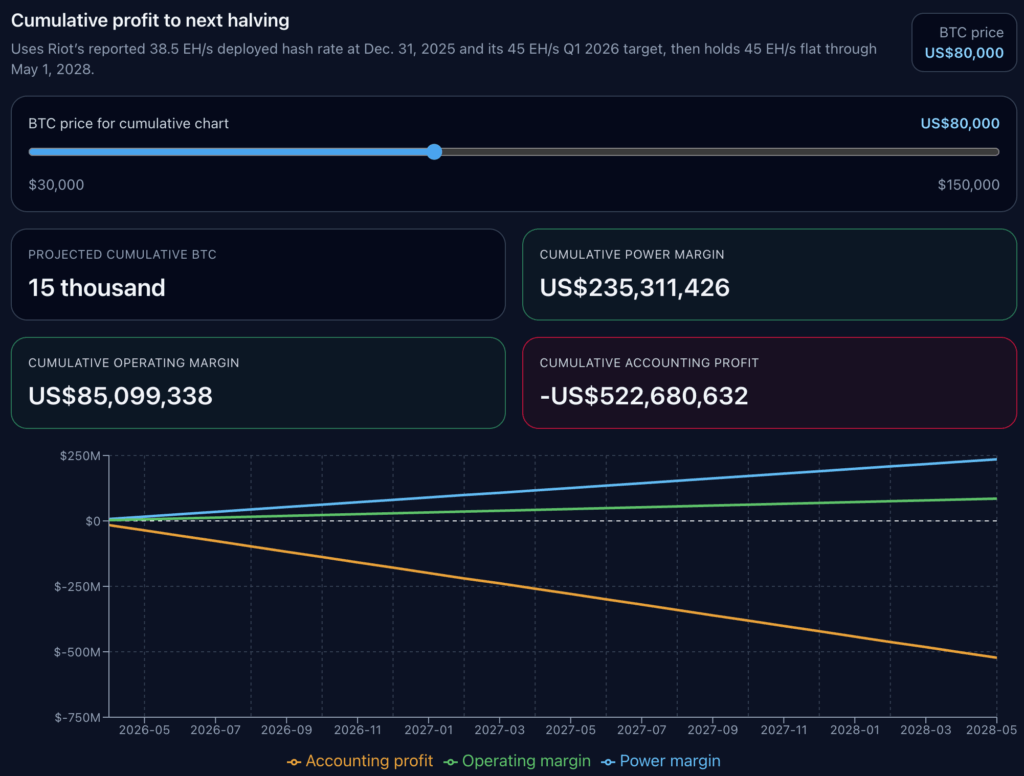
At an $80,000 price point, Riot’s operational margin positively adjusts to $85,099,338, yet cumulative accounting profit still reflects a loss of $522,680,632.
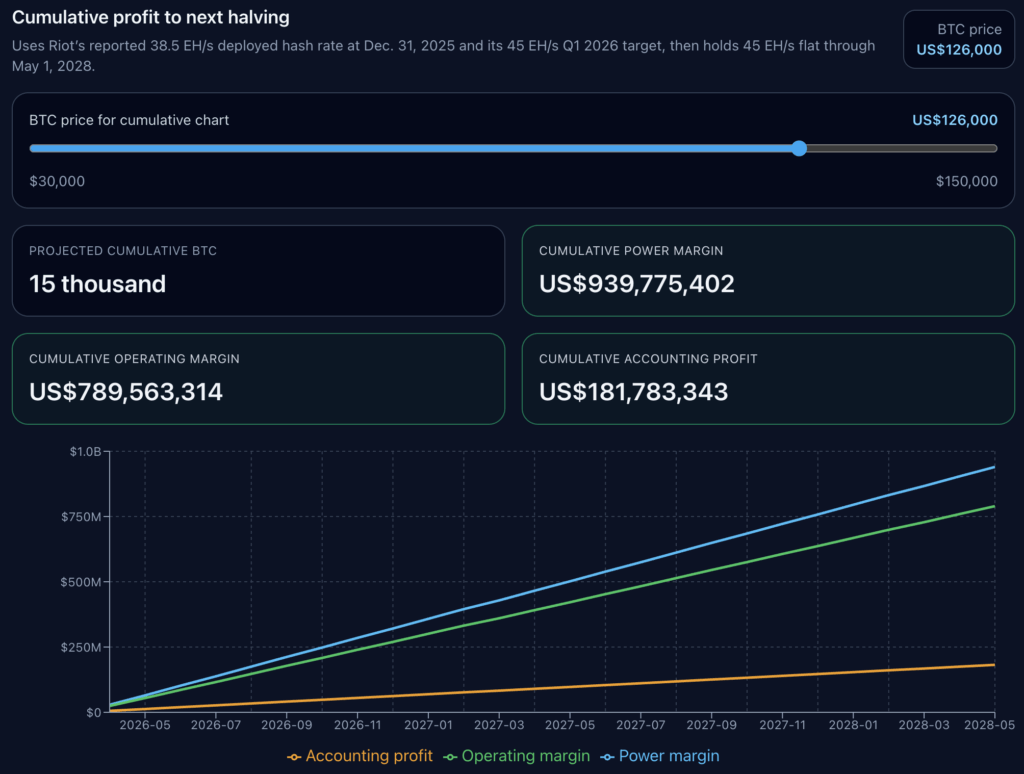
Only when Bitcoin reaches $126,000 do all profitability indicators exceed zero, with a cumulative accounting profit of $181,783,343.
| BTC Price Scenario | Projected Total BTC | Cumulative Power Margin | Cumulative Operating Margin | Cumulative Accounting Profit |
|---|---|---|---|---|
| $49,000 | 15,000 | -$239,436,036 | -$389,648,124 | -$997,428,094 |
| $67,200 | 15,000 | $39,286,667 | -$110,925,420 | -$718,705,391 |
| $80,000 | 15,000 | $235,311,426 | $85,099,338 | -$522,680,632 |
| $126,000 | 15,000 | $939,775,402 | $789,563,314 | $181,783,343 |
A miner can maintain a positive power margin for extended periods but might still fall short in meeting broader operational costs. They may even achieve a positive operating margin while remaining far from accounting profitability. The case of Riot effectively illustrates the considerable discrepancy between these scenarios.
In this model, the gap between the electricity cost break-even and the complete accounting break-even is approximately $49,495 per BTC. This difference offers insight into why miners can exhibit positive operational metrics while reporting weak earnings at the same time.
The cumulative data does not factor in future network difficulties, fees, outages, curtailment revenue, financing, or new capital expenditures. It simply assumes that current BTC economics continue and scales according to Riot’s anticipated hash rate trajectory.
Despite these constraints, the analysis yields a compelling insight. Projecting current economic factors indicates that the discussion around the next halving is heavily dependent on Bitcoin’s pricing dynamics.
In the specific case of Riot, cumulative accounting profitability is not realized until the BTC value reaches $126,000. However, in absolute terms, the profitability threshold stands at approximately $114,200.
Insights from Riot’s Case Study for the Broader US Mining Landscape
The overarching takeaway for US miners is clear: price alone does not dictate operational success. Efficiency across fleets and energy prices ultimately dictate initial choices.
To gauge cost sensitivity, we evaluated three ASIC configurations: the Bitmain S21 at 17.5 J/TH, the WhatsMiner M60S at 18.5 J/TH, and the Antminer S19 Pro at 29.5 J/TH, based on Texas industrial rates for electricity.
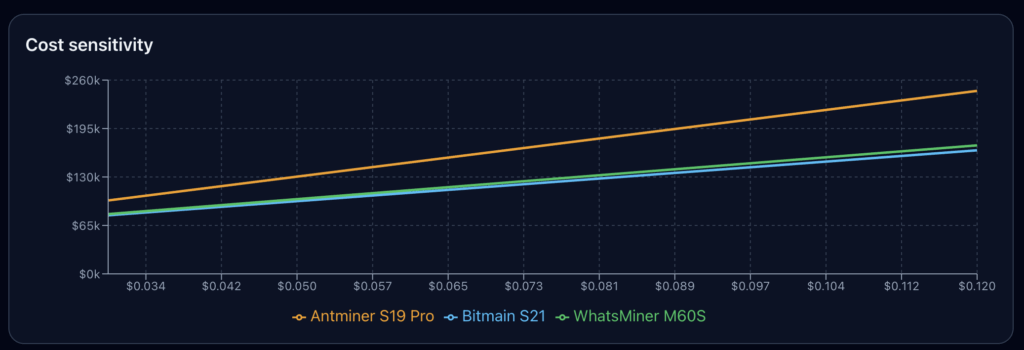
Throughout the evaluated range, the S19 Pro maintains a higher cost per BTC than the newer models. The two recent models remain closely matched in their costs, while the older mining fleet incurs noticeably higher costs overall.
This observation extends beyond Riot. Although the non-power operational costs and depreciation assumptions derived from Riot’s disclosures are specific to the company, other miners may have varied overheads, expectations for equipment life, curtailment patterns, and electricity mix. Nonetheless, the three-tiered analytical framework applies broadly.
First, there’s the cost of power, followed by the operational cost, and lastly, the accounting cost.
Survival during downturns in pricing typically requires miners to comfortably exceed the first cost layer. Those enhancing their value throughout the cycle will need to navigate and dominate all three layers over time.
At approximately $67,000 today, our model indicates no substantial distress at the machine operation level. The power margin remains positive, confirming machines continue to earn more than their electricity expenses.
On the flip side, it indicates that a miner has not fully resolved the entire income statement yet. The operational margin remains in the red, with the accounting margin significantly deeper in the negative. This split affects decisions regarding treasury management, fleet upgrades, and market expectations regarding earnings among public miners.
Consequently, we can conclude that Bitcoin miners can achieve a positive power margin substantially below six figures, cross the operational margin threshold during recovery phases, and still miss cumulative accounting profitability until we retest all-time highs exceeding $114,000.