

On Wednesday, Bitcoin (BTC), Ethereum (ETH), and Ripple (XRP) are showing a generally positive trend, even as BTC experiences a minor decline over the last couple of days. The leading cryptocurrency remains above the $78,000 mark, while both ETH and XRP demonstrate strength above critical Exponential Moving Averages (EMAs), maintaining their bullish potential.
Bitcoin Holding Steady Above Key EMAs
Bitcoin’s current price sits at $78,811 this Wednesday, exhibiting a favorable short-term outlook as it trades significantly above essential Exponential Moving Averages (EMAs). The 50-day, 100-day, and 200-day EMAs, which cluster between approximately $70,600 and $72,900, lie comfortably beneath its current level, suggesting that the prevailing uptrend remains intact even amidst a slight slowdown in momentum.
The Relative Strength Index (RSI) has adjusted down to around 61, indicating a moderated yet still positive momentum. At the same time, the Moving Average Convergence Divergence (MACD) remains below the signal line, implying that the recent advancement is slowing down rather than reversing the overall bullish trend.
On the downside, initial support is identified at the 200-day EMA near $72,860, followed by the 50-day EMA around $72,566, and further down at the 100-day EMA near $70,588, where buying interest might reappear if a more significant pullback occurs. Below these dynamic levels, horizontal support can be found at $66,500 and subsequently at $62,300.
On the upside, the next vital resistance level is at the horizontal barrier around $85,000. A decisive breakout above this point could pave the way for new highs, while repeated failures to surpass it might favor ongoing consolidation above the fundamental EMA support.
Ethereum’s Positive Outlook Remains Intact
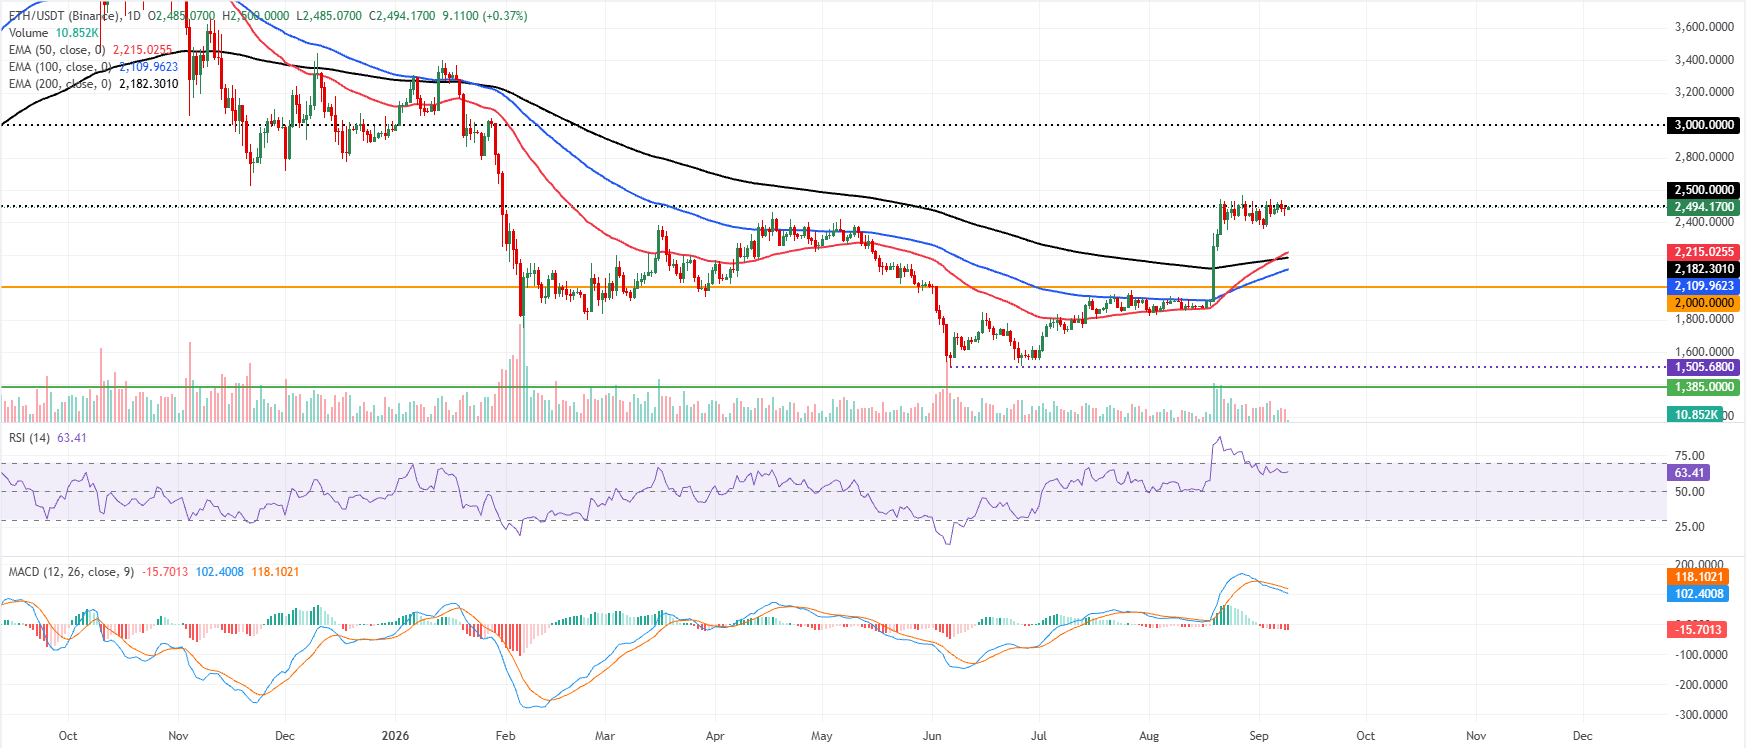
Ethereum is trading at $2,494 on Wednesday, continuing its bullish stance as it remains confidently above the 50-day, 100-day, and 200-day EMAs, which are clustered between approximately $2,110 and $2,215. This upward stack of EMAs bolsters the short-term trend, and the RSI at around 63 indicates a favorable momentum that hasn’t reached overbought territory yet, despite the MACD being in negative territory, signaling that the upside momentum is cooling after its recent vigorous advance.
On the upside, immediate resistance is marked by the nearby horizontal barrier at $2,500, protecting a more significant psychological level at $3,000.
For the downside, the first notable support area is anchored by the 50-day EMA at $2,215, followed by the 200-day EMA at $2,182 and the 100-day EMA at $2,109. A deeper retracement could expose the horizontal support at $2,000, with $1,385 acting as a key medium-term base if selling pressure were to persist.
XRP Remains Resilient Above 200-day EMA
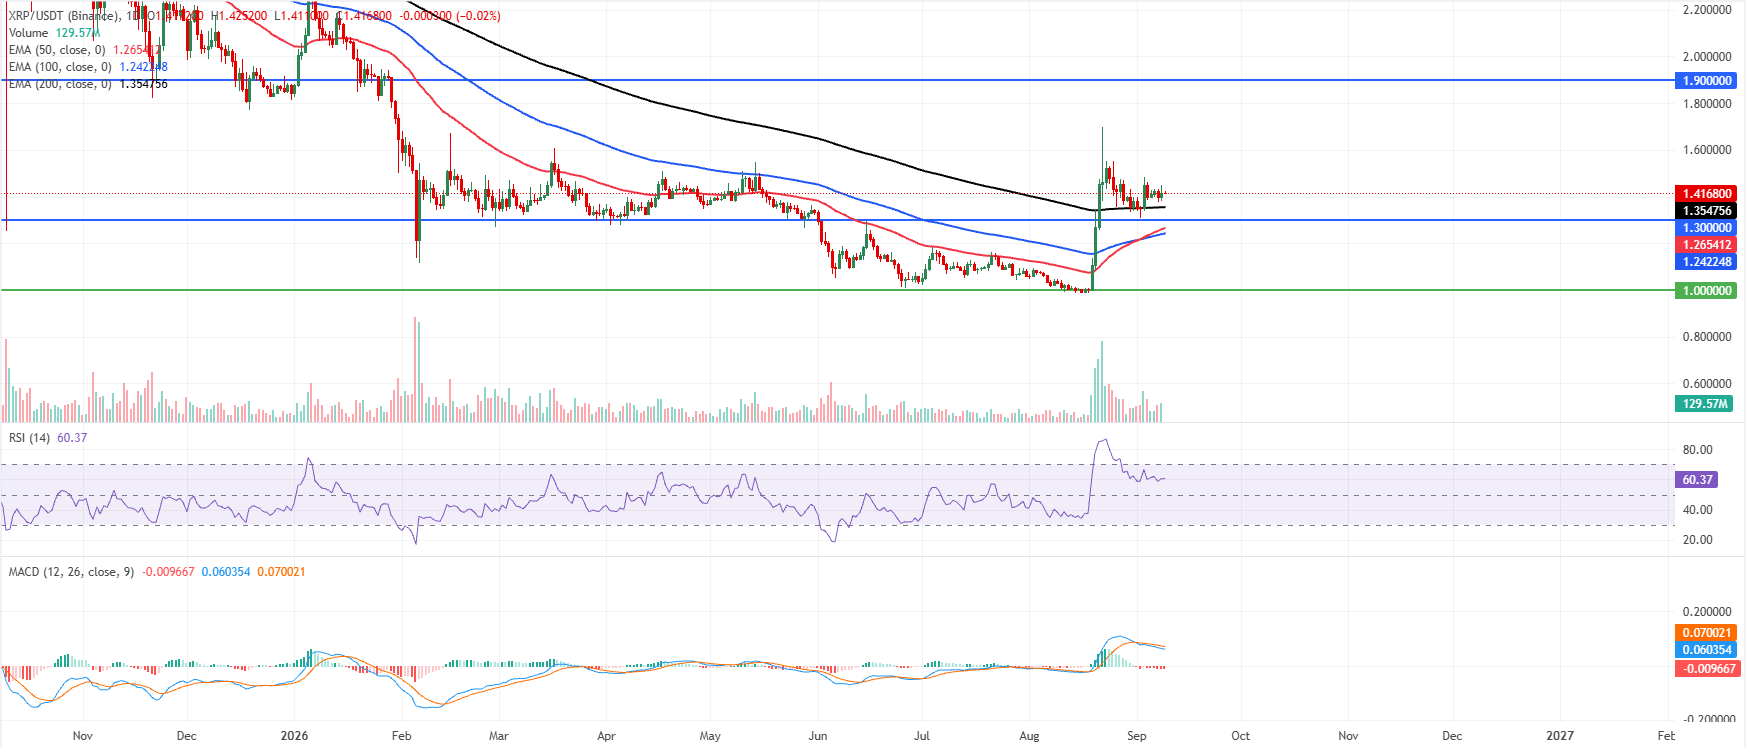
XRP is priced at $1.416 in the middle of the week, exhibiting a bullish sentiment as it remains above critical EMAs clustered between approximately $1.242 and $1.354. This arrangement of EMAs below the current price indicates underlying buying interest, although the RSI has eased to a still-positive 60, and the MACD has dipped slightly into negative territory, suggesting that upward momentum is cooling rather than declining.
On the downside, the first support is identified at a recent horizontal level around $1.300, backed by the 200-day EMA at $1.354 and the shorter-term 50-day EMA near $1.265, while the 100-day EMA at $1.242 and the prior psychological support at $1.000 would guard against a more considerable retracement.
On the upside, significant resistance is set much higher at the horizontal ceiling near $1.900, and a sustained break above this range would likely open the way for a longer bullish trajectory.
(This technical analysis was generated with the assistance of an AI tool. Learn more.)