
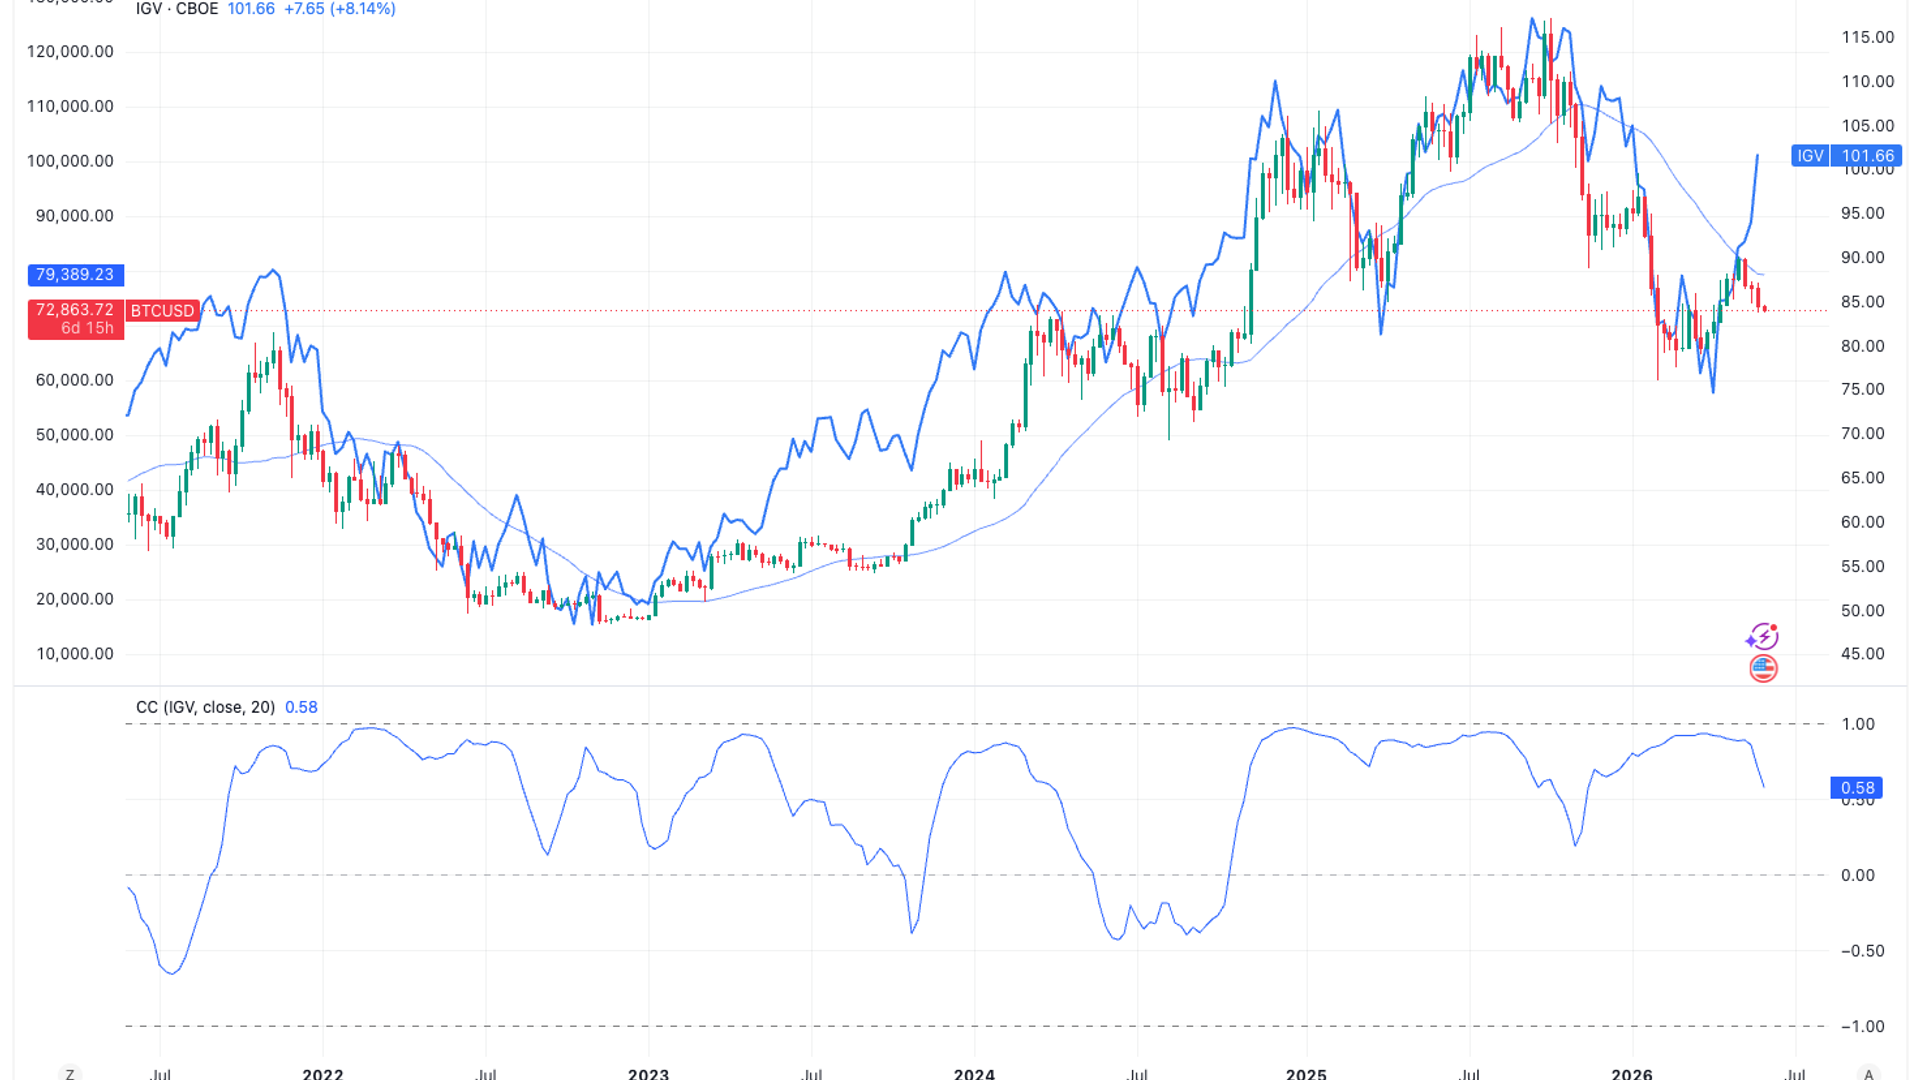
Since early April, IGV has made a remarkable comeback, increasing by 36% and restoring its position above the 200-day moving average. This key technical indicator reflects the average closing prices from the past 200 trading days and is frequently utilized to assess long-term trends. As of Friday’s close, IGV was around 98, and by pre-market trading on Monday, it had risen to approximately 104.
In contrast, Bitcoin is hovering around $73,000, which is nearly 10% below its 200-day moving average of $79,388.
The 20-day rolling correlation between Bitcoin and IGV has dipped to 0.58. Instances of such low correlations were previously noted in October 2023 when Bitcoin was priced near $25,000, subsequently soaring to $70,000 over six months, and again in the summer of 2024, just prior to Bitcoin’s surge toward $100,000 following President Trump’s election win.
Historically, these periods of diminished correlation tend to be brief. Bitcoin usually aligns with the performance of software stocks, or IGV’s resurgence could be a false signal. Currently, the latter seems less probable, given IGV’s strong upward momentum and its return above the 200-day moving average.