

Key Takeaways:
-
Bitcoin is encountering resistance around $108,000, though a surge past this level remains a strong possibility.
-
While numerous prominent altcoins are trading within established ranges, certain ones are displaying indicators of a breakout above their immediate resistance points.
Bitcoin (BTC) is seeing selling pressure near the $108,000 mark. However, the fact that buyers have prevented dips below $105,000 is encouraging. This suggests strong hands are holding onto their positions, anticipating further upward movement.
Market observers are generally optimistic about Bitcoin’s chances of reaching new record highs shortly. BitMEX’s founder, Arthur Hayes, stated on social platform X that a de-escalation of global tensions in the Middle East, combined with forthcoming regulations for stablecoins within the U.S., could potentially propel Bitcoin to uncharted price territories.
This bullish sentiment isn’t exclusive to Bitcoin. Some analysts foresee Ether (ETH) achieving a new all-time peak during this market cycle. It’s also anticipated that other altcoins will eventually catch up. Joao Wedson, CEO of Alphractal, noted on X that while Bitcoin has outperformed altcoins over the last two months, this could present “a prime opportunity to accumulate altcoins while they are still underperforming.”
The question remains: Can Bitcoin restart its upward trend? And will altcoins follow suit? Let’s dive into the charts of the top 10 cryptocurrencies to gain some insights.
Bitcoin Price Forecast
Bitcoin’s rebound is encountering selling pressure near a descending trendline, suggesting sellers are attempting to establish a lower high.
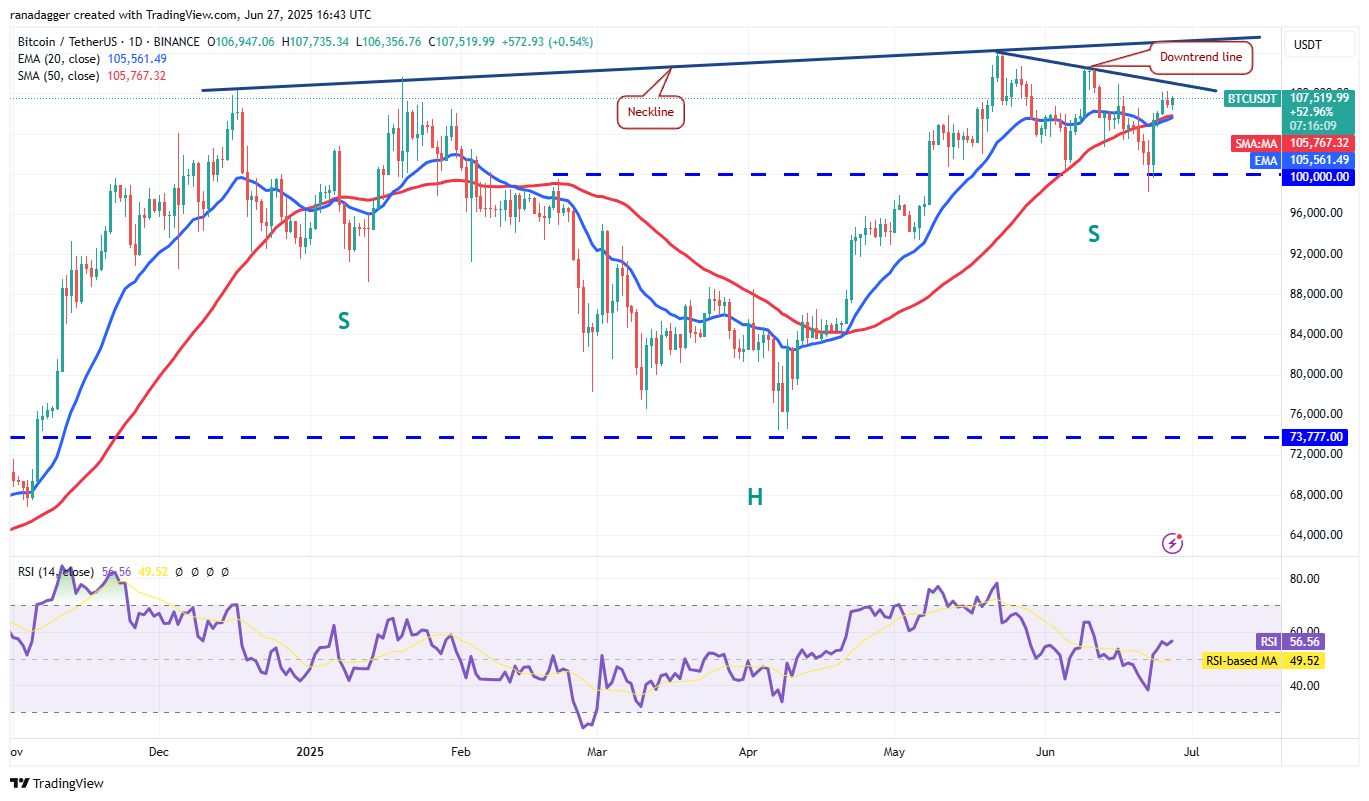
The 20-day EMA (Exponential Moving Average), currently at $105,561, is displaying a gradual upward slope, and the RSI (Relative Strength Index) is slightly above the 50 level, hinting at a slight advantage for buyers. Should buyers push the price above the aforementioned trendline, the existing descending channel pattern would become invalid. This could potentially propel Bitcoin toward the neckline of an inverse head-and-shoulders formation near $114,000. A successful breakout and close above this neckline would validate the bullish setup, targeting a price objective of $150,492.
However, sellers may have other ideas. Their aim is to push and sustain the price below the moving averages. Achieving this could see the BTC/USDT pair remaining within the descending triangle pattern for a prolonged duration.
Ether Price Forecast
Ether has been closely tracking the 20-day EMA ($2,466) since Tuesday, signaling sustained buying interest.
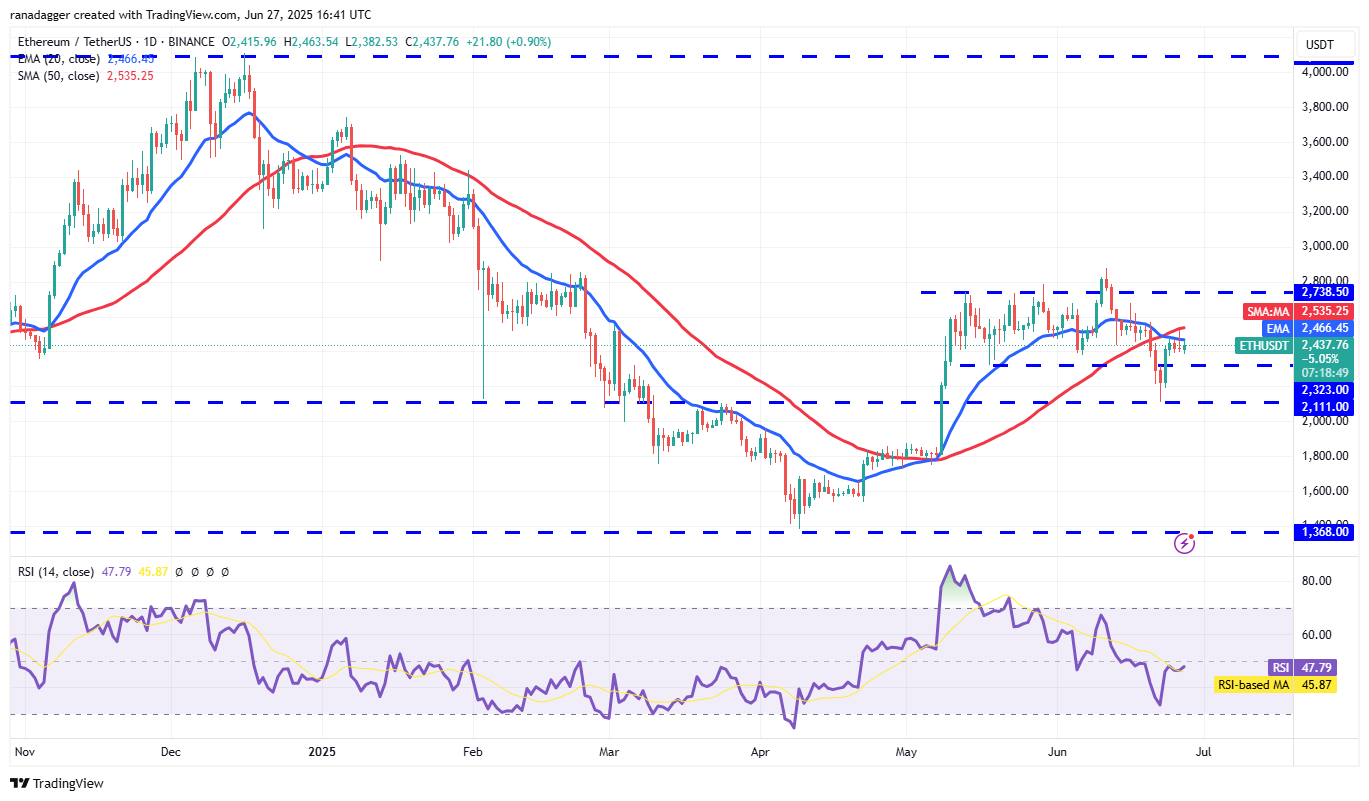
If buyers can overcome the hurdle presented by the 50-day SMA (Simple Moving Average) at $2,535, the ETH/USDT pair could rise toward the resistance zone between $2,738 and $2,879. Sellers are likely to defend this zone, but a decisive break above it could pave the way for a surge toward $3,437.
Conversely, a sharp reversal from the 50-day SMA would suggest sellers are active at higher prices. A break below $2,323 could trigger a decline toward the breakout level of $2,111.
XRP Price Forecast
Buyers have been unable to drive XRP (XRP) above the 50-day SMA ($2.26), indicating weak demand at higher levels.
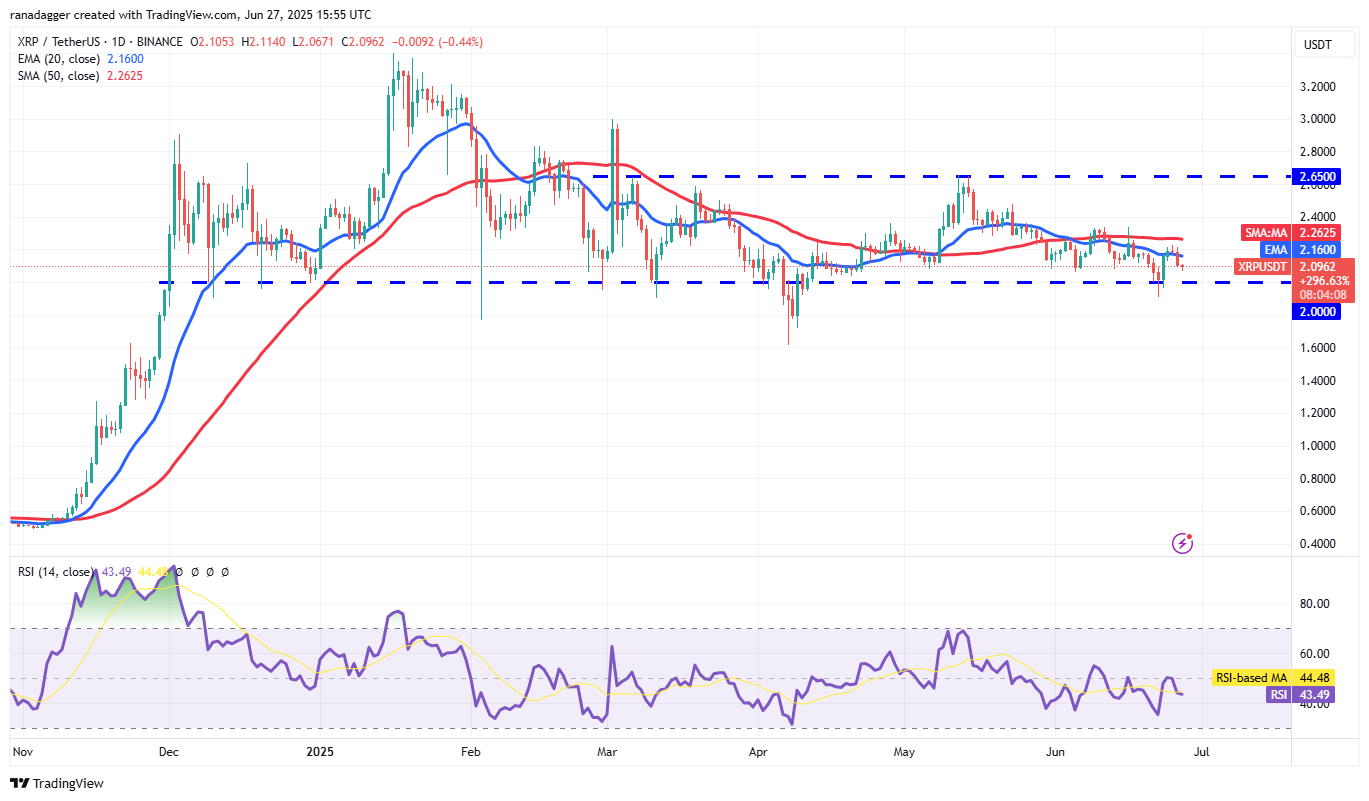
Sellers will aim to strengthen their position by pulling the price below the $2 support level. Successfully doing so could initiate a downward trajectory for the XRP/USDT pair toward the crucial $1.61 level. Buyers will likely attempt to halt the decline at $1.61, as a break below it could send the pair plummeting toward $1.28.
For the bulls, a move above the $2.34 resistance is necessary to signal a prolonged period of range-bound trading between $2 and $2.65.
BNB Price Forecast
BNB (BNB) retreated from the descending channel pattern’s resistance line on Wednesday, but the bulls have shown resilience.
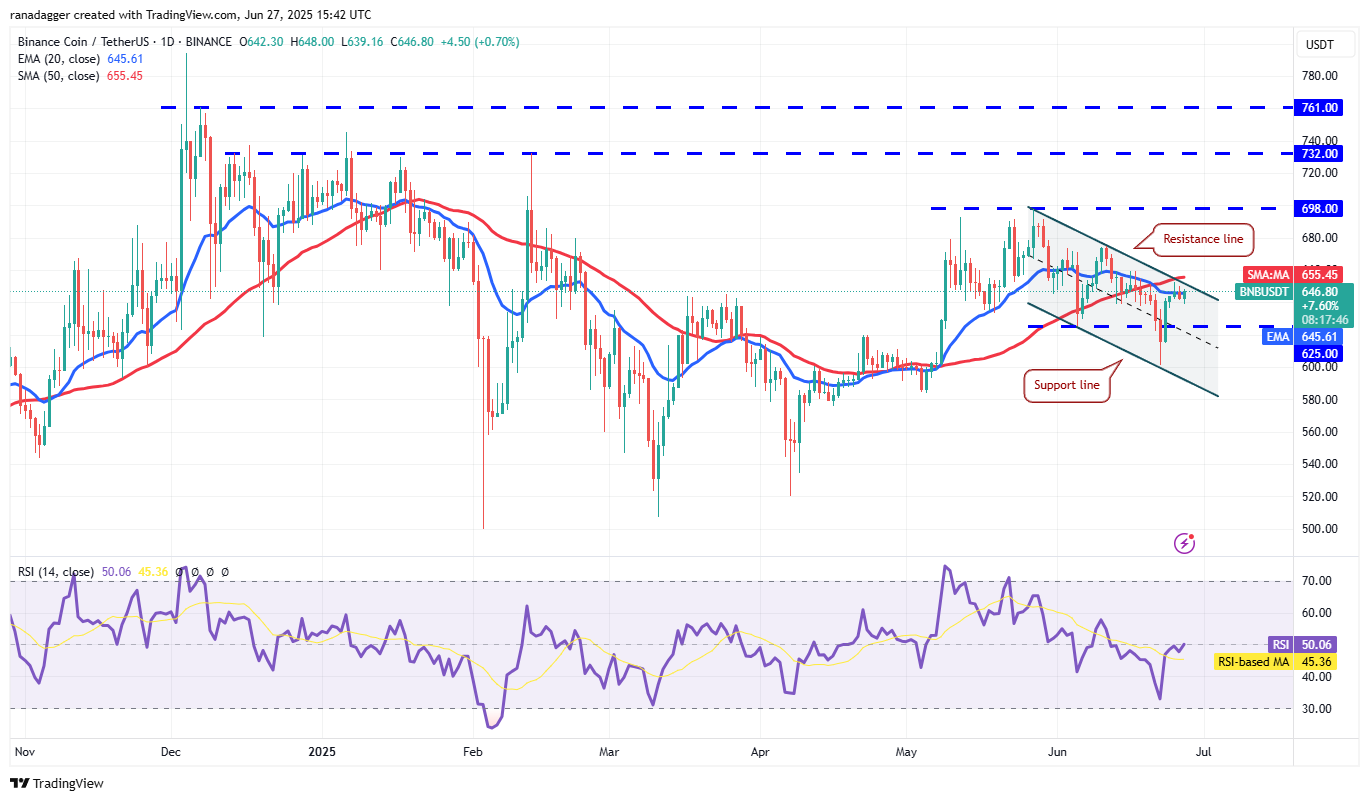
This suggests buyers are in no rush to liquidate their positions, increasing the likelihood of a break above the resistance line. If this occurs, the BNB/USDT pair could rally to $675, followed by $698.
On the downside, the critical support level to watch is $625. A break below this level would suggest an extended period within the channel. In such a scenario, the pair could decline to $615, then to the support line of the channel.
Solana Price Forecast
Solana (SOL) reversed course from the 20-day EMA ($146) on Thursday, but the bulls are currently defending the $140 level.
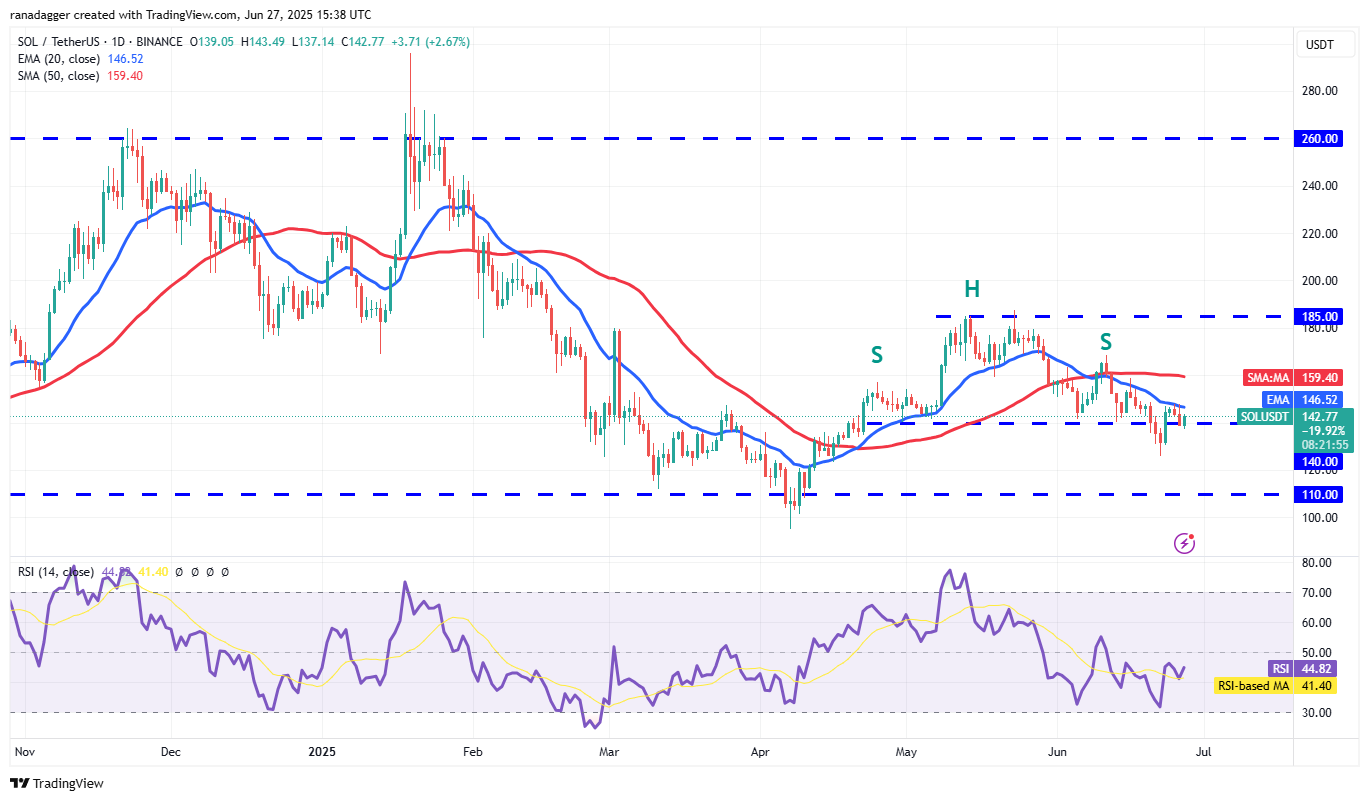
If the price rebounds from $140 and breaks above the 20-day EMA, it would suggest buyers are attempting to establish a higher low. This could open the door for a rally toward the 50-day SMA ($159), potentially bringing the $140 to $185 range back into play.
Alternatively, a decline from the 20-day EMA and subsequent drop below $140 would signal that sellers remain in control. The SOL/USDT pair could then fall to $123, followed by strong support at $110.
Dogecoin Price Forecast
Dogecoin (DOGE) is facing resistance at the 20-day EMA ($0.17), yet buyers are showing relative strength. This increases the potential for a breakthrough above the 20-day EMA.
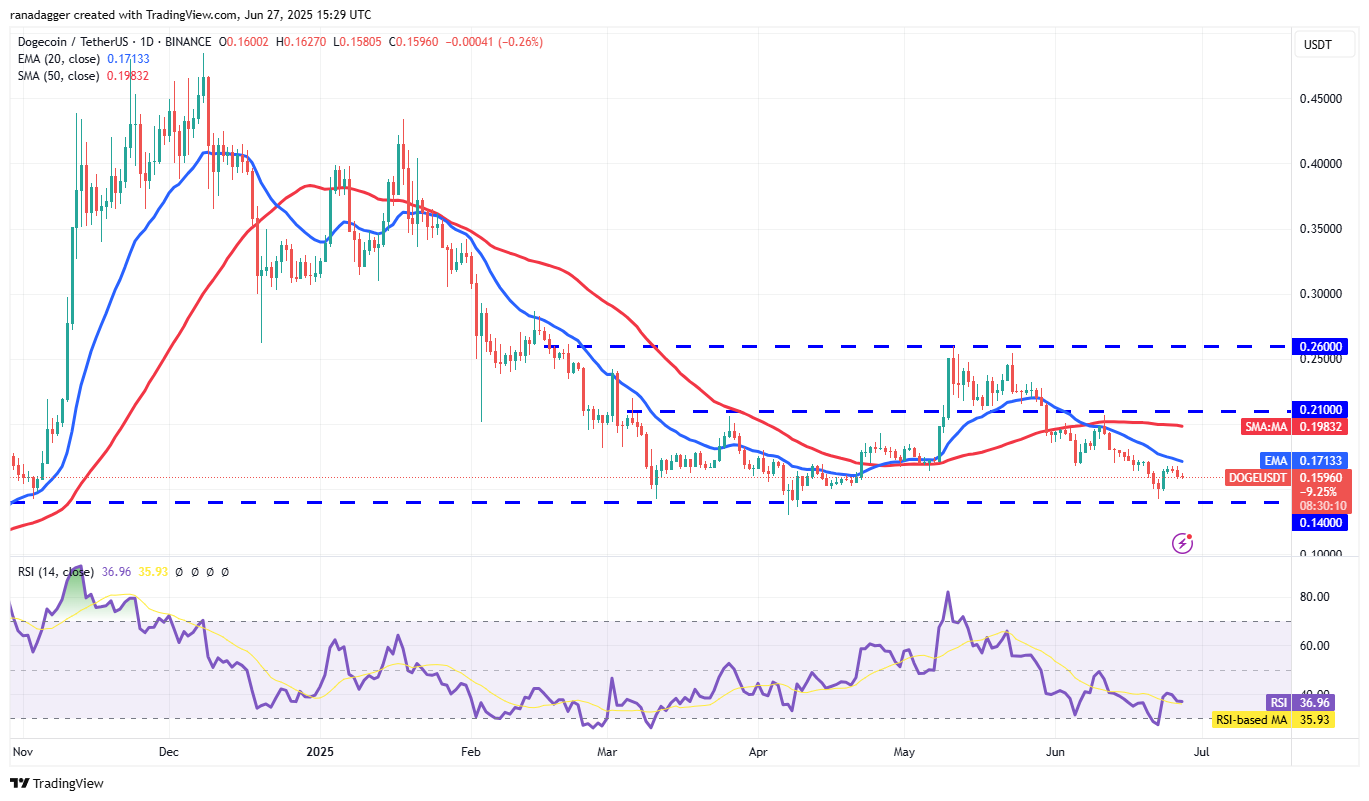
A successful breach of the 20-day EMA could propel the DOGE/USDT pair toward the 50-day SMA ($0.19). Sellers are likely to defend this level, but a sustained push by buyers could result in a surge toward $0.26.
However, should the price reverse from $0.21, it suggests the pair may remain confined to the lower half of its wide range between $0.14 and $0.26. A break below the $0.14 support could send the pair plummeting toward $0.10.
Cardano Price Forecast
Cardano (ADA) is encountering selling pressure at the 20-day EMA ($0.60), indicating continued seller dominance.
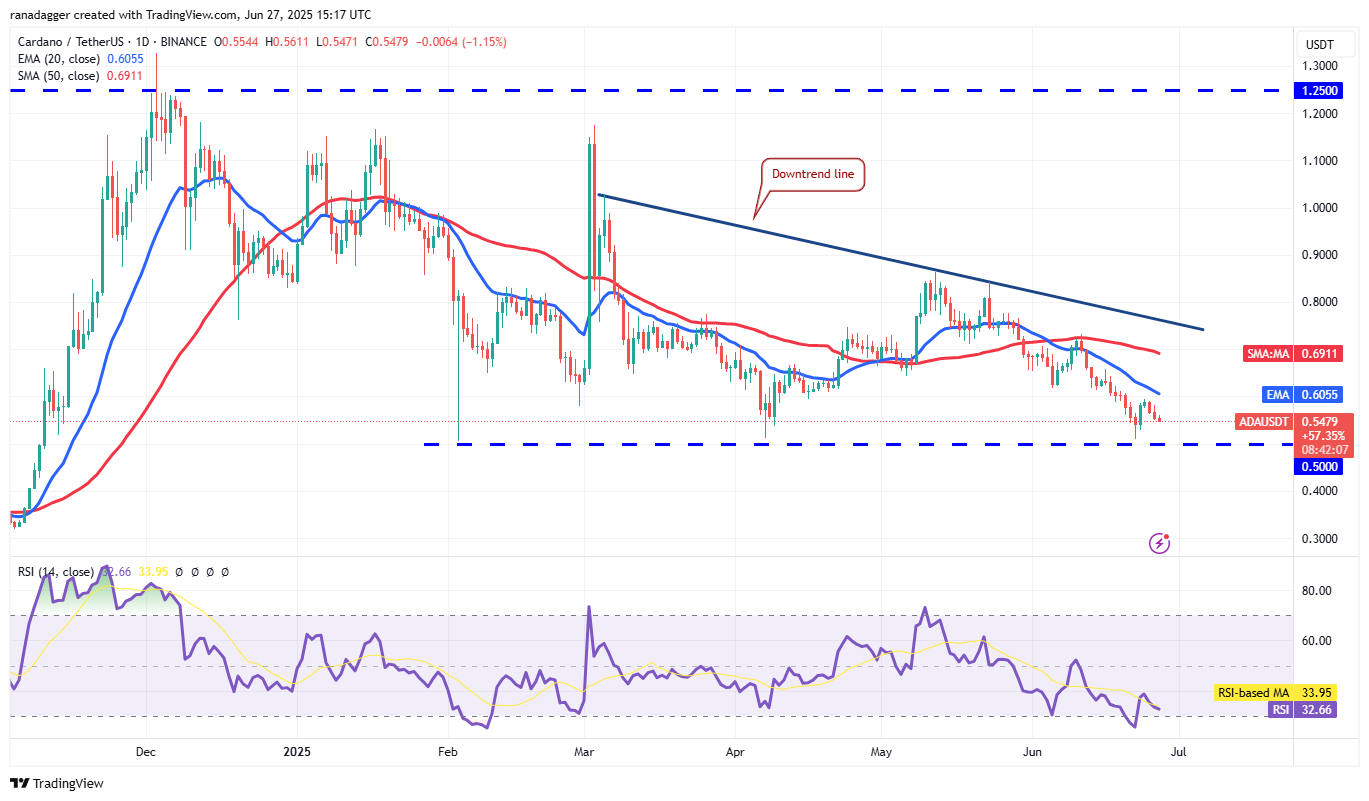
Sellers will attempt to push the price below the $0.50 support, but buyers are expected to defend this level strongly. The first sign of buyer strength would be a break and close above the 20-day EMA. This could allow the ADA/USDT pair to climb toward the 50-day SMA ($0.69) and potentially the downtrend line.
Alternatively, a close below $0.50 would confirm a bearish descending triangle pattern. This could lead to a decline toward $0.40.
Related: XRP Price Poised for Breakout After 4-Month Consolidation: Signs to Watch
Hyperliquid Price Forecast
Hyperliquid (HYPE) is currently in a tug-of-war between buyers and sellers near the 20-day EMA ($36.93).
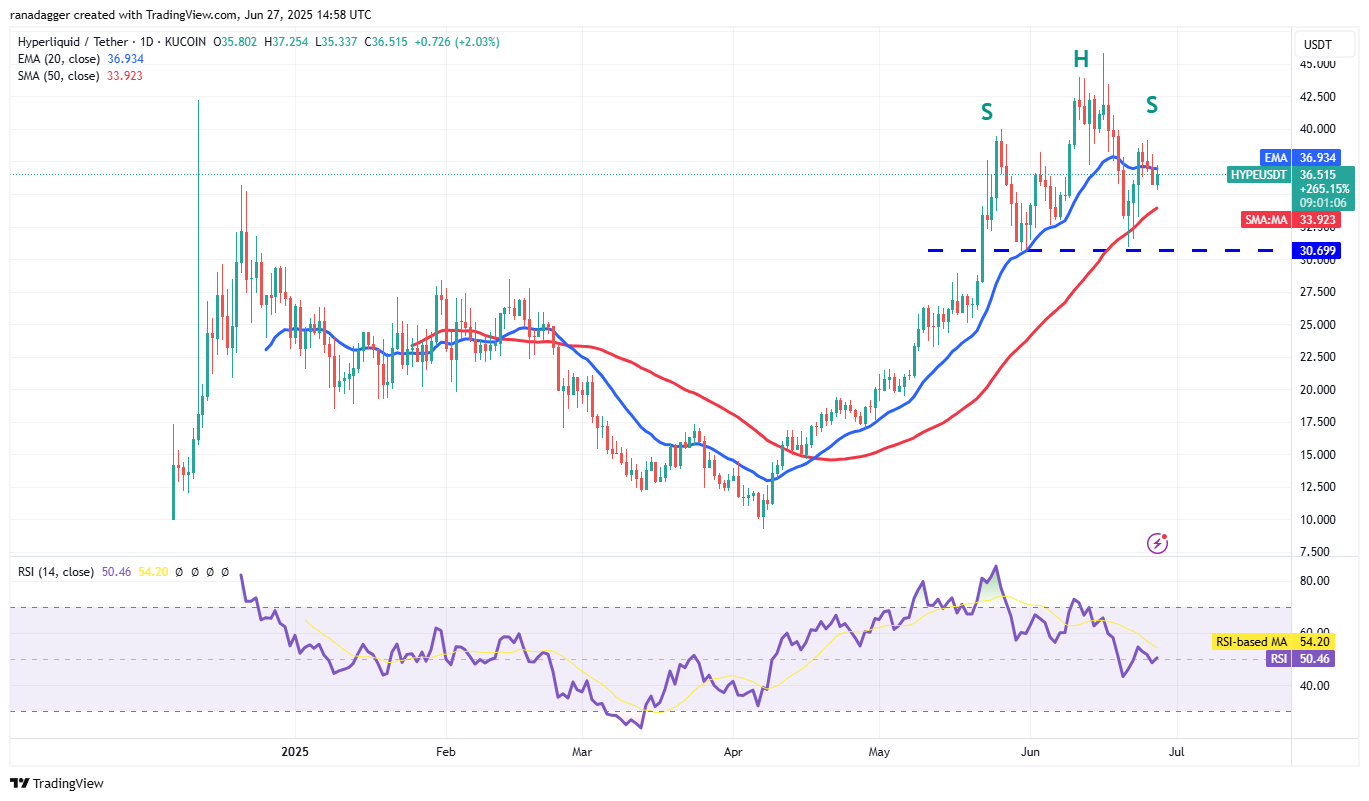
The flat 20-day EMA and an RSI near the midpoint offer no clear advantage to either side. For buyers to gain the upper hand, they must push the price above $39.12. This could then allow the HYPE/USDT pair to climb toward $45.80.
This positive outlook would be invalidated if the price reverses and breaks below the 50-day SMA ($33.92). In such a case, the pair could descend toward the $30.69 support. Buyers are expected to defend this level fiercely, as a break below it would complete a bearish head-and-shoulders pattern.
Bitcoin Cash Price Forecast
Bitcoin Cash (BCH) briefly surpassed the $500 resistance on Thursday, but the bulls were unable to maintain the higher levels.
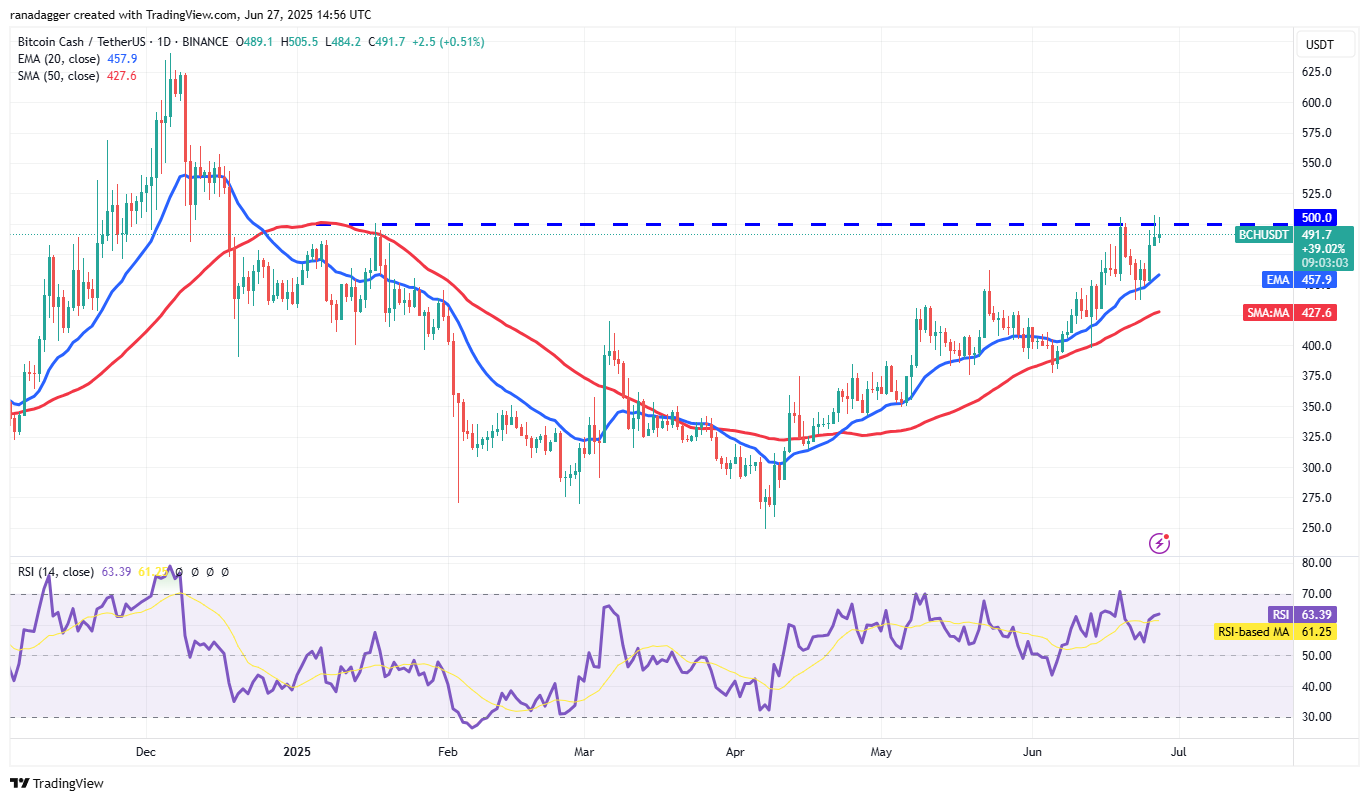
Repeated retests tend to weaken a resistance level. Buyers are once again attempting to overcome the $500 hurdle on Friday. Success in this endeavor could send the BCH/USDT pair soaring toward $550.
Conversely, a sharp reversal from $500 would indicate aggressive defense by sellers. In this scenario, the pair could pull back toward the 20-day EMA ($457), likely attracting renewed buying interest.
Chainlink Price Forecast
Chainlink (LINK) has faced resistance at the 20-day EMA ($13.24) since Tuesday, but a positive sign is the bulls’ reluctance to cede ground.
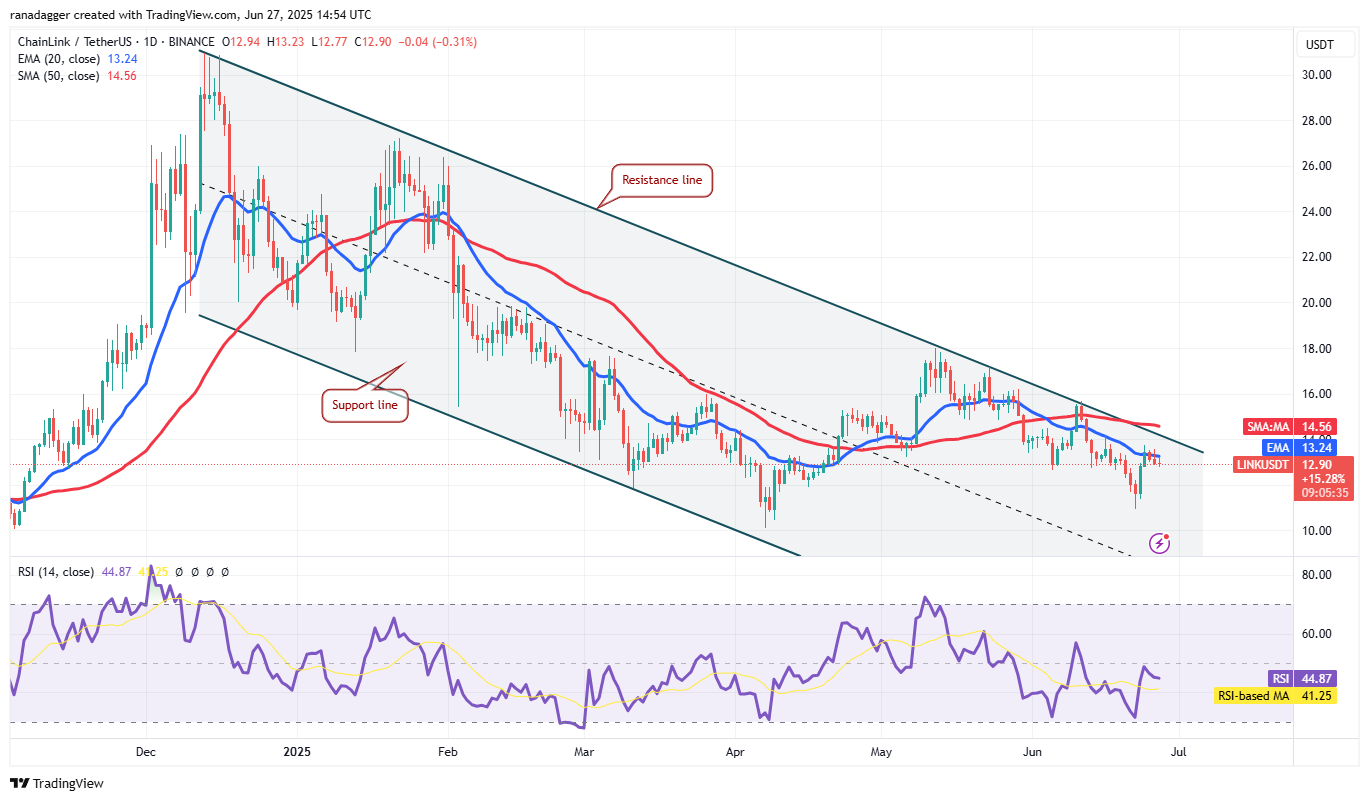
The bulls will attempt to challenge the resistance line, a critical level to watch. A rise and sustained hold above this line would signal a potential trend reversal. This could allow the LINK/USDT pair to rally toward $16, followed by $18.
On the other hand, sellers will vigorously defend the zone between the 20-day EMA and the resistance line. A sharp reversal from this zone could send the pair descending toward $10.94.
This analysis is for informational purposes only and does not constitute financial advice. Trading cryptocurrencies involves substantial risk, and readers should conduct thorough research before making any investment decisions.