

Bitcoin (BTC)
is showing strong momentum as the second quarter begins, gaining 5.53% to reach an intraday peak of $87,333 on April 2nd. This upward movement signals a potential end to a ten-week decline that began around January 20th, when it reached a high of $110,000.
Successfully breaking above this downward trendline could pave the way for Bitcoin to experience further positive price movement in the short term.
Bitcoin 1-day chart. Source: Cointelegraph/TradingView
Spot Market Activity Fuels Bitcoin’s Rise
Throughout March, traders on Binance and Coinbase spot exchanges displayed differing sentiments. Binance traders primarily sold off BTC, while Coinbase saw considerable buy orders around the $80,000 mark. This divergence likely contributed to the relatively stable, sideways price action observed throughout much of the month.
However, in early April, the combined activity of spot traders across major exchanges indicates a shift toward increased bullish sentiment.
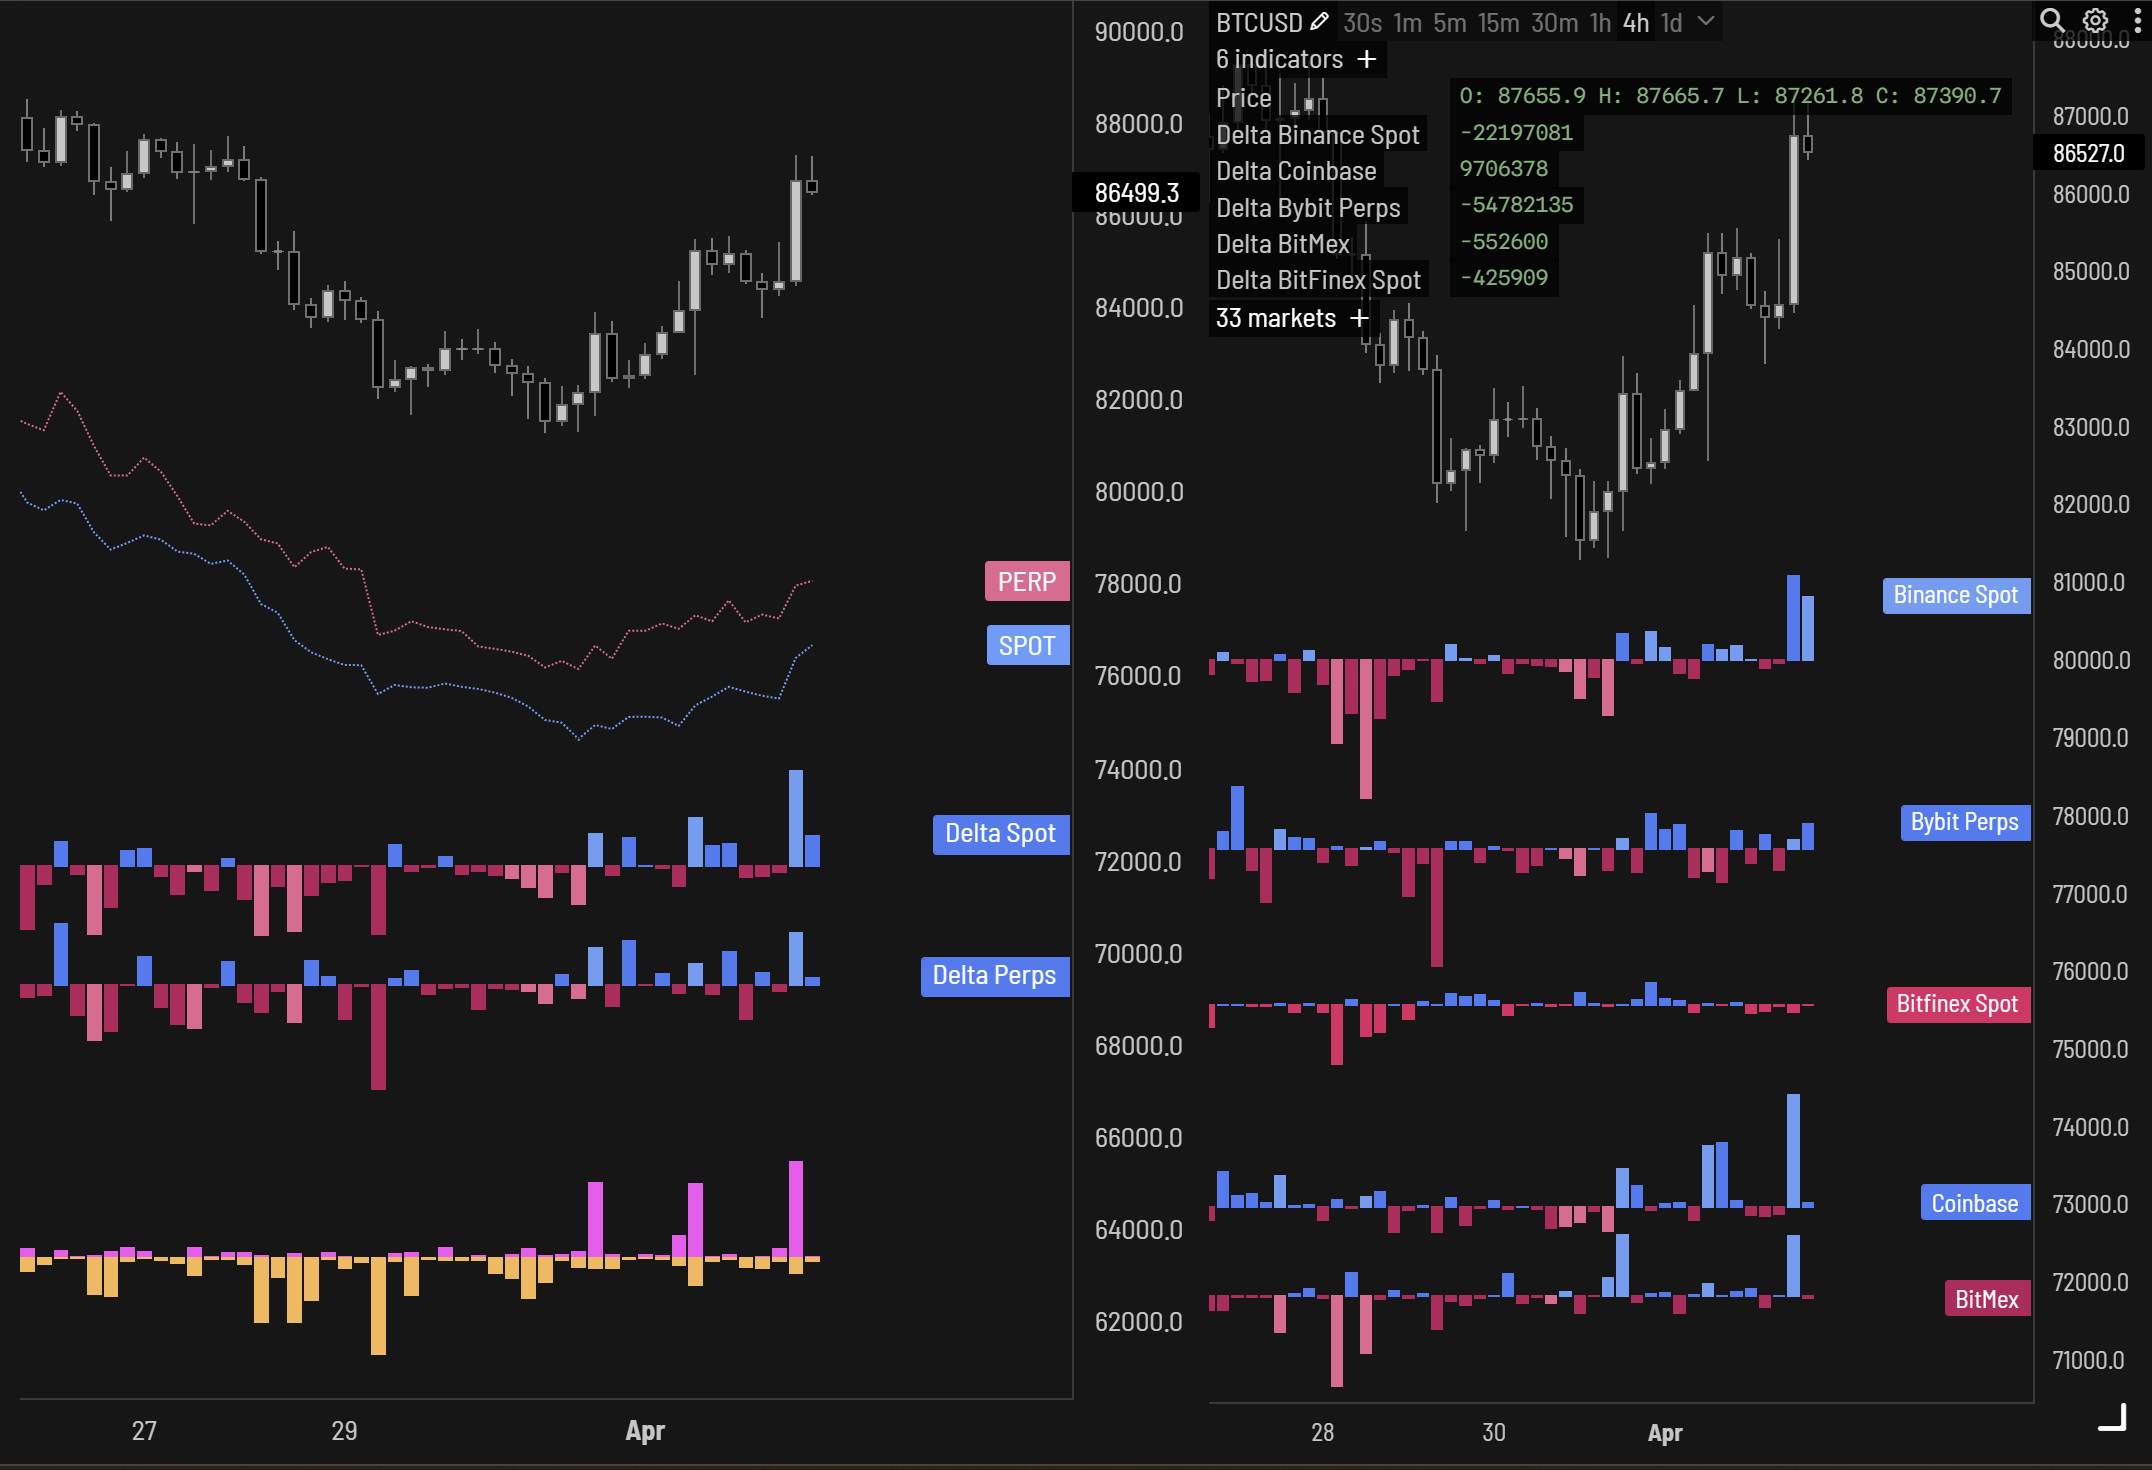
Binance, Coinbase spot buyers data. Source: Aggr.trade
Data provided by aggr.trade
indicates
that the increased buying activity on Coinbase and Binance is a key driver in Bitcoin’s positive performance. Coinbase, in particular, shows strong buying pressure, with spot bids increasing to as much as $7.98 million in recent hours.
Similarly, crypto market analyst Dom
suggested
that the current Bitcoin rally may be related to a reduction in selling pressure from Binance. According to the analyst:
“Bitcoin has found some upward momentum since Binance selling activity decreased. We are even observing some spot buying from their traders for the first time in over a week.”
Related: Bitcoin breaks $86K as US tariff ‘Liberation Day’ risks 11% BTC price dip
Bitcoin Converts $84,000-$85,000 Resistance Into Support
From a technical analysis standpoint, Bitcoin has successfully transformed the $84,000-$85,000 resistance area into a support level. Additionally, the cryptocurrency is now trading above its 50-day, 100-day, and 200-day exponential moving averages (EMAs), indicating a bullish trend.
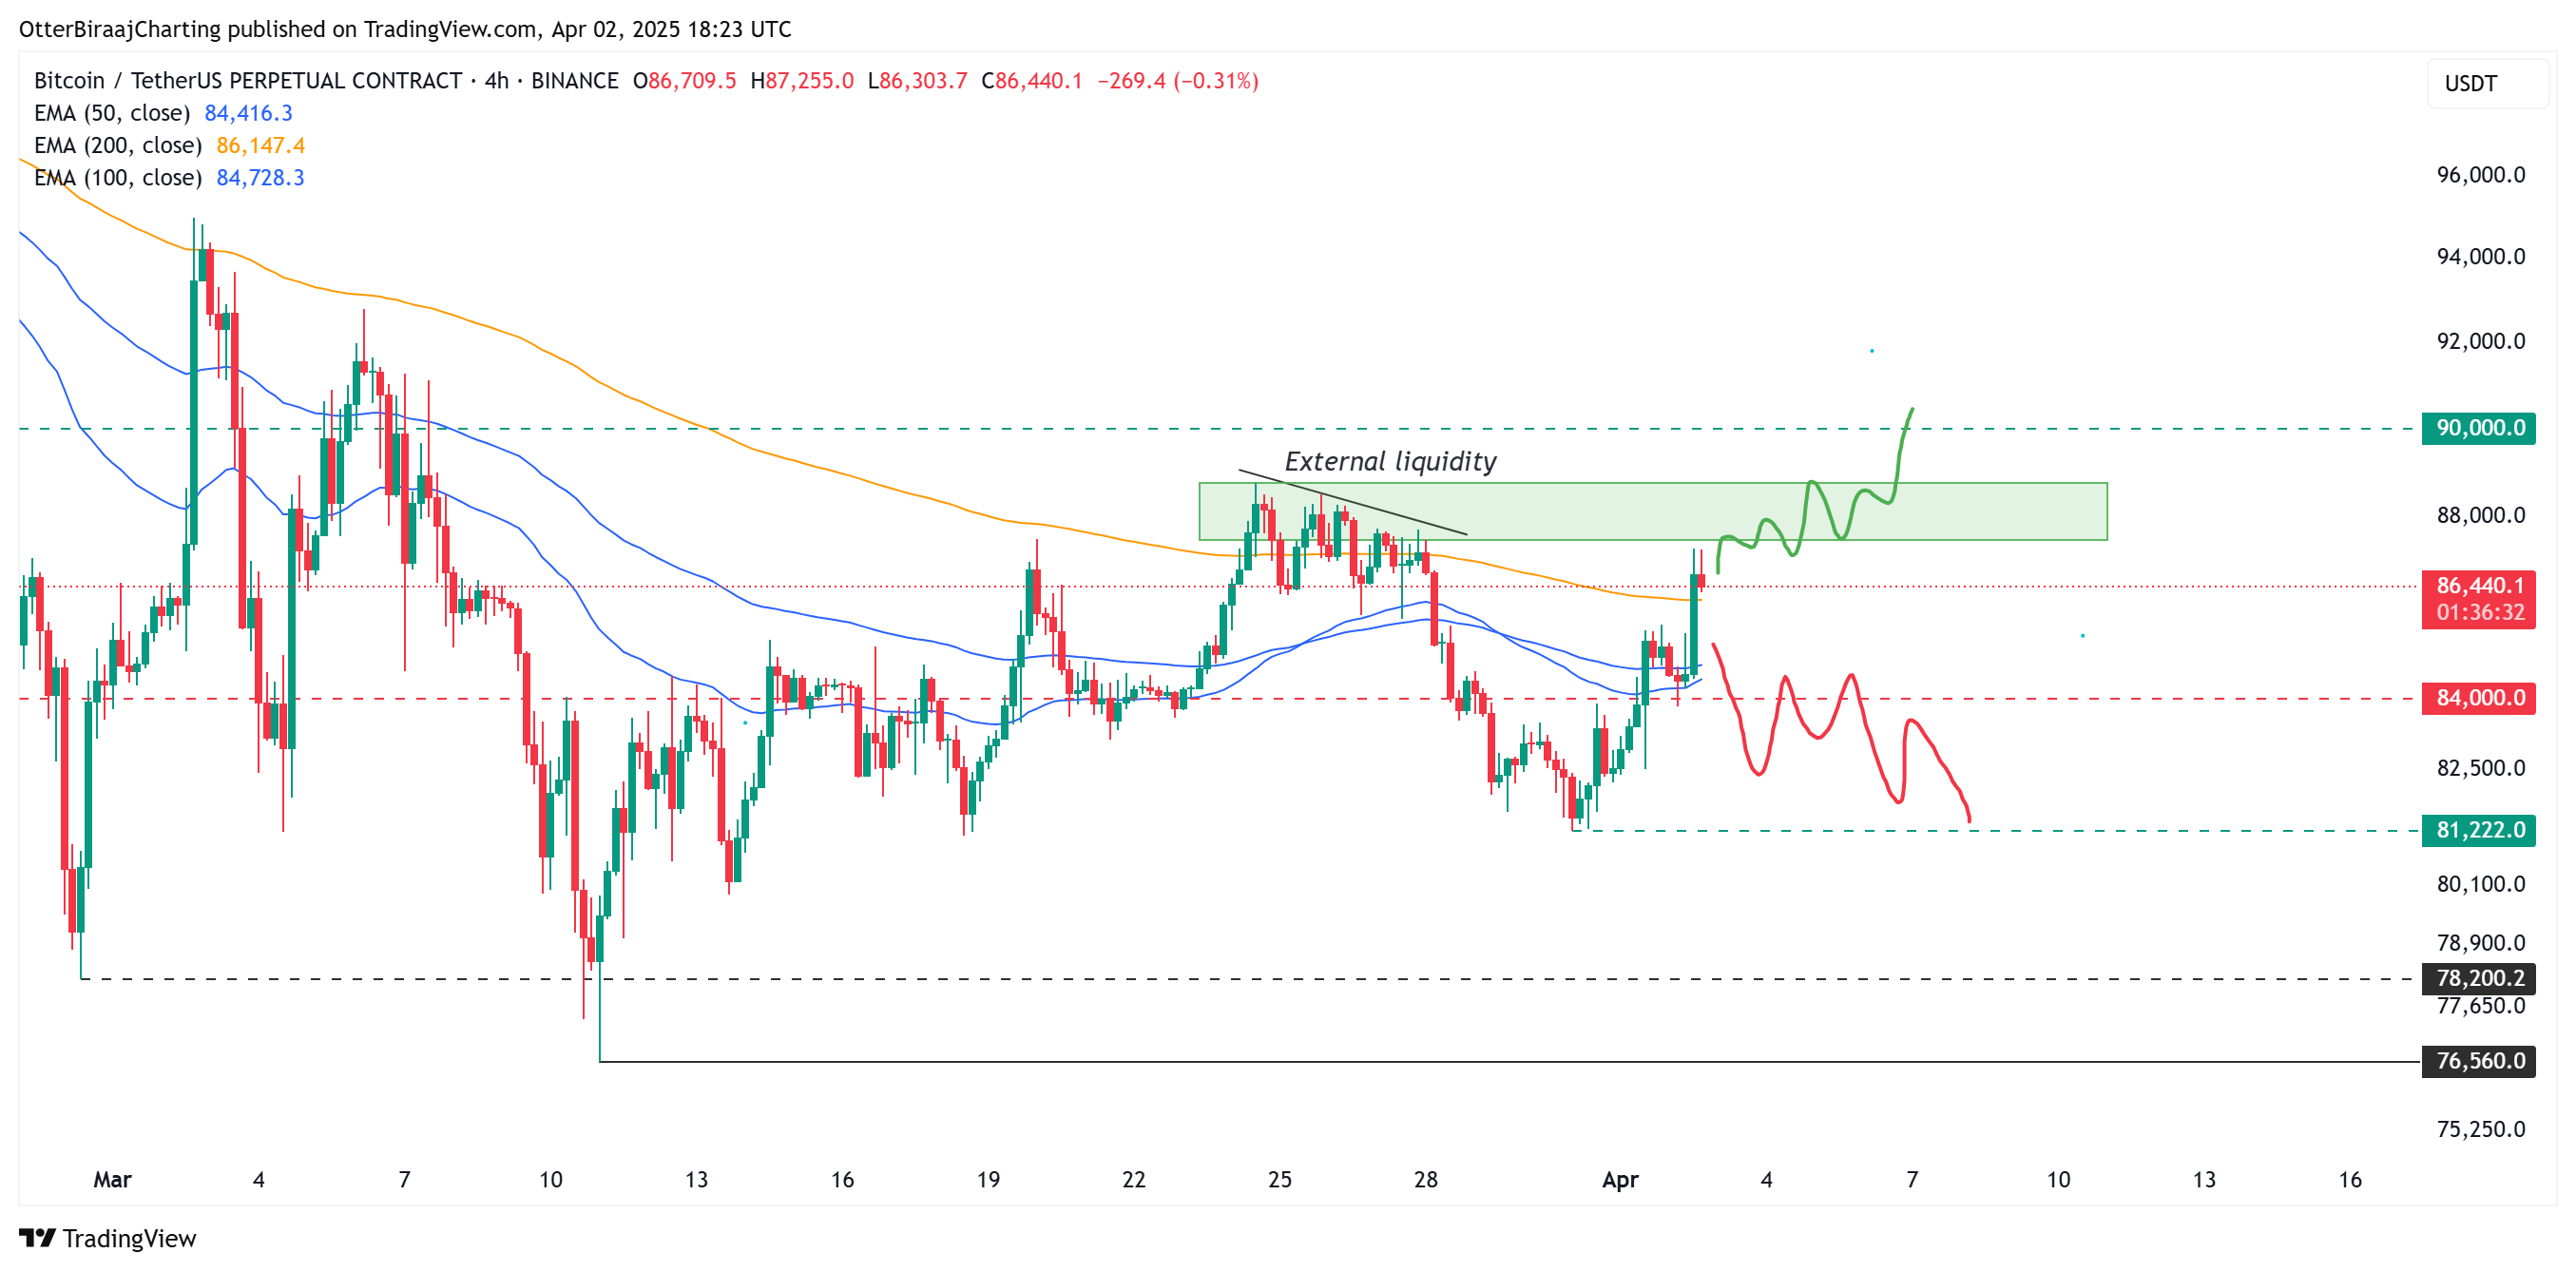
Bitcoin 4-hour chart. Source: Cointelegraph/TradingView
However, based on external liquidity levels around $87,700-$88,700, which previously formed highs, Bitcoin’s price may face challenges in immediately breaking through this range. Consolidation within the indicated green box (as seen in the chart) could be a positive sign, potentially setting the stage for a retest of the $90,000 level for the first time since March 7th.
Conversely, an immediate retracement to the current $84,000-$85,000 support level could dampen bullish enthusiasm, potentially leading to short sellers gaining control of the market.
A break below $85,000 in the coming days could invalidate the current bullish outlook.
With the markets anticipating increased volatility ahead of President Trump’s “Liberation Day” tariffs, Bitcoin’s price is likely to react further during today’s White House press conference at 4 pm Eastern Time.
Related: Bitcoin price can hit $250K in 2025 if Fed shifts to QE: Arthur Hayes
This analysis is for informational purposes only and should not be considered investment advice. Cryptocurrency investments carry inherent risk, and individuals should conduct thorough due diligence before making any investment decisions.