

Key Points:
-
The Bitcoin volatility gauge suggests a possible price surge, hitting a multi-month low.
-
Data shows short-term Bitcoin holders are confident, creating a historically favorable buying opportunity.
Recent Bitcoin (BTC) price movements indicate a period of steady purchasing, but market analysis suggests this calmness might not last.
Bitcoin’s 30-day implied volatility index (BVIV) has decreased to 40.84, falling below 45. This key level has only been broken a few times in recent years. Historically, similar dips have preceded accumulation phases or temporary price bottoms, typically followed by significant price increases. For example, the last time the BVIV was this low, Bitcoin’s value jumped nearly 50% from $26,000 in September 2023.
Since late 2022, almost every time the weekly BVIV has closed below 45, Bitcoin’s price has either consolidated or experienced a strong positive reversal. This trend suggests that the current low volatility could signal a future upward breakout, assuming historical patterns continue.
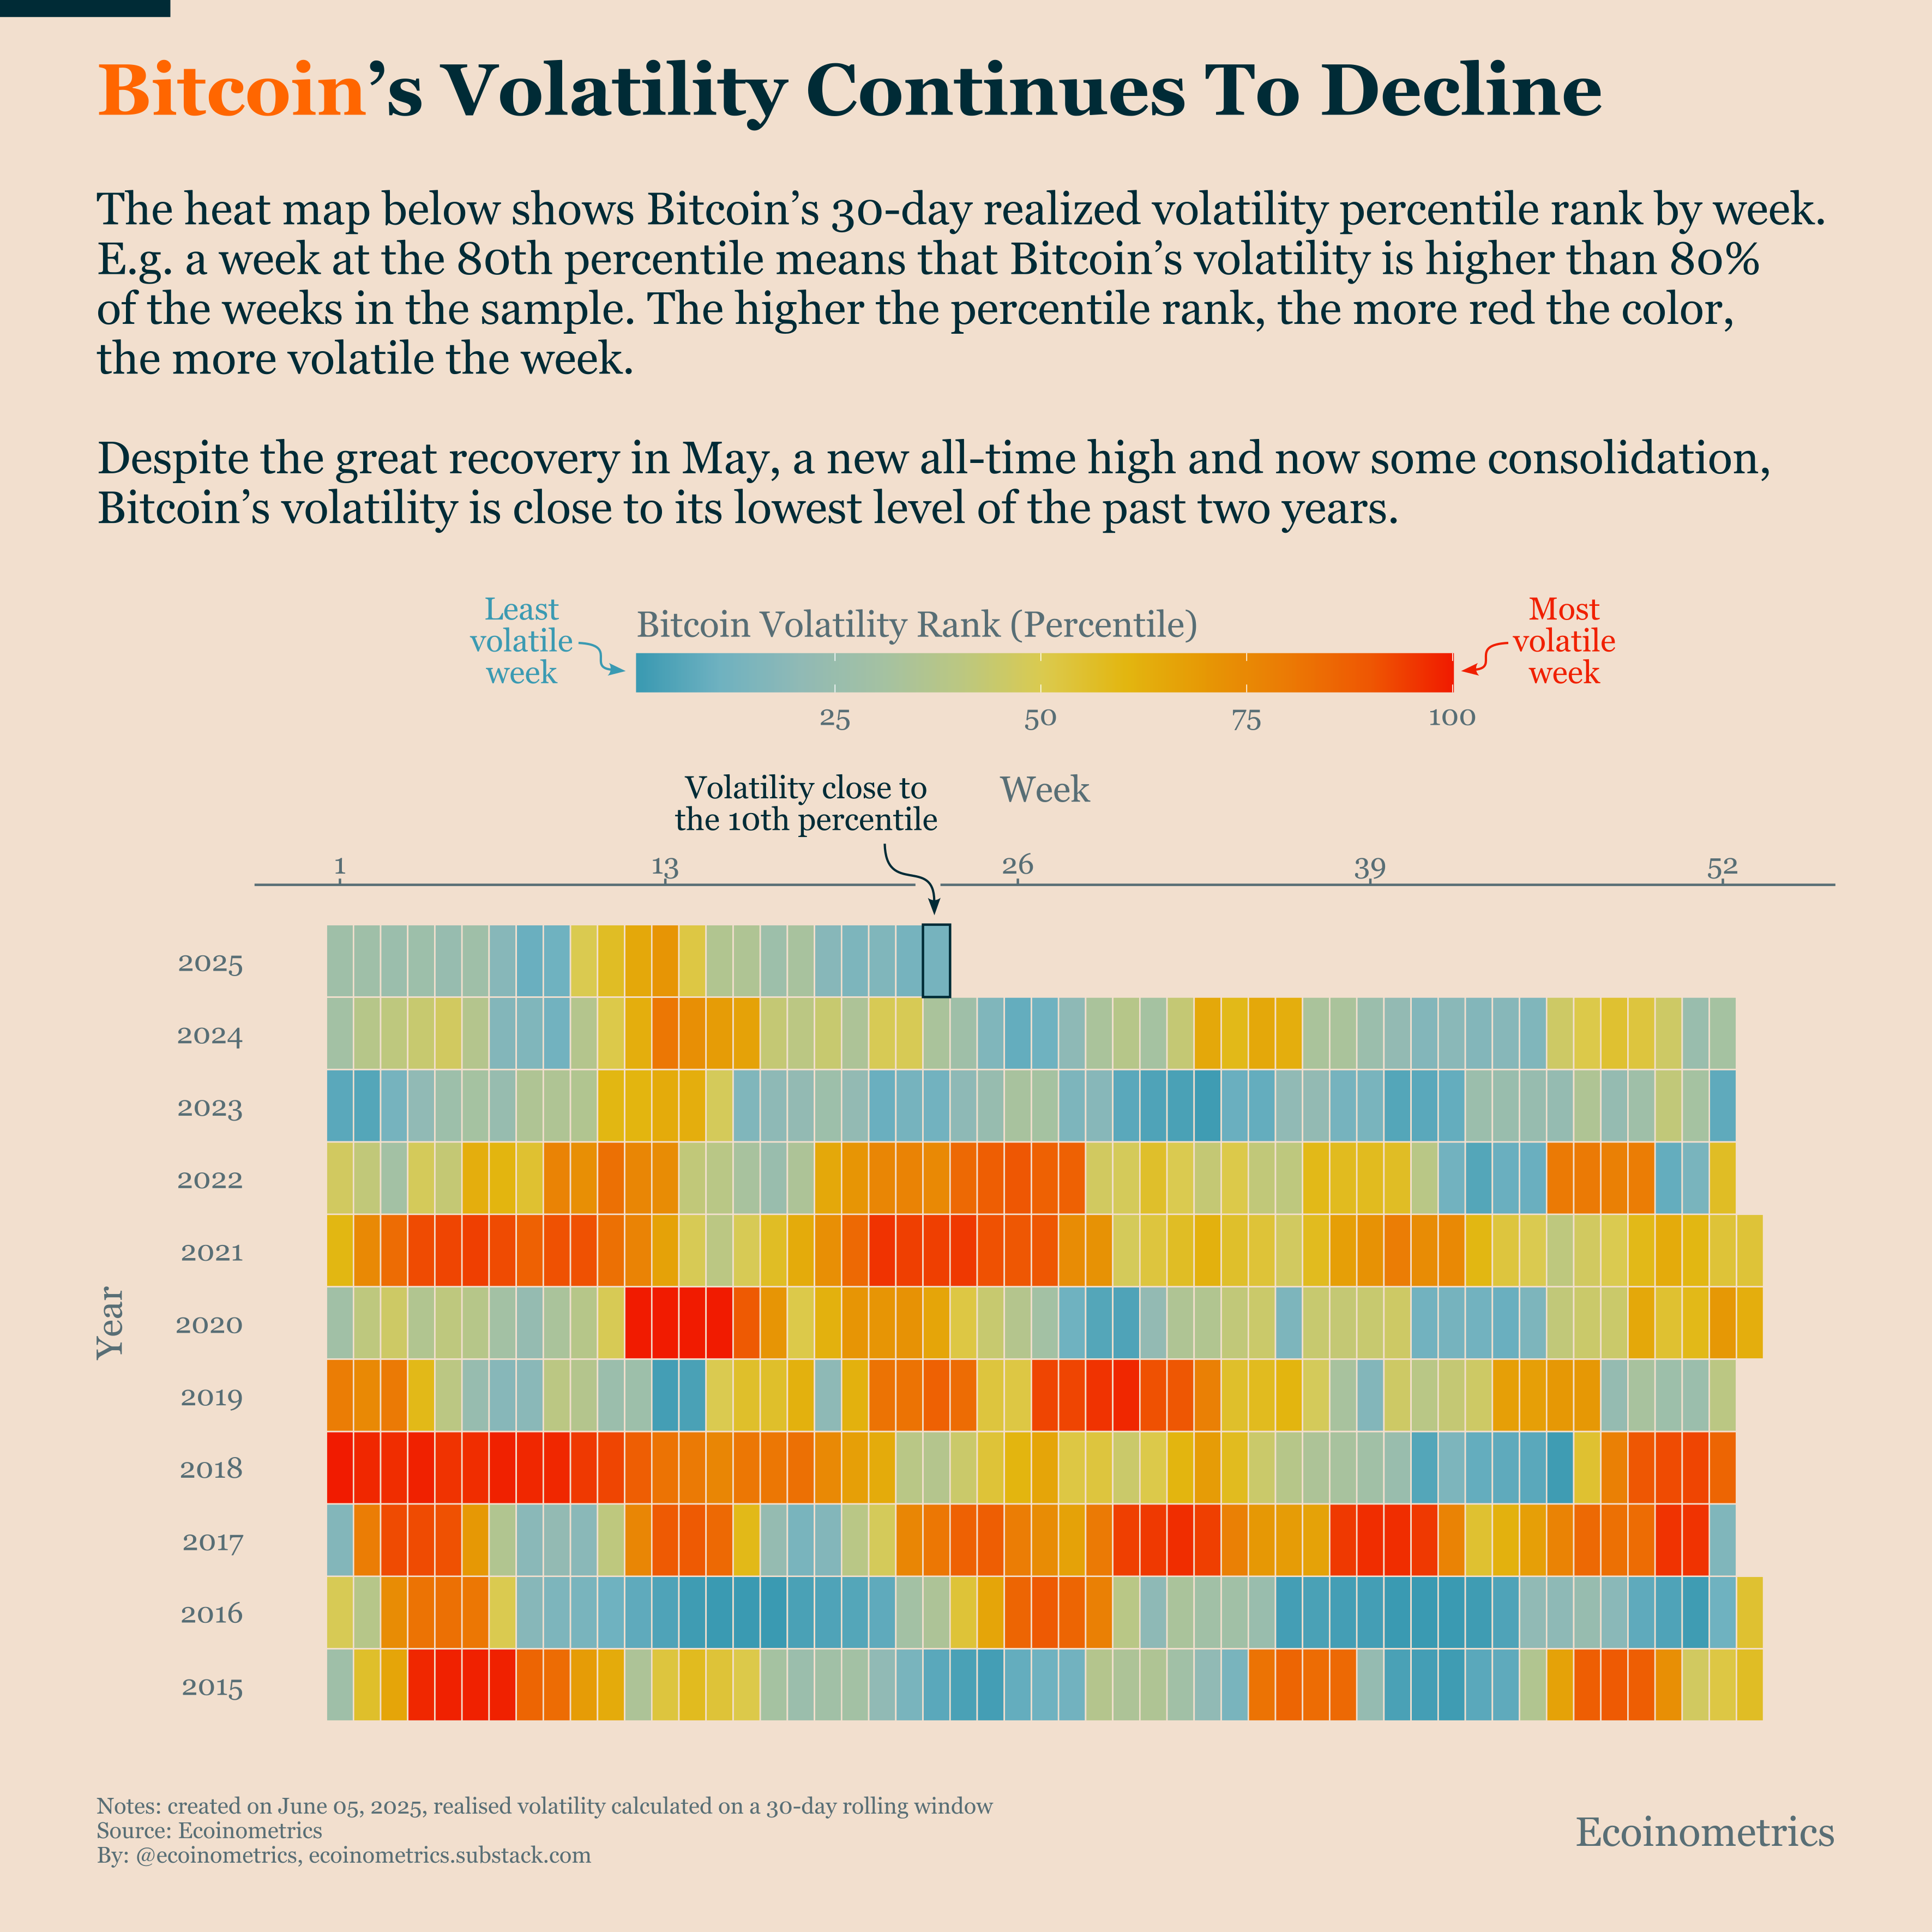
Current market indicators show evolving dynamics. Despite Bitcoin reaching new record highs earlier in May 2025, the 30-day realized volatility has been consistently decreasing, now sitting in the bottom 10% of its range over the last decade.
Analysts at Ecoinometrics suggest this points towards a potential shift. Bitcoin might be developing into a more stable asset, capable of generating returns with reduced fluctuations—a desirable characteristic for large institutional investors who manage volatility risks.
If this new volatility pattern holds true, the BVIV might remain suppressed for a longer period compared to previous market cycles, potentially delaying a significant volatility-driven price spike. However, considering past price behavior around these levels, a bullish outlook is generally favored, and investors are closely watching for any changes.
Related: Bitcoin Buying Strategy Paused Amid New Equity Offering
Bitcoin Holders Show Stability
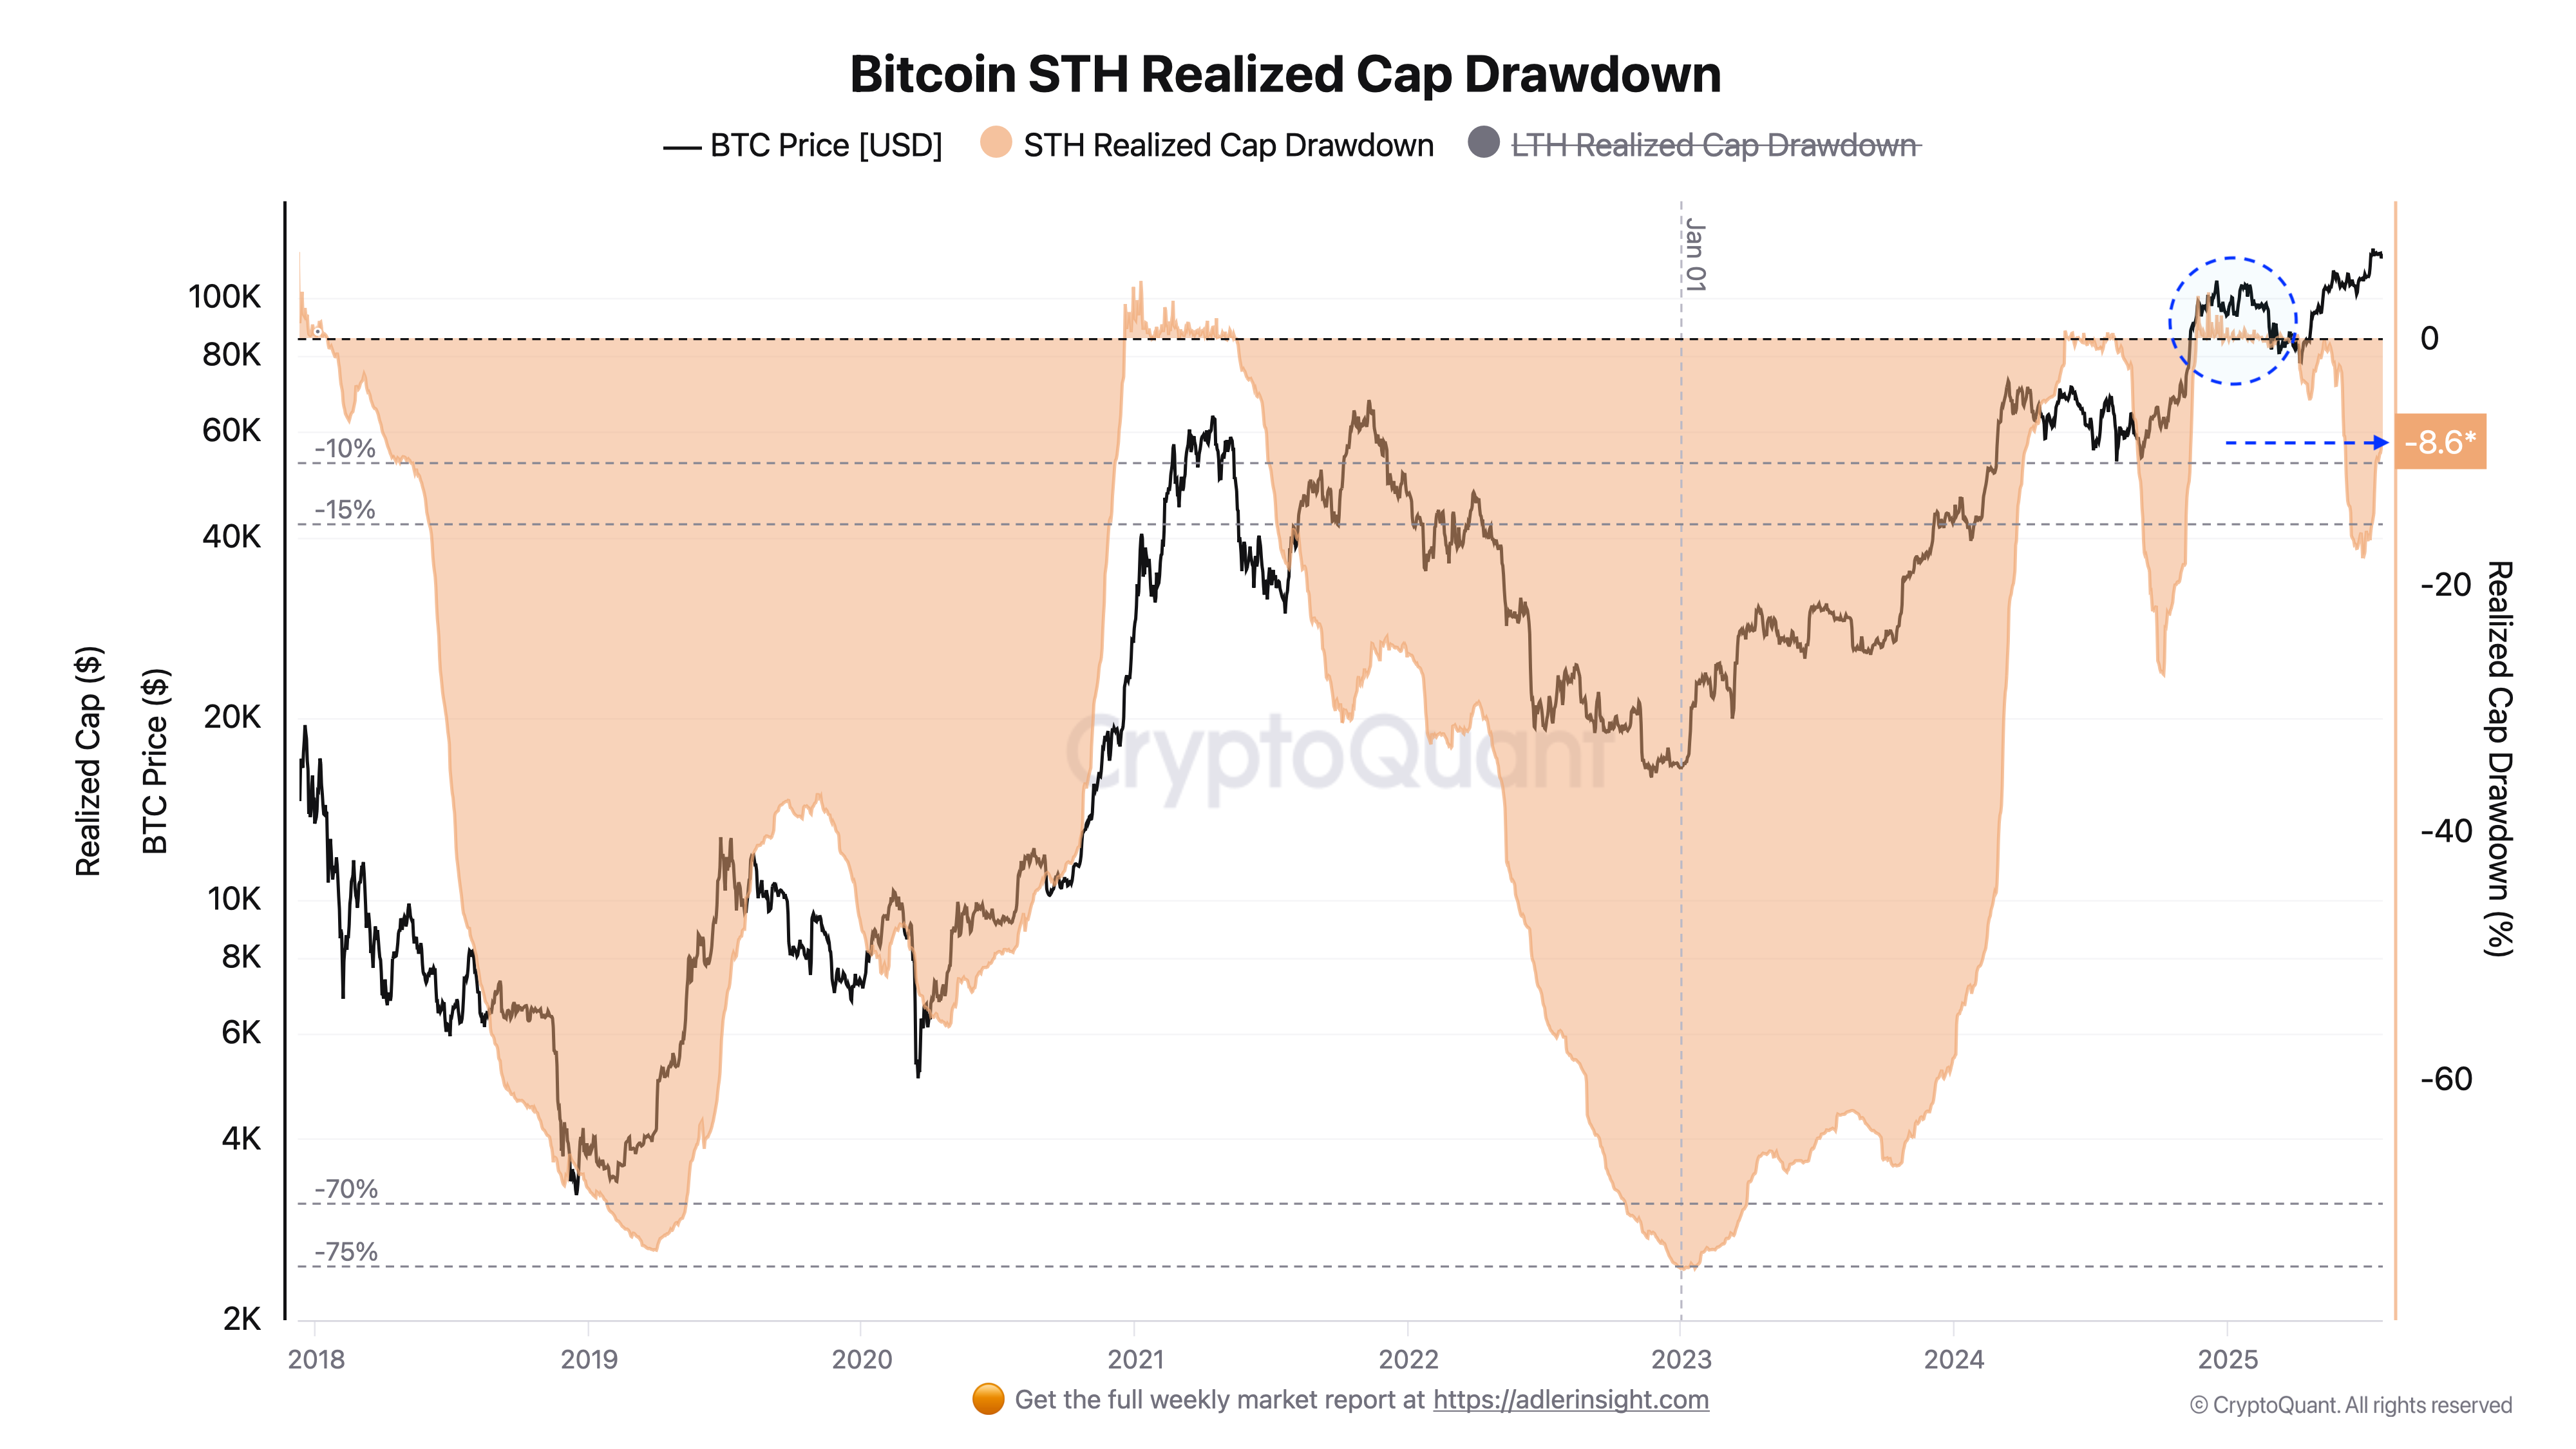
Blockchain analysis reveals continued confidence among short-term Bitcoin holders (STH). The STH realized cap drawdown currently stands at -8%, indicating that more recent market entrants are experiencing relatively small unrealized losses. Historically, this level has often preceded upward movements rather than causing significant declines, suggesting limited panic and reduced forced selling.
The STH market value to realized value (MVRV) ratio further supports this assessment, currently at 1.19 compared to the cycle high of 1.33 in November 2024. This reflects a decrease in speculative activity, with holders preferring to maintain their positions rather than selling for modest profits.
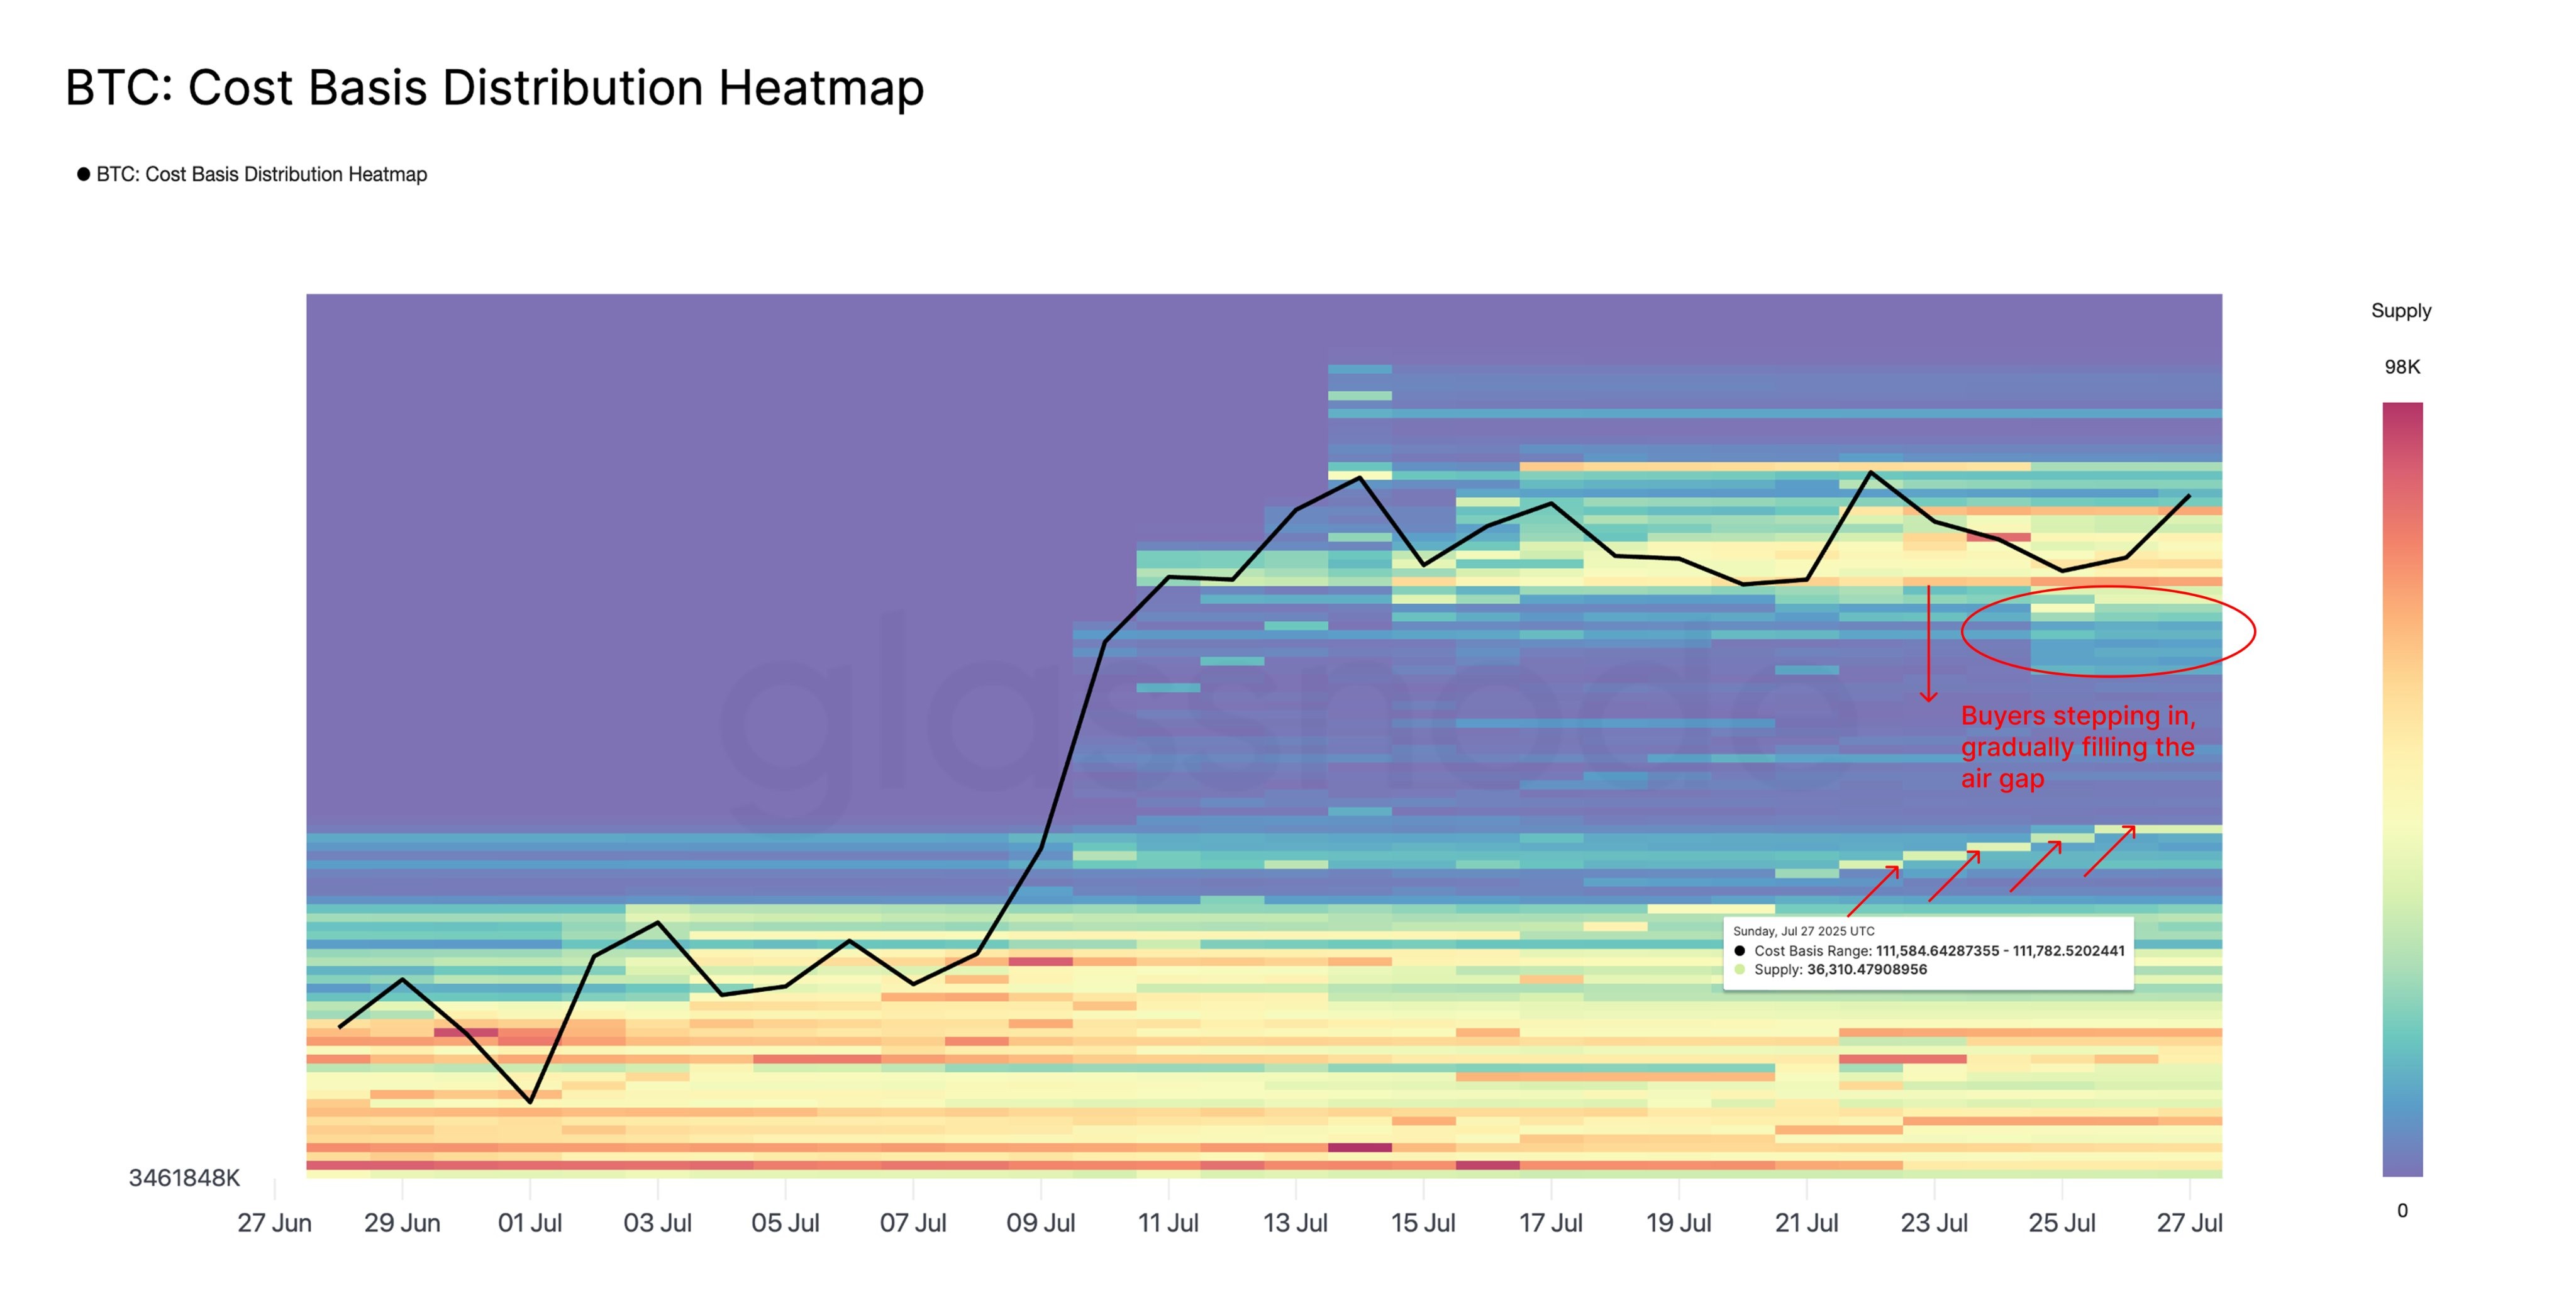
Similarly, Glassnode data indicates growing activity within the $110,000–$117,000 range. Bitcoin is being accumulated at both higher and lower price points, with buyers taking advantage of dips and long-term investors continuing to acquire at higher prices. This has led to a step-like cost basis distribution, a structurally positive sign suggesting organized accumulation rather than emotionally driven trading.
The STH supply has increased to 4.58 million BTC from 4.36 million BTC, adding 227,000 BTC to active circulation. This suggests sustained new demand entering the market, or that long-term holders are reallocating portions of their holdings.
Related: Key Bitcoin Developments This Week
This article is for informational purposes only and should not be considered investment advice. Trading and investing involve risks, and readers should conduct their own independent research before making any decisions.