

Key Points:
-
The value of Bitcoin held, based on when it was last moved, has increased by $30 billion since April 20, suggesting sustained investor interest and new funds entering the market.
-
Bitcoin’s recent trading behavior suggests a possible 10% price increase is on the horizon within the next week.
Bitcoin (BTC) is exhibiting strong positive momentum, with new capital infusions potentially driving prices to new heights in the near future. According to a recent post on X by Glassnode, Bitcoin’s Realized Cap, which calculates the aggregate value of all Bitcoins based on the price when they were last transacted, has seen a $30 billion surge since April 20. This translates to roughly 3% monthly growth during May. The Realized Cap currently stands at $900 billion.
Although this pace is slower than the approximately 8% jump observed in late 2024 when Bitcoin approached $93,000, it’s still a robust indication of continued investor belief and new money flowing into the Bitcoin ecosystem.
Adding to the optimistic outlook, Glassnode also noted a key change in market behavior. The 7-day simple moving average (SMA) of Bitcoin’s Spot Volume Delta has turned positive, hitting nearly $5 billion on May 13.
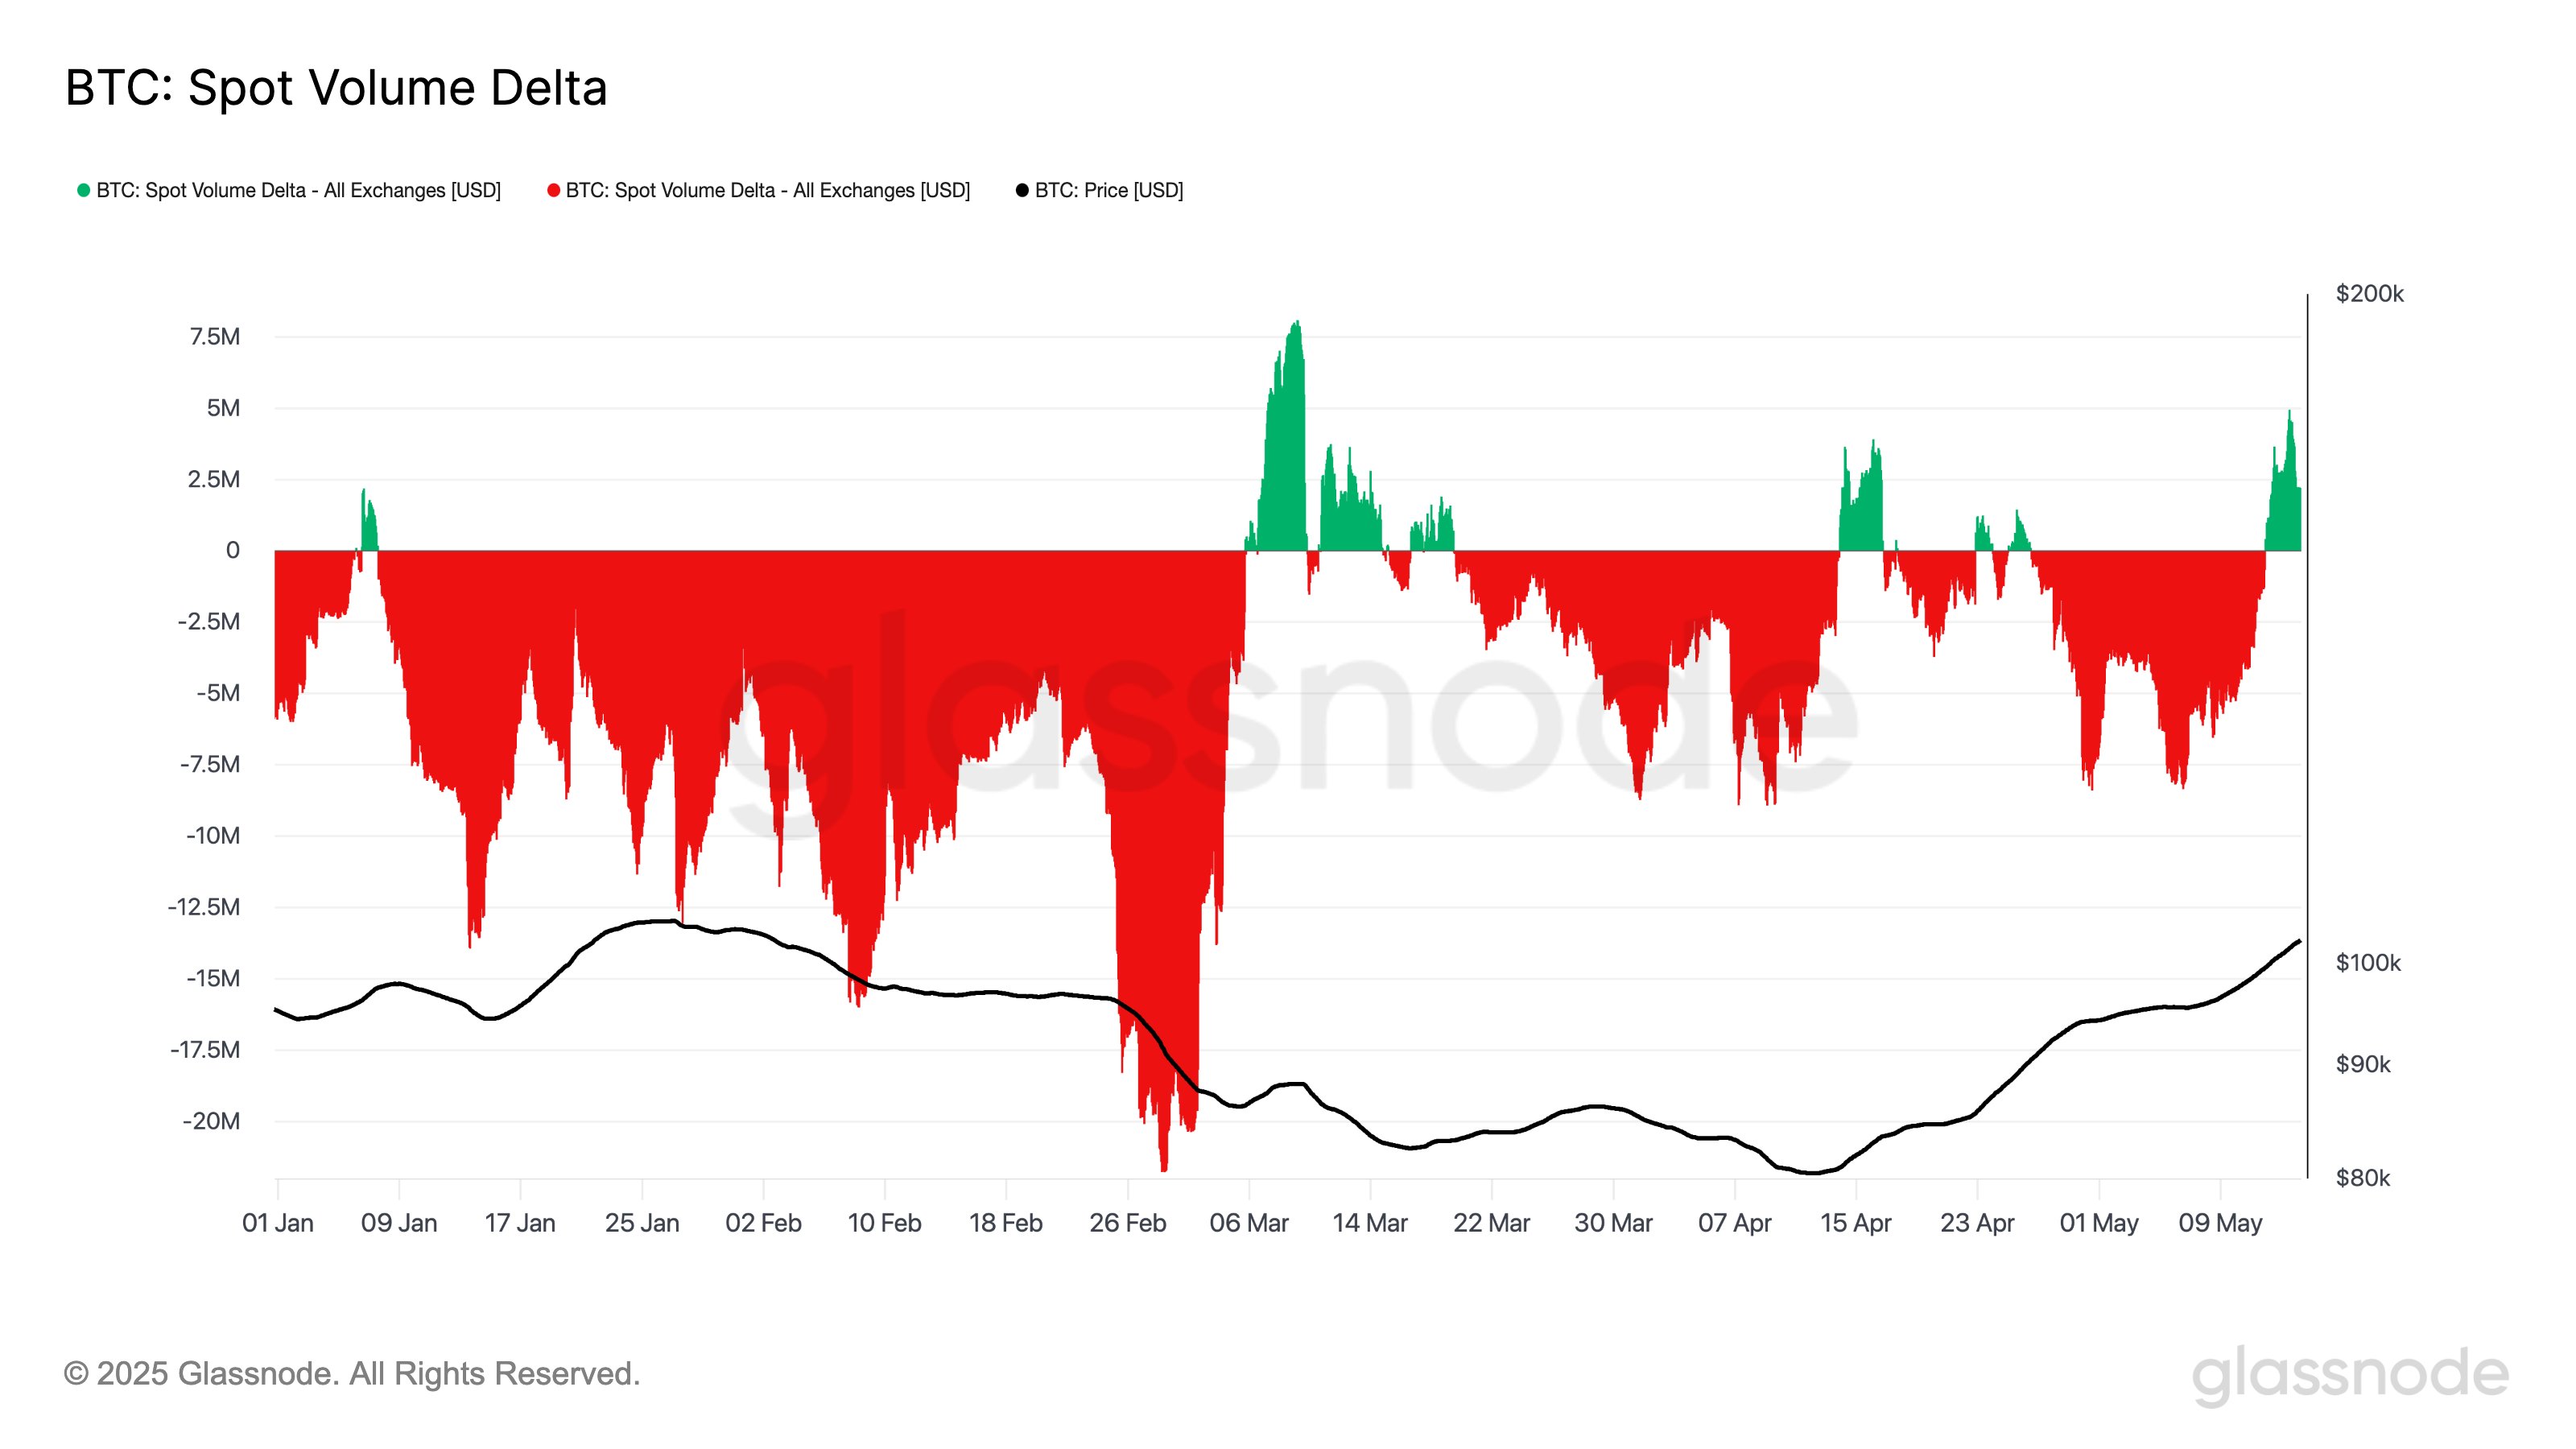
This strong net buying pressure in the spot market, something rarely seen this year, reinforces the idea that there’s serious conviction behind Bitcoin’s recent break above the $100,000 psychological level. This surge in spot market demand indicates that both large institutions and individual investors are driving this rally, rather than just high-risk, leveraged trading.
Even though the Realized Cap increase is smaller than the $50 billion surge seen in late 2024, overall market sentiment is currently favorable.
Is a 10% Bitcoin Price Surge Imminent?
Bitcoin has been demonstrating a consistent pattern of consolidation and expansion since finding a low point around $74,500 in early April. Over the past month, the price action has shown a repeating pattern: each time Bitcoin reaches a significant level, it trades sideways for a time before breaking out into a higher range. This pattern has played out twice, and a third consolidation period is currently in progress.
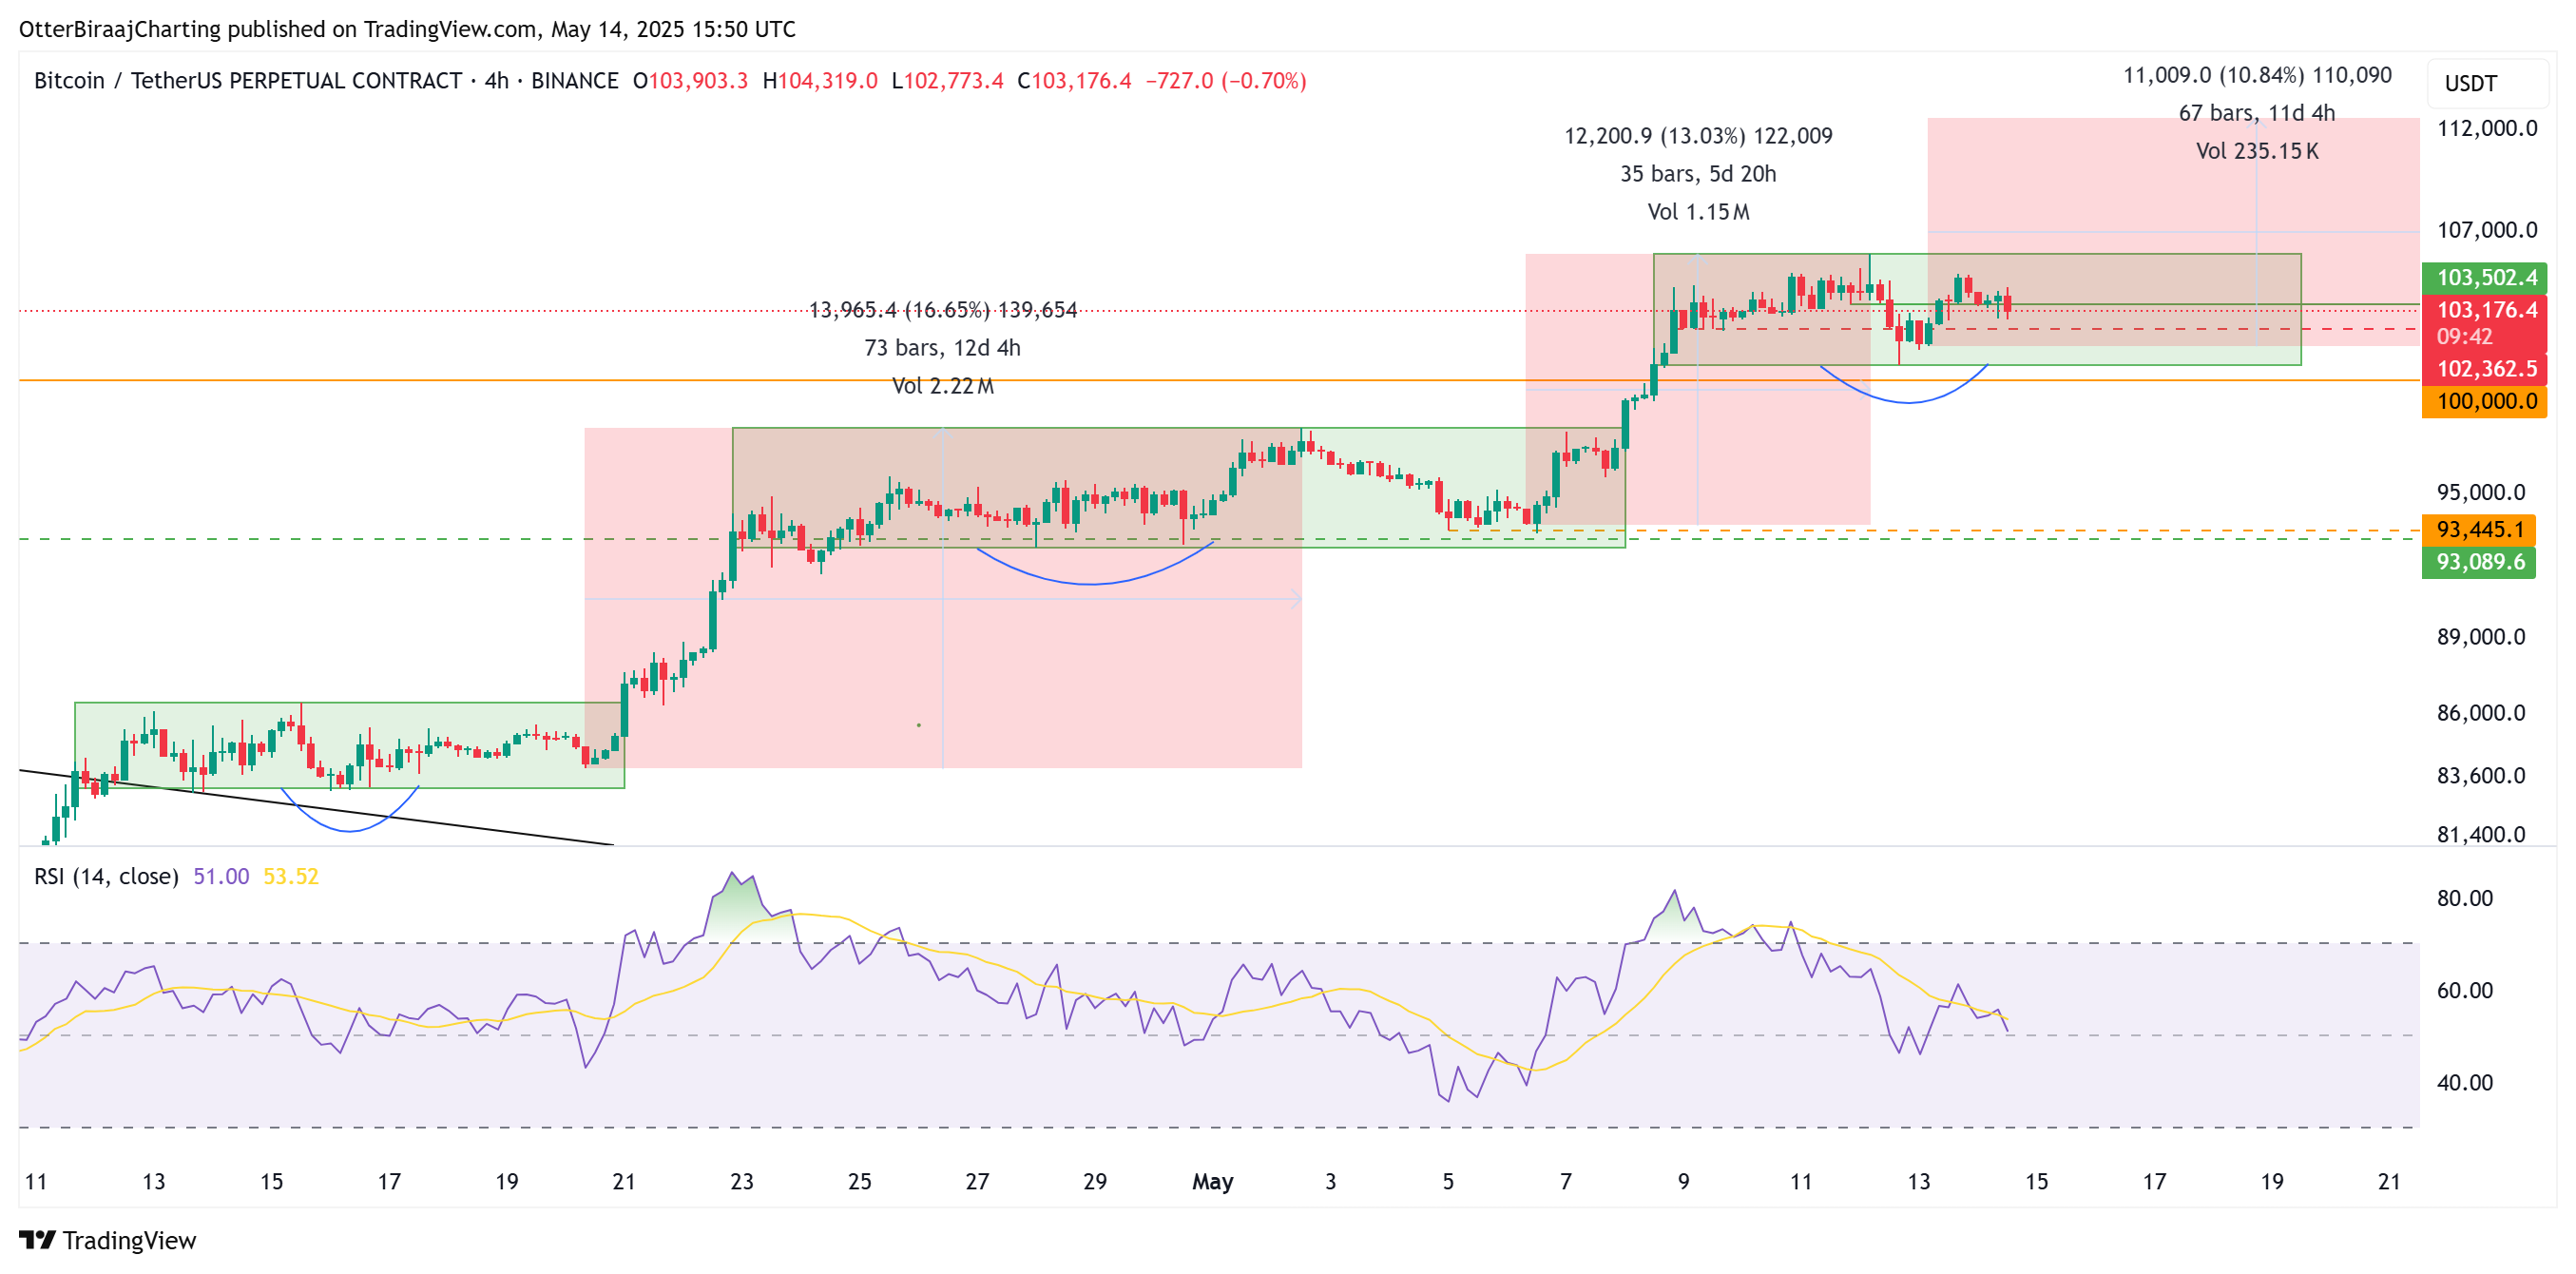
Each phase of this pattern has had a similar structure, establishing higher upper and lower boundaries for the price. The lower range is typically tested at least once before Bitcoin attempts to reach new highs. The Relative Strength Index (RSI) has reflected this price behavior, entering overbought territory during price peaks and then dropping to around 50 during periods of sideways trading.
At the moment, Bitcoin is consolidating between $105,700 (upper range) and $100,678 (lower range). If this pattern continues, Bitcoin might retest the $100,000-$102,000 area before potentially breaking above $110,000. However, a bearish scenario could play out if prices decline below $102,000 and fail to recover quickly.
Related: Analyst: Market volatility indicator still suggests Bitcoin at $135,000 within 100 days
This article is for informational purposes only and should not be considered financial advice. All investment and trading decisions carry risk, and it is essential to conduct thorough independent research before making any decisions.