

Key Points:
-
Historical patterns in Bitcoin’s price movement from 2021 suggest a potential drop to the $60,000 level.
-
Optimistic analysts believe the $104,000 support will hold, targeting price increases to $140,000 or higher.
The value of Bitcoin (BTC) has experienced a decline of over 12.75% from its peak value of above $124,500, resulting in a division among traders regarding its future direction.
Some interpret this as a typical pullback within an ongoing bull market, while others caution about the possible start of a new bear market. The crucial question is: which perspective holds more weight?
Echoes of 2021: Bitcoin Chart Patterns Suggest Potential $60,000 Retest
Various analyses propose that Bitcoin’s price could potentially mirror the trajectory observed leading up to the market peak of 2021.
Crypto analyst Reflection highlights a sequence from 2021 where BTC saw a rapid surge to all-time highs, followed by a peak, a correction towards mid-range support, and ultimately a failed attempt to regain resistance.
This sequence of events led to a significant crash exceeding 50%, plummeting Bitcoin’s value from almost $69,000 to roughly $32,000 within a matter of weeks.
The current price structure of Bitcoin in 2025 is showing similarities to that four-step pattern, with BTC currently trading near a distribution zone comparable to the one preceding the bearish reversal in 2021.
Should this pattern persist, the cryptocurrency is at risk of experiencing a similar rejection.
Furthermore, on the weekly chart, Bitcoin has broken down from a rising wedge, a bearish chart pattern characterized by higher highs and lows within converging trendlines.
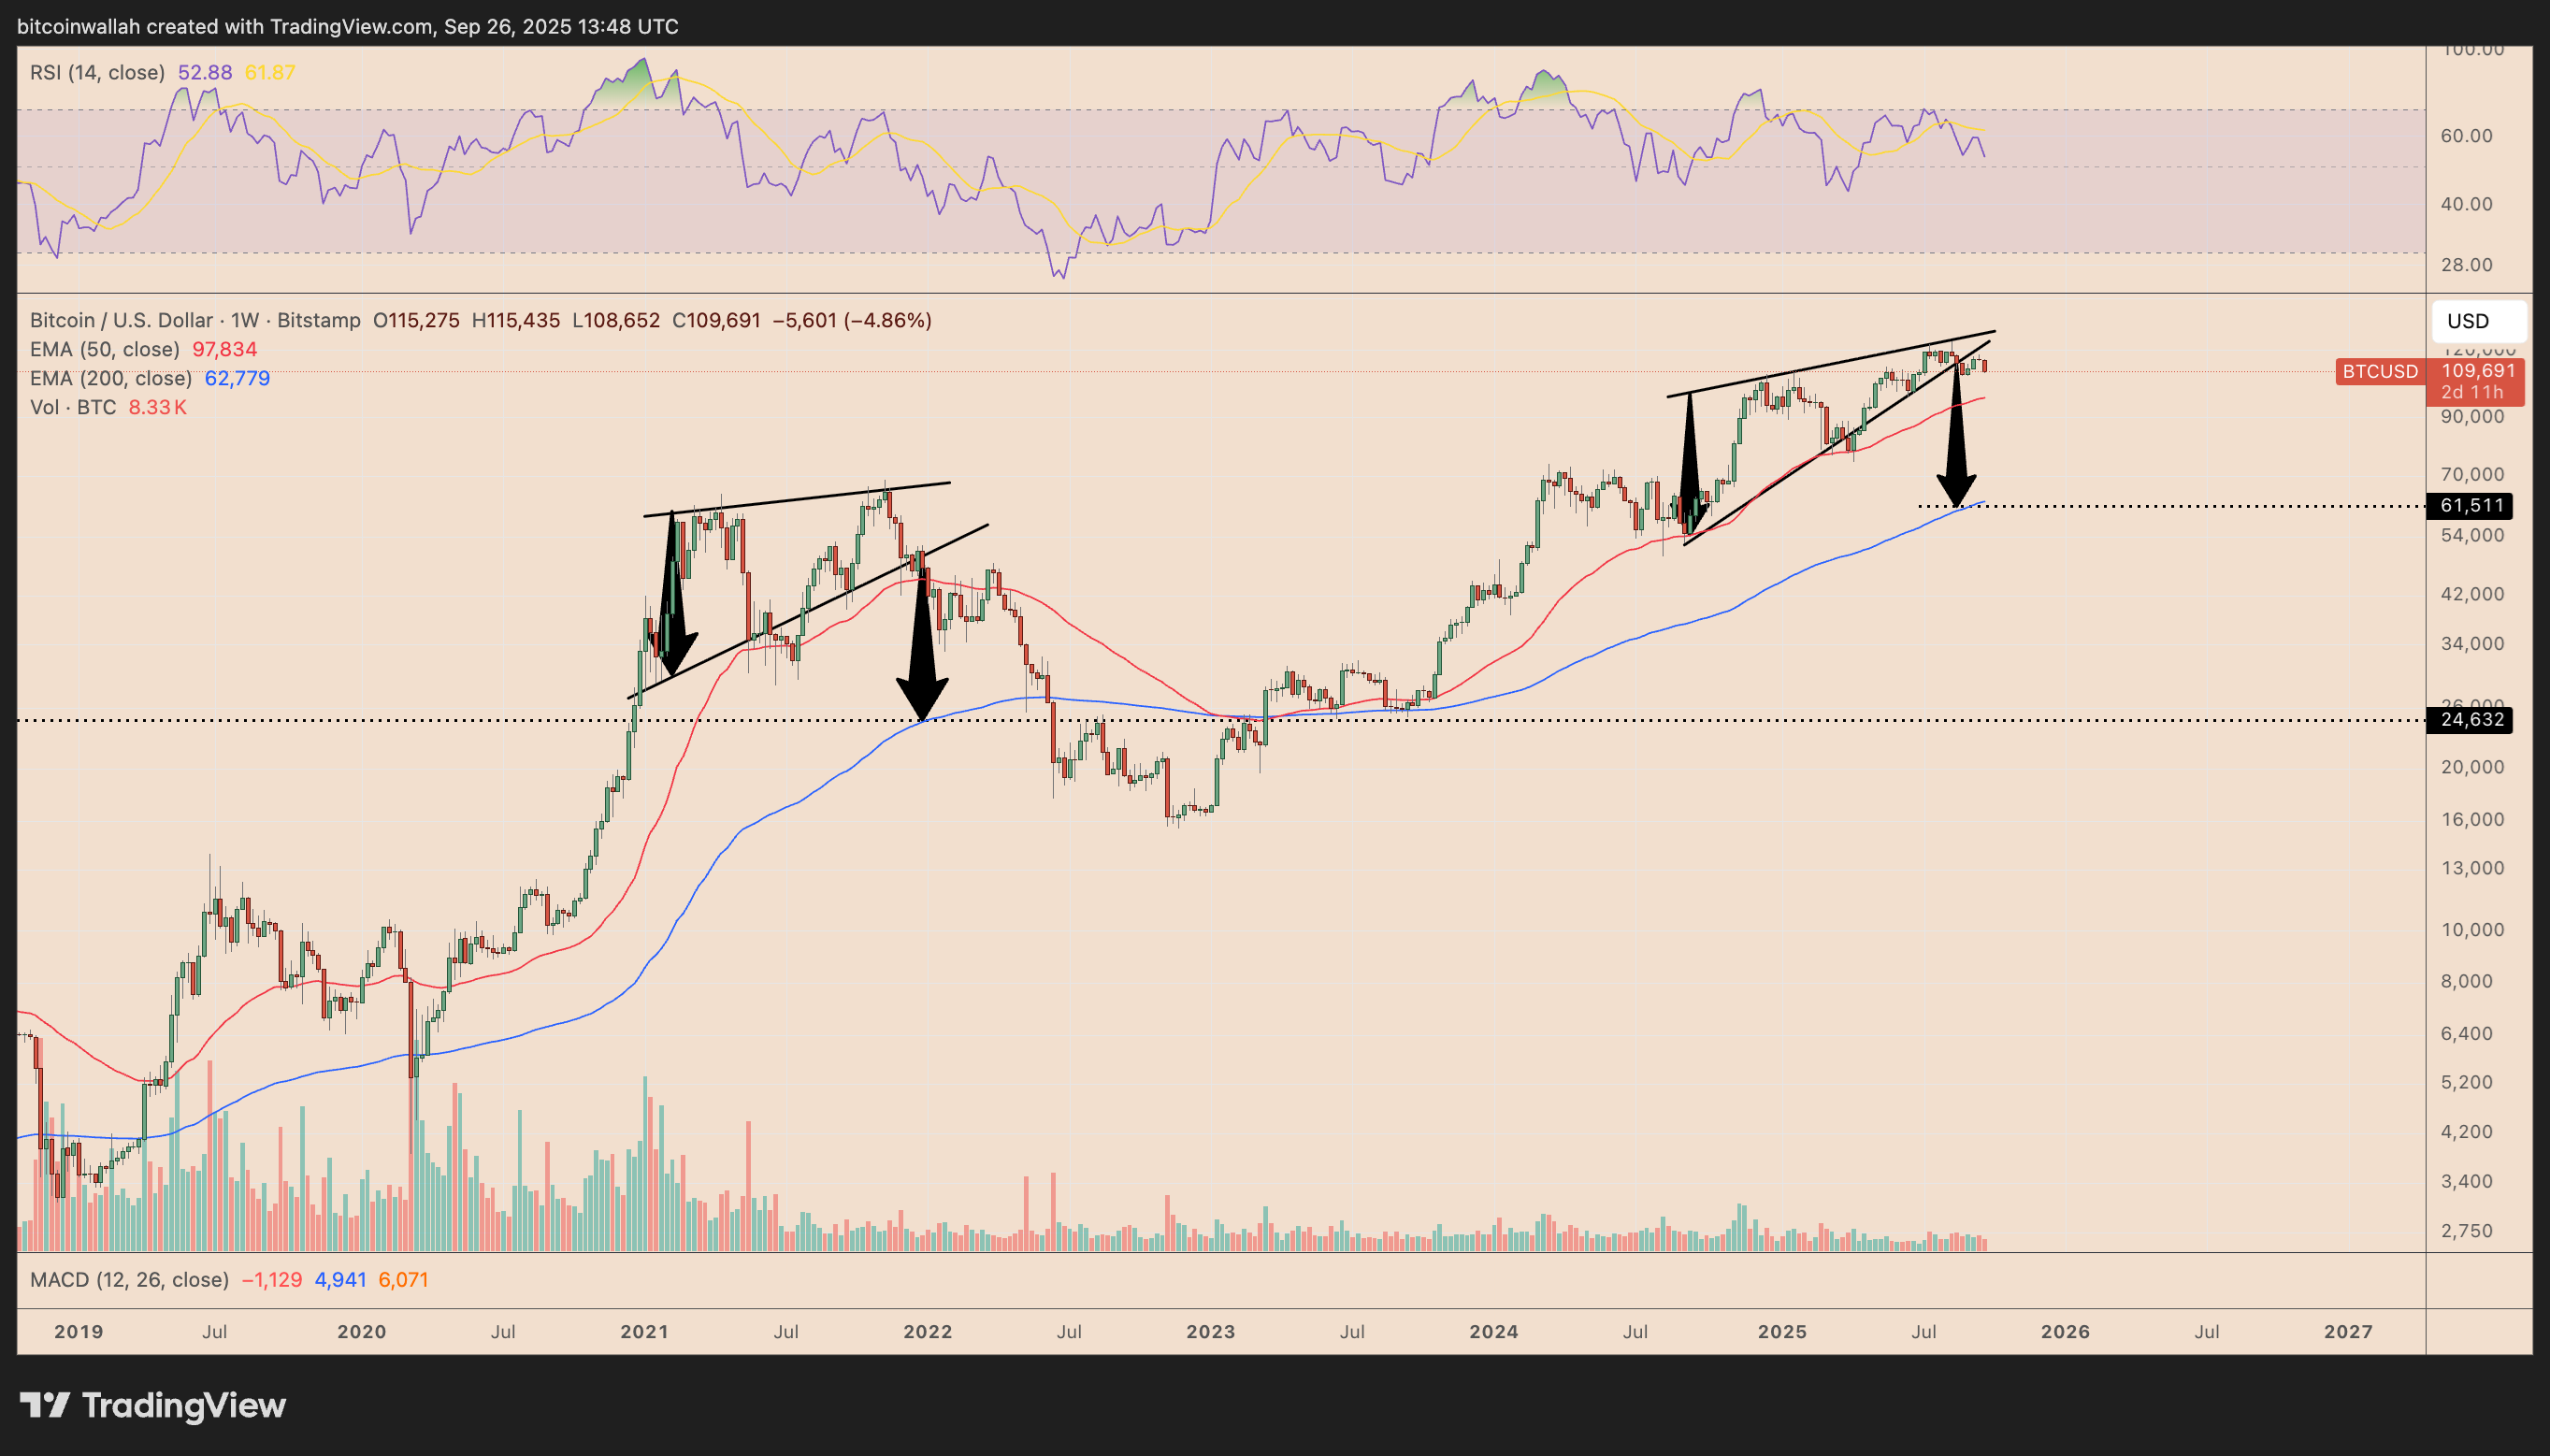
This breakdown increases the likelihood of a decline towards the $60,000–$62,000 area, which aligns with the 200-week exponential moving average (200-week EMA; depicted by the blue wave). Some market observers even forecast a potential drop in BTC’s price towards $50,000.
Interestingly, a comparable wedge collapse in 2021 resulted in a 55% correction down to the same 200-week EMA support level.
Potential for Bitcoin to Rebound Above $124,500 Remains
However, not all experts are predicting continued declines in the Bitcoin market.
Trader Jesse points out the significance of a cluster formed by BTC’s 200-day simple and exponential moving averages, which have historically acted as support during bull market dips, suggesting that the crypto may establish a “mid-term bottom” at that level.
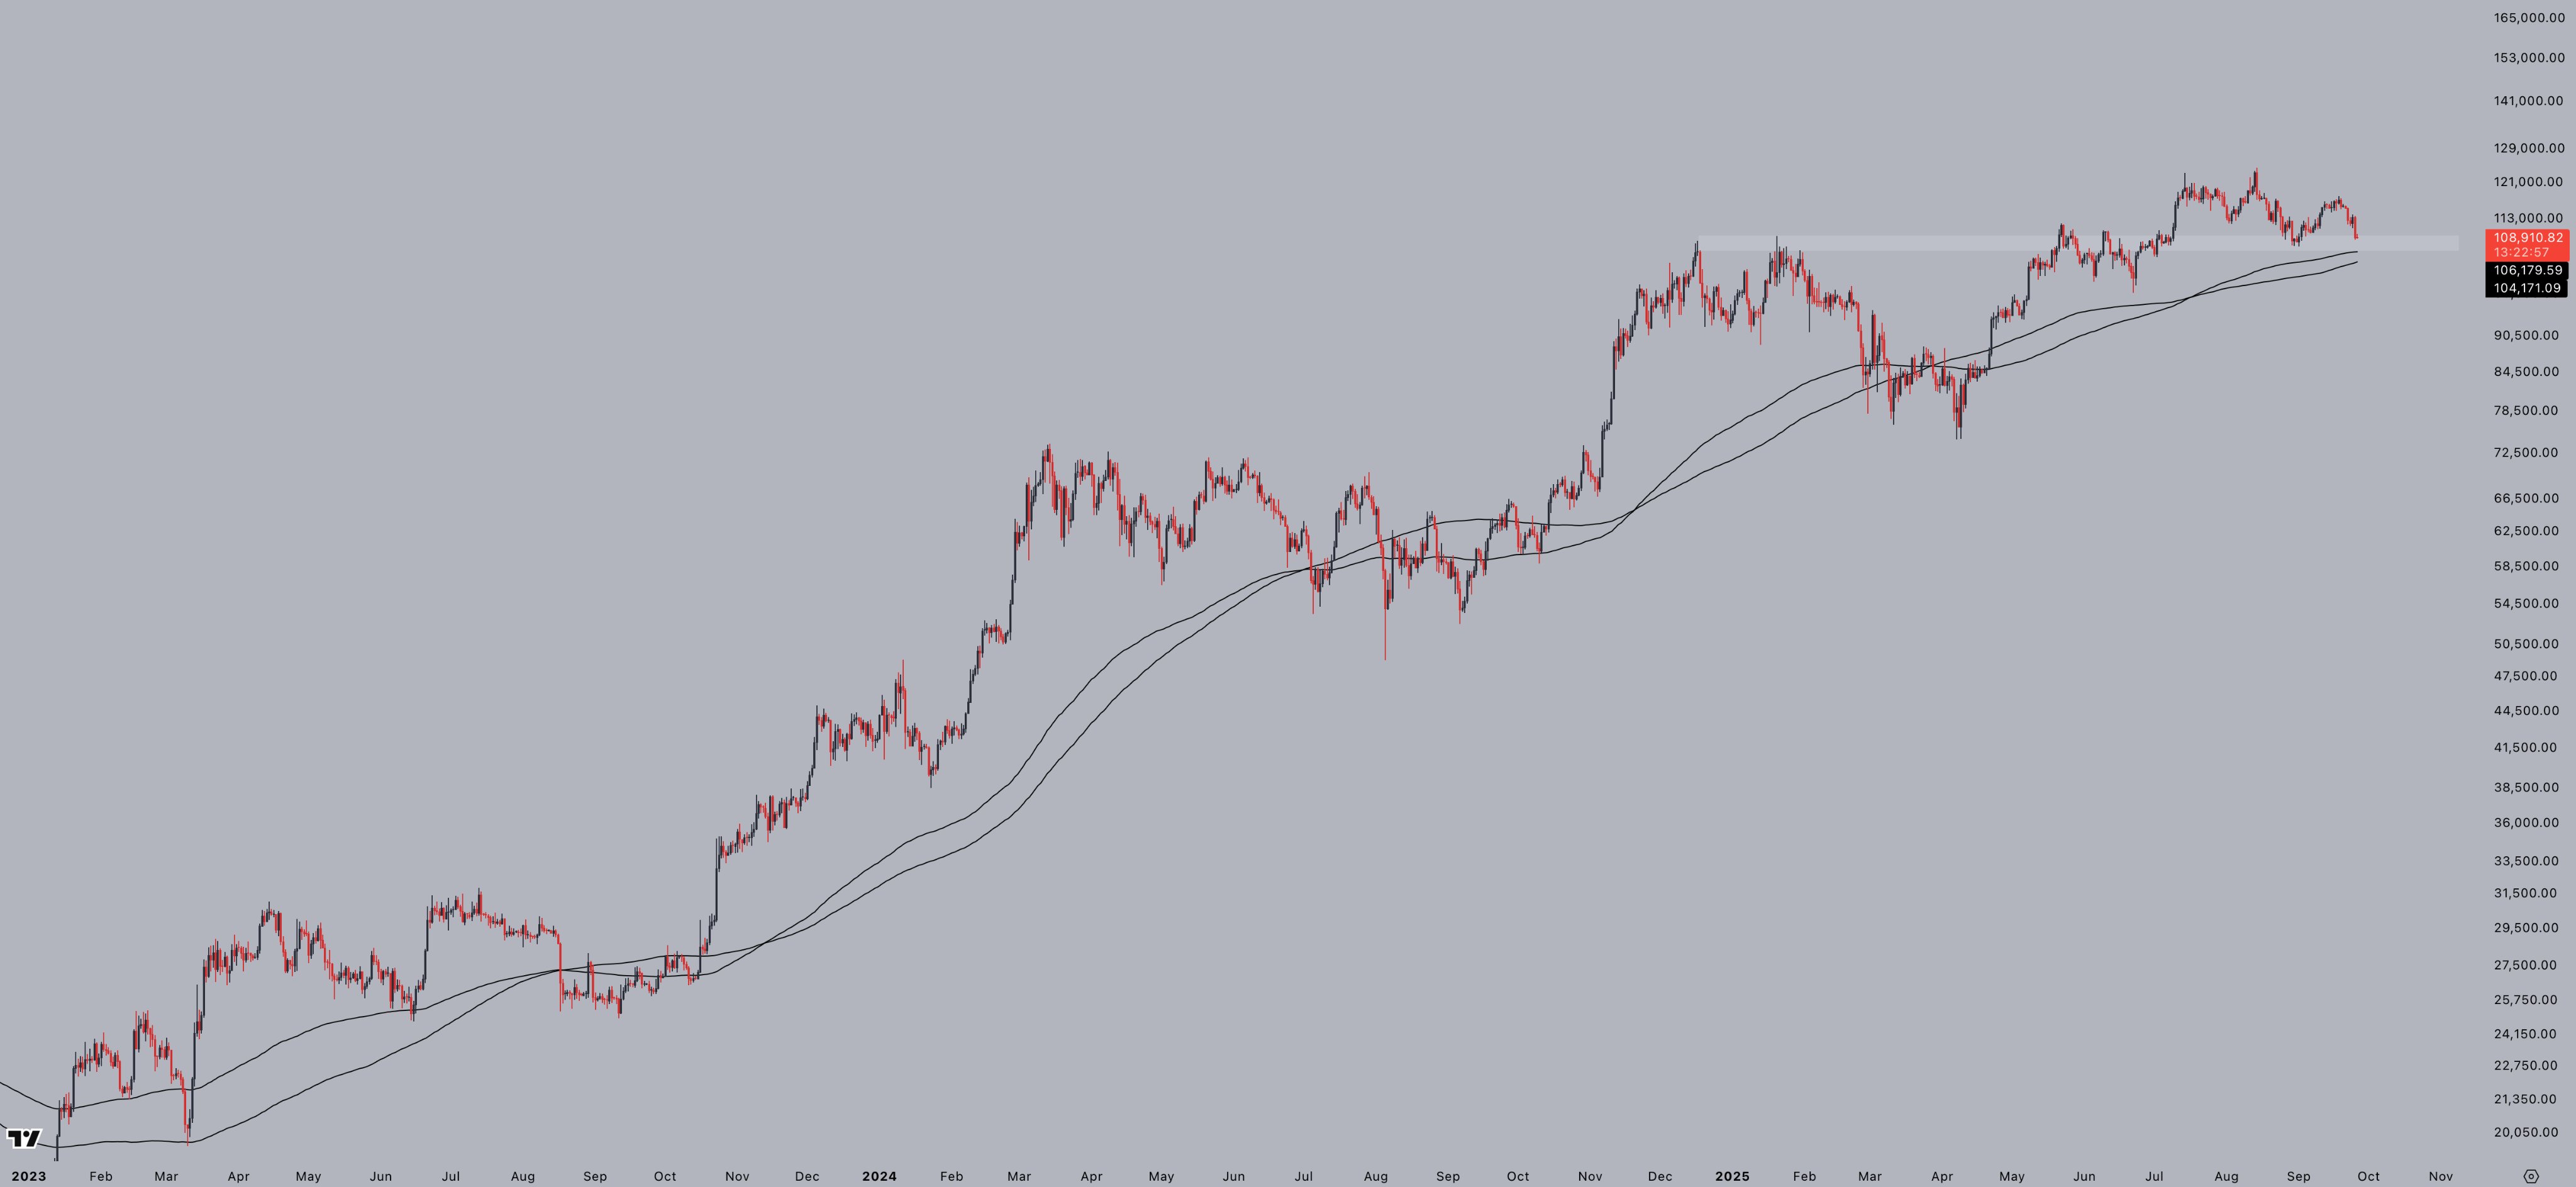
As of Friday, this EMA-based support level was positioned around the $104,000-$106,000 range.
Related: Bitcoin Must Reach $104K to Mimic Prior Bull Market Dips: Research
Analyst Bitbull argues that Bitcoin is not yet nearing a cycle peak, noting that the US Business Cycle, a broad indicator of economic strength, has not yet reached its high point, which typically precedes market downturns.
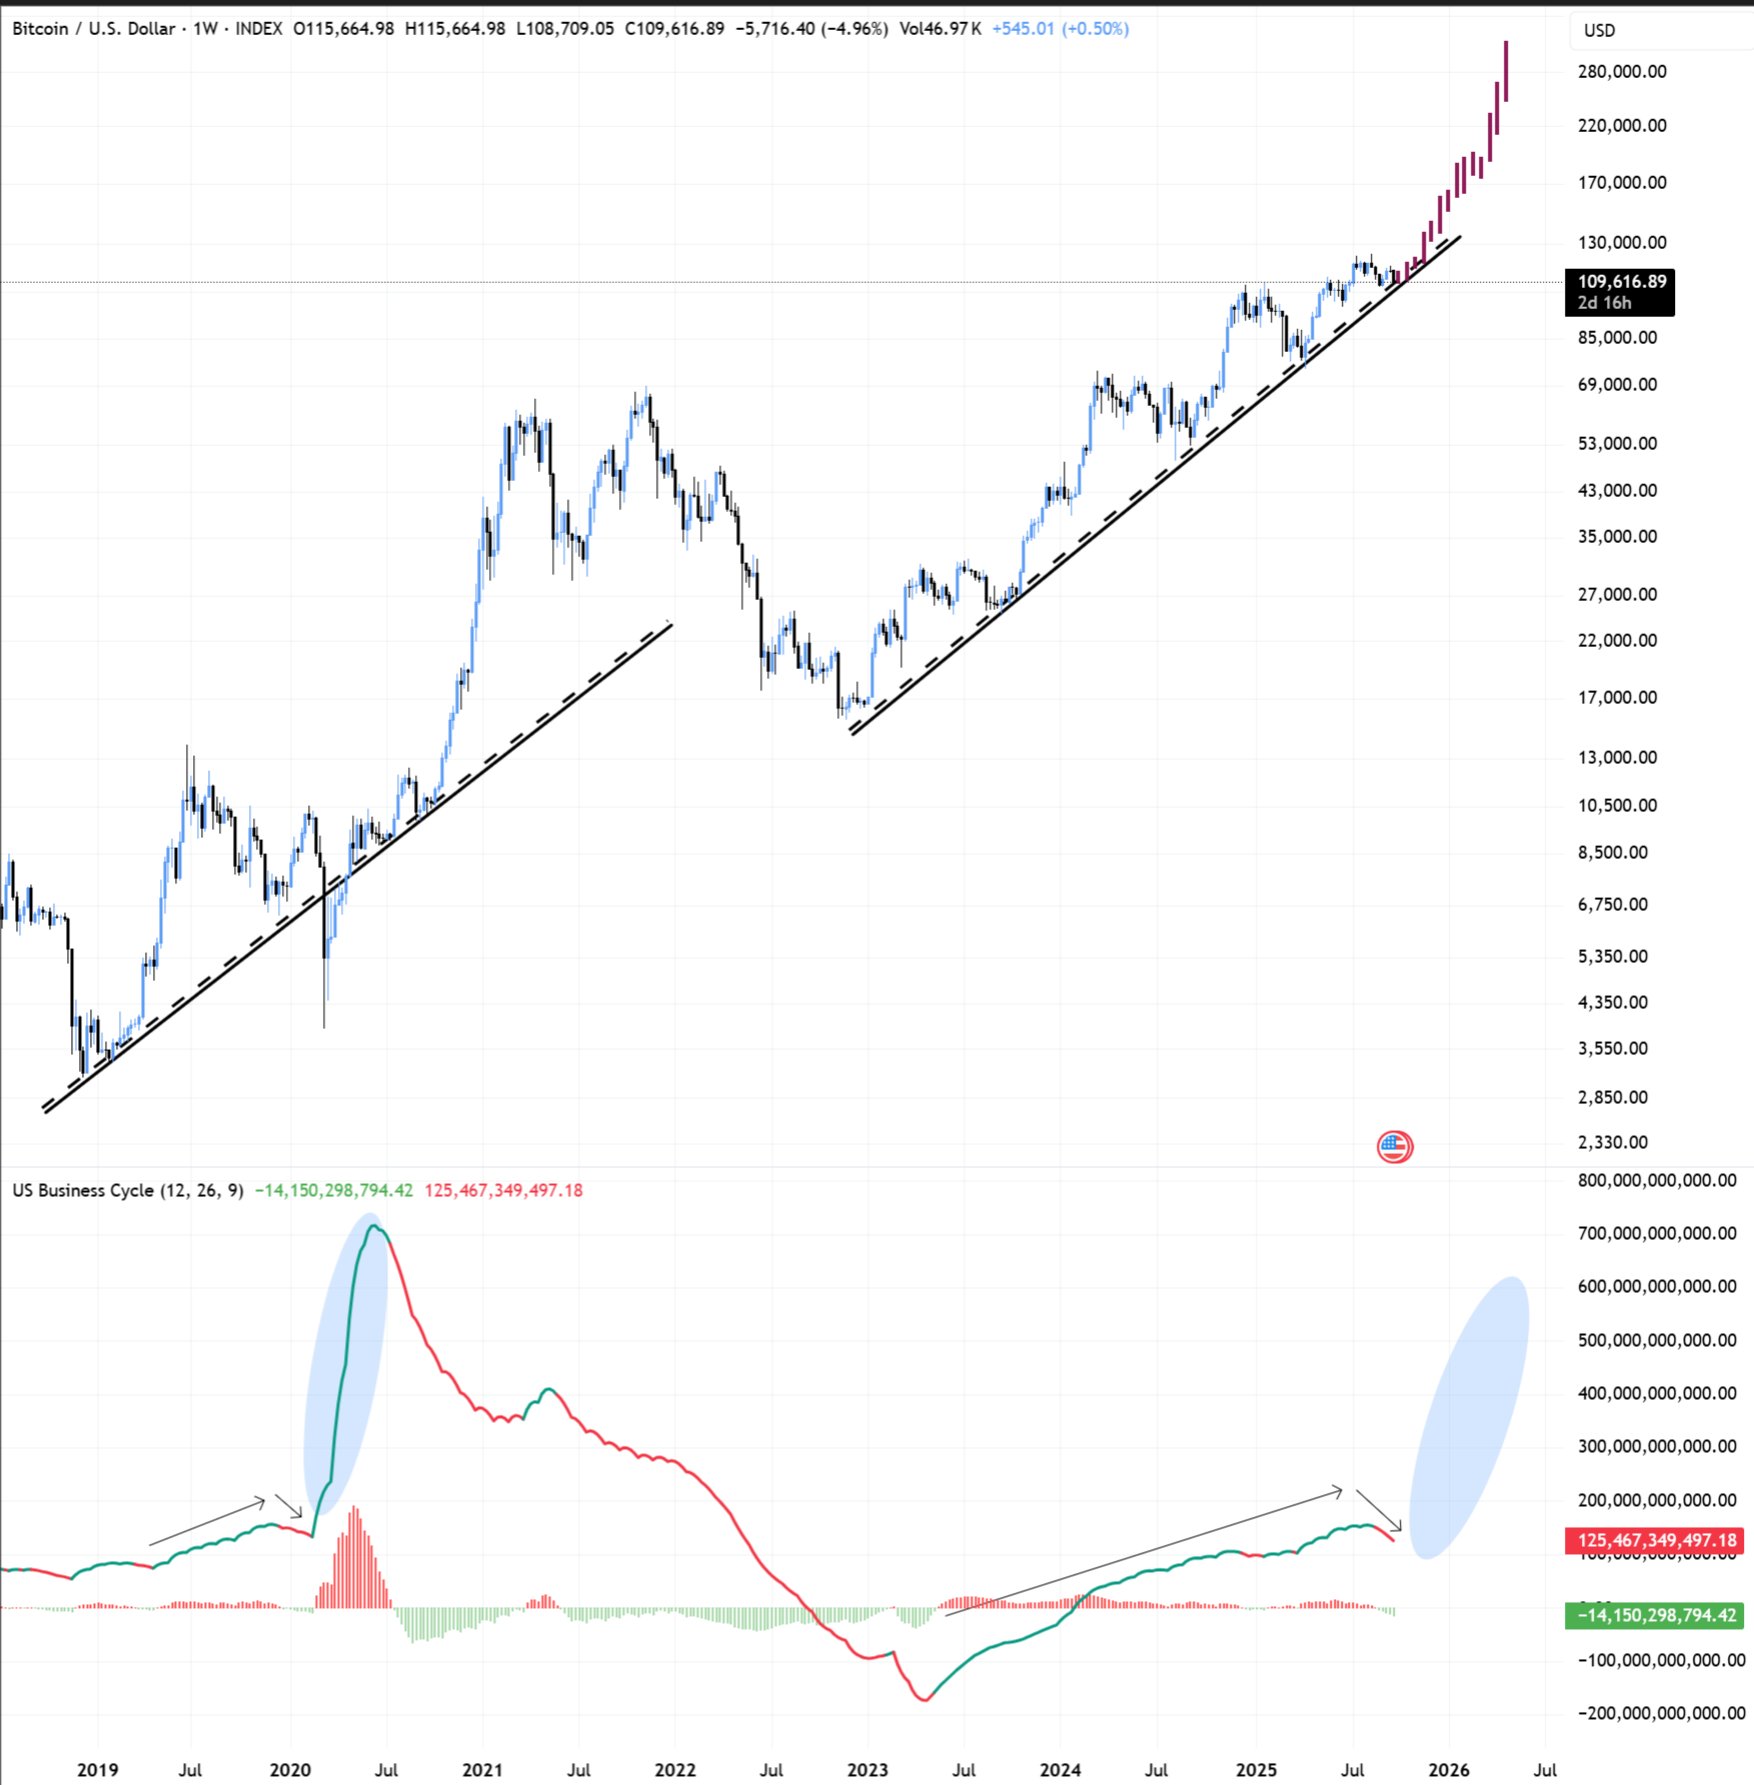
Given the current trend of the Federal Reserve cutting interest rates, Bitbull believes that the crypto market may still have another three to four months of upward movement before potentially reaching a “blow-off top.”
Signs of a continuing bullish trend reinforce the possibility of Bitcoin reaching levels as high as $140,000, according to analyst Captain Faibik.
He suggests that the current dip represents a “healthy correction,” with BTC retesting its 200-day moving average near $104,000, which could serve as potential support.
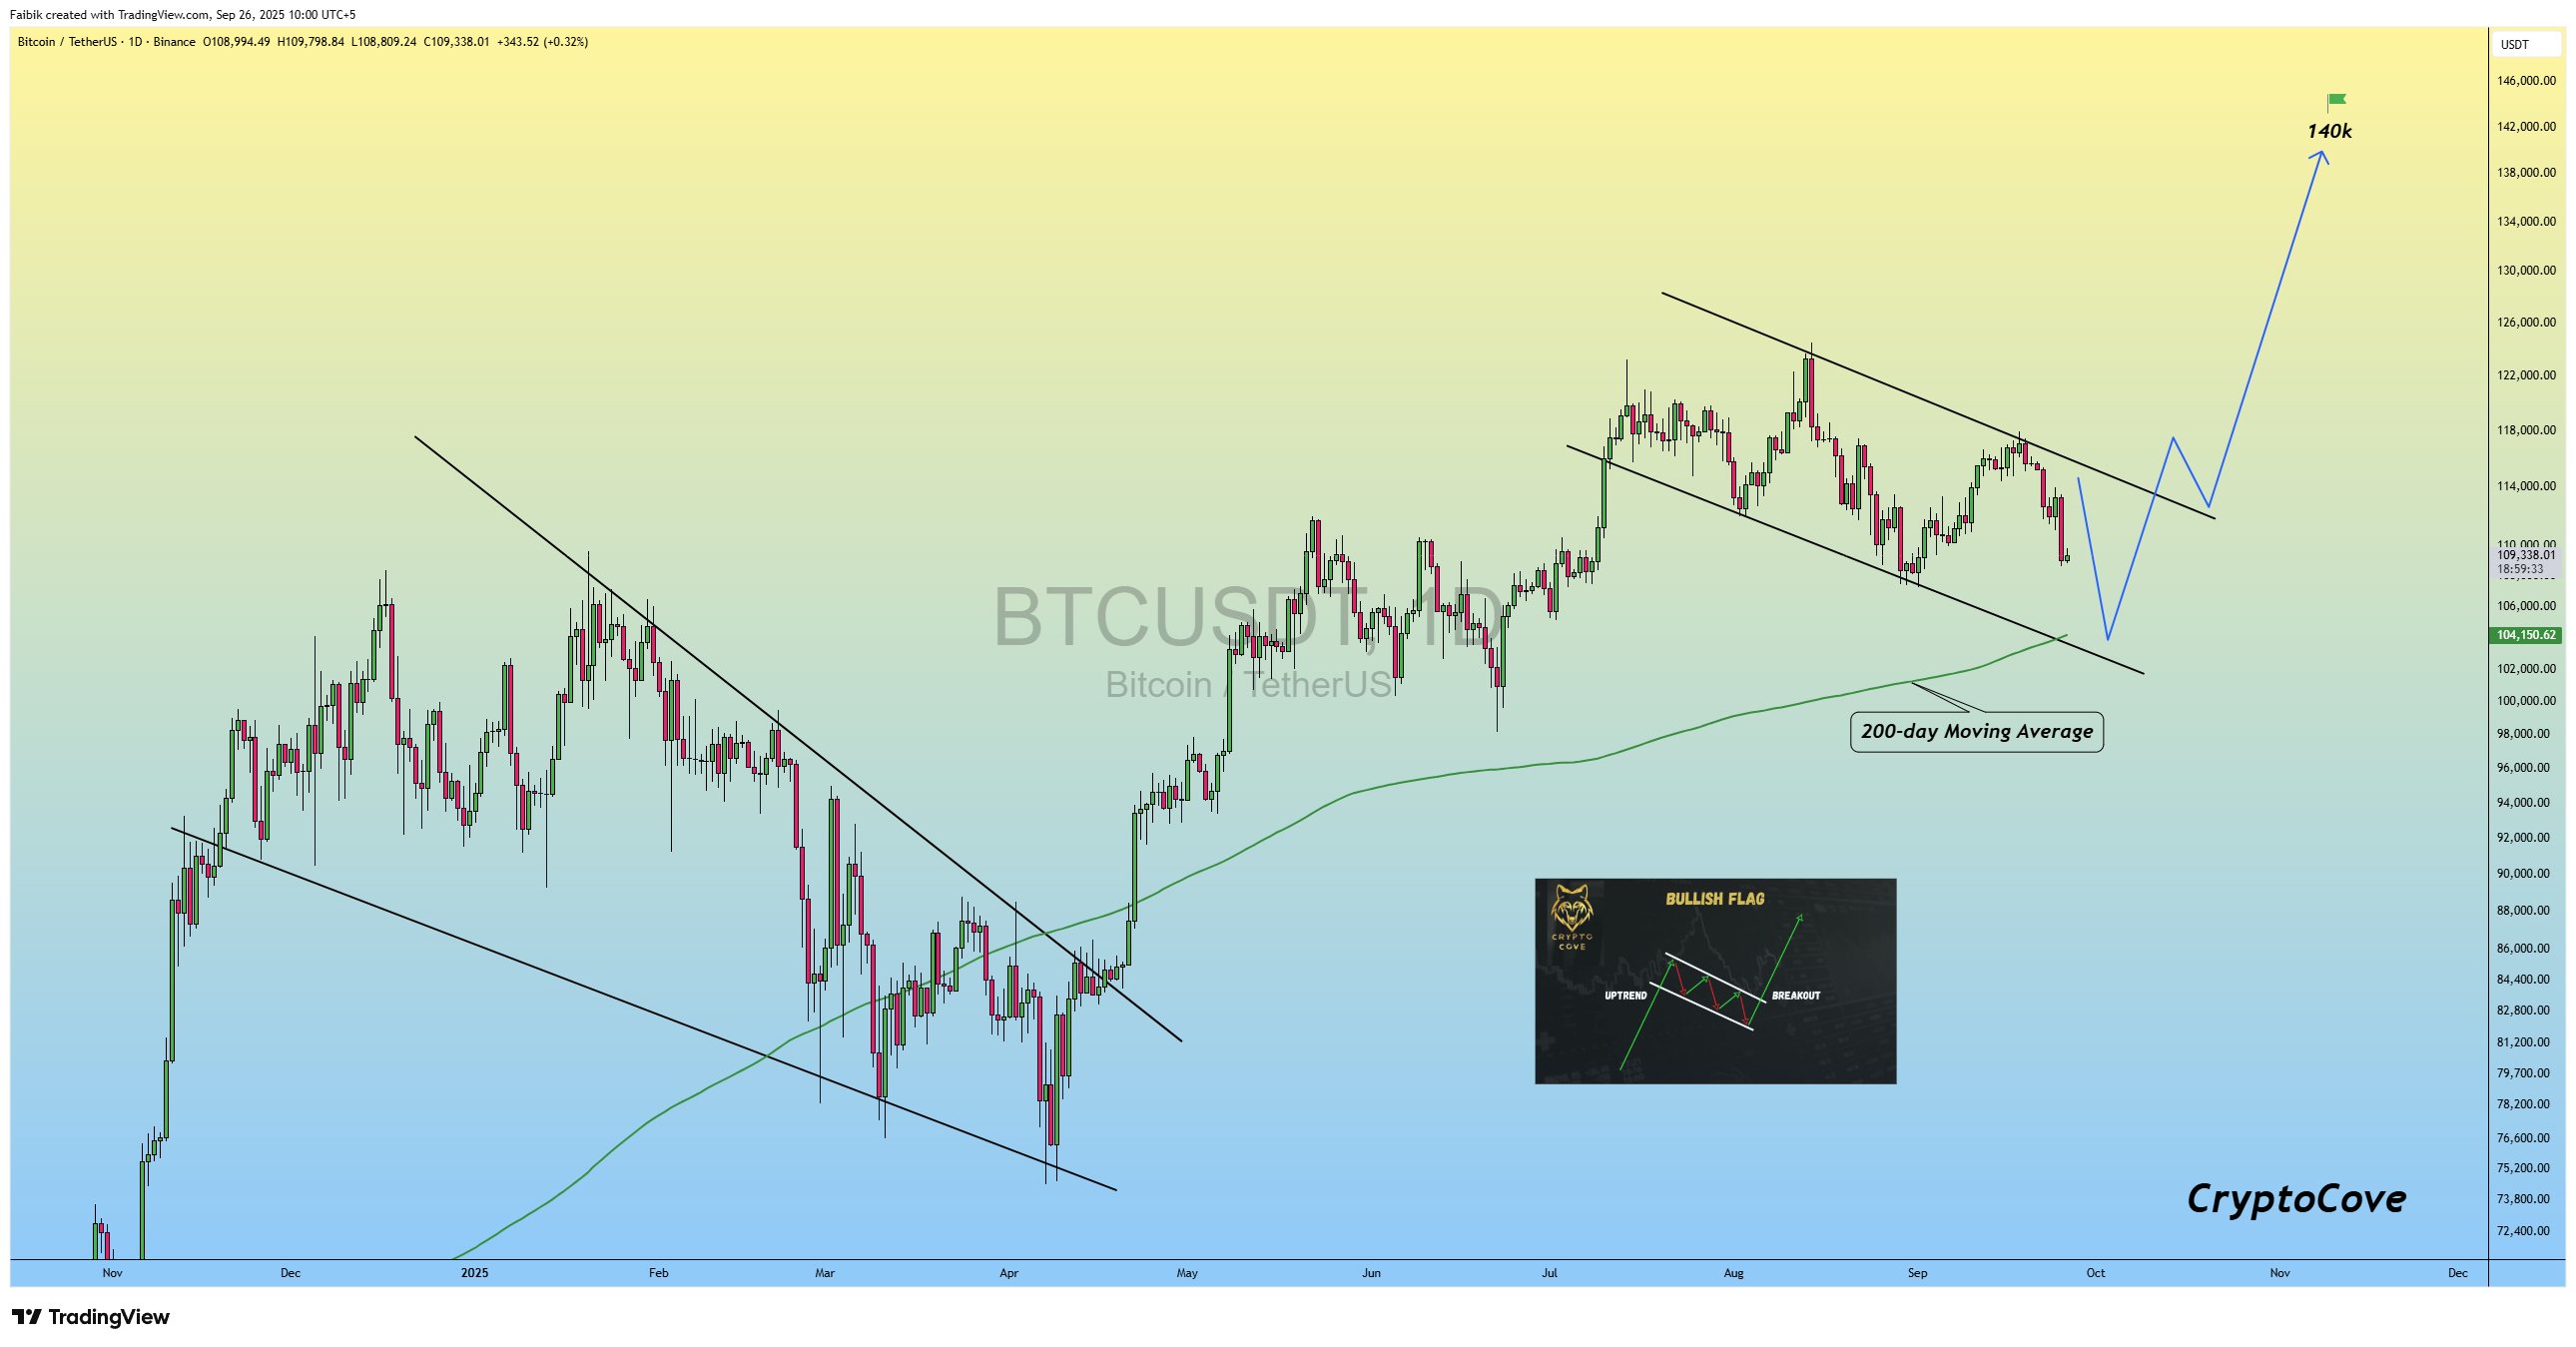
Faibik highlights the potential emergence of a bull flag pattern. In this scenario, a decisive move above the $113,000 resistance area could confirm the breakout, paving the way for a rally towards $140,000 in the coming months.
Many analysts have previously projected similar year-end targets for Bitcoin, while others have even predicted macro BTC tops in the $150,000-$200,000 range.
This information is for informational purposes only and should not be considered financial advice. Investing and trading involve risks, and individuals should conduct their own thorough research before making any decisions.