


The performance of Bitcoin and gold in October has presented contrasting trends, differing from many investor predictions.
Throughout a significant portion of October, Bitcoin and gold followed independent paths. Gold experienced a steady upward trend, increasing by approximately 10% over the past month. In contrast, Bitcoin declined by about 6%.
This divergence is notable, particularly given the timing. The perceived narrative contrasts with the actual market events.
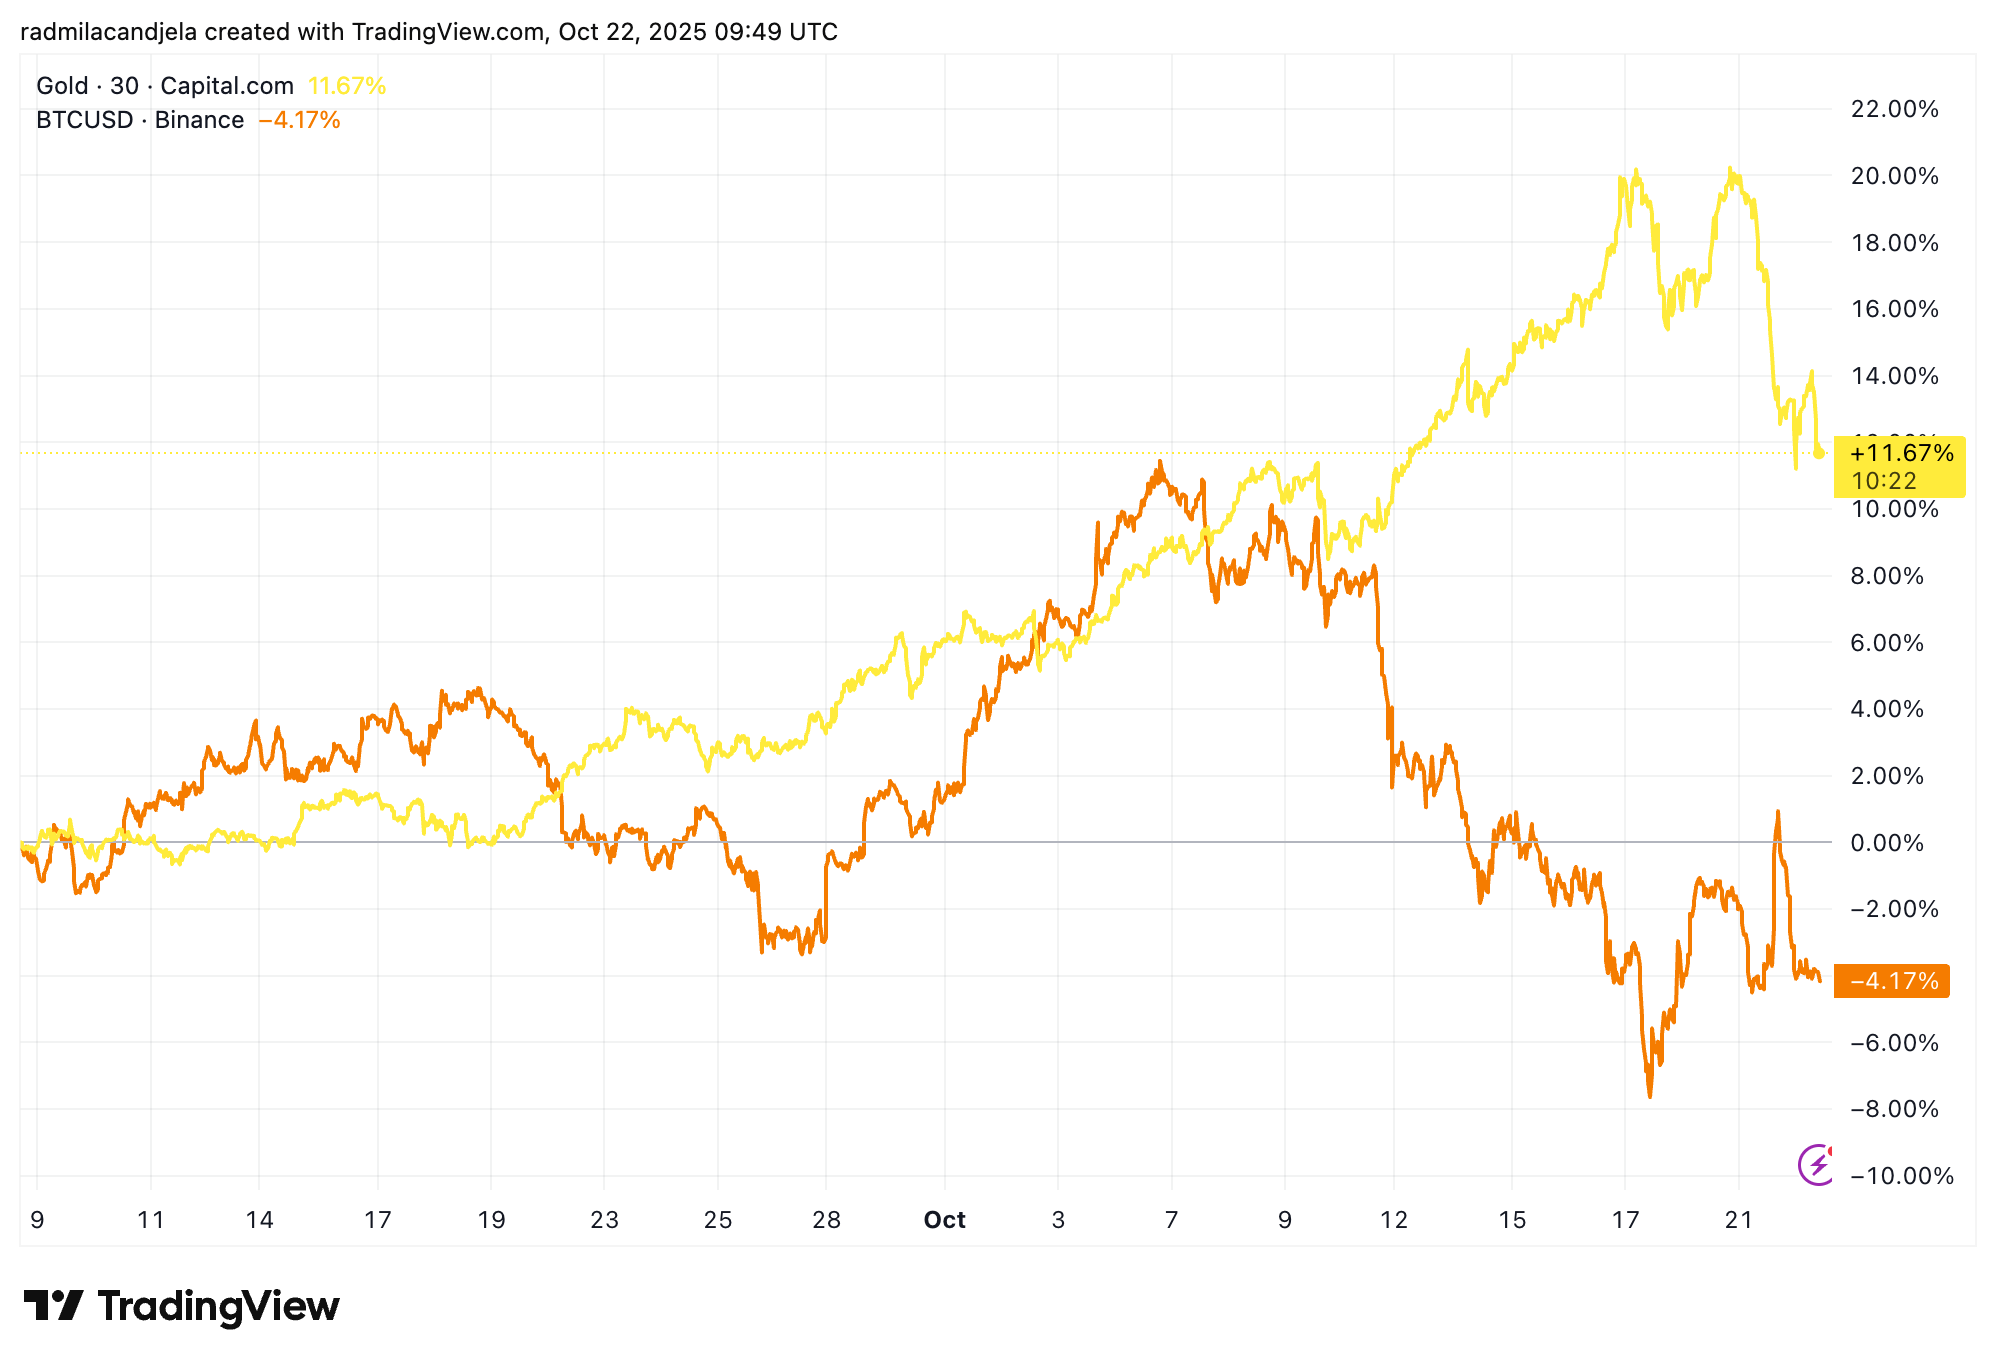
A common interpretation suggests gold declined while Bitcoin rebounded, reflecting a shift between “risk-on” and “safe haven” assets. However, market data reveals a different sequence of events. Gold’s significant drop occurred between October 21st and 22nd, with a decrease of over 5% in a 24-hour period.
Bitcoin did not rally during this downturn; instead, it experienced a drop of approximately 1.5% during the same period. Bitcoin’s actual recovery from weekend losses occurred the day prior, while gold was still experiencing gains.
This timeline challenges the conventional correlation narrative. Rather than Bitcoin rallying as investors exited metals, both assets moved in tandem on October 20th and much of October 21st. The subsequent gold decline appears to be an isolated event specific to the metals market, separate from Bitcoin’s trajectory, and not an inverse trading pattern.
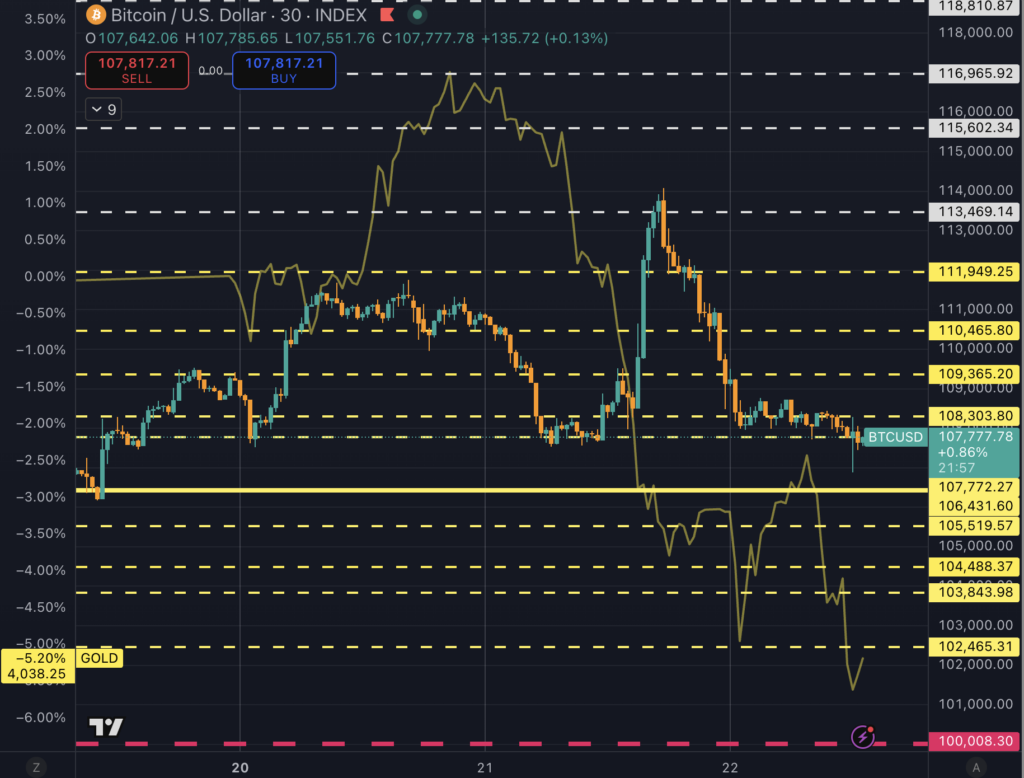
Bitcoin, however, saw a brief rally near the end of October 21st, climbing 5% to $114,000 as gold continued its sell-off. Sadly, this upturn was short-lived, with Bitcoin retreating to $108,000 within 12 hours as gold’s decline persisted.
Key Takeaway: Understanding Bitcoin and Gold as Inflation Hedges
The differing performance underscores the distinct nature of Bitcoin and gold, especially concerning their role as inflation hedges. Gold’s movements are more influenced by interest rates and market liquidity, while Bitcoin’s price fluctuations are largely determined by market positioning and leverage.
Analysis of on-chain data indicates that Bitcoin had already reached a short-term low point by mid-October, following a nearly 17% decline from its peak. Gold’s decline occurred approximately five days later, after investors began reducing positions built up during its earlier rally.
This timing difference is reflected in the low correlation metric of 0.1 between Bitcoin and gold during the month. This weak correlation indicates that the two assets reacted to different market stimuli at different times.
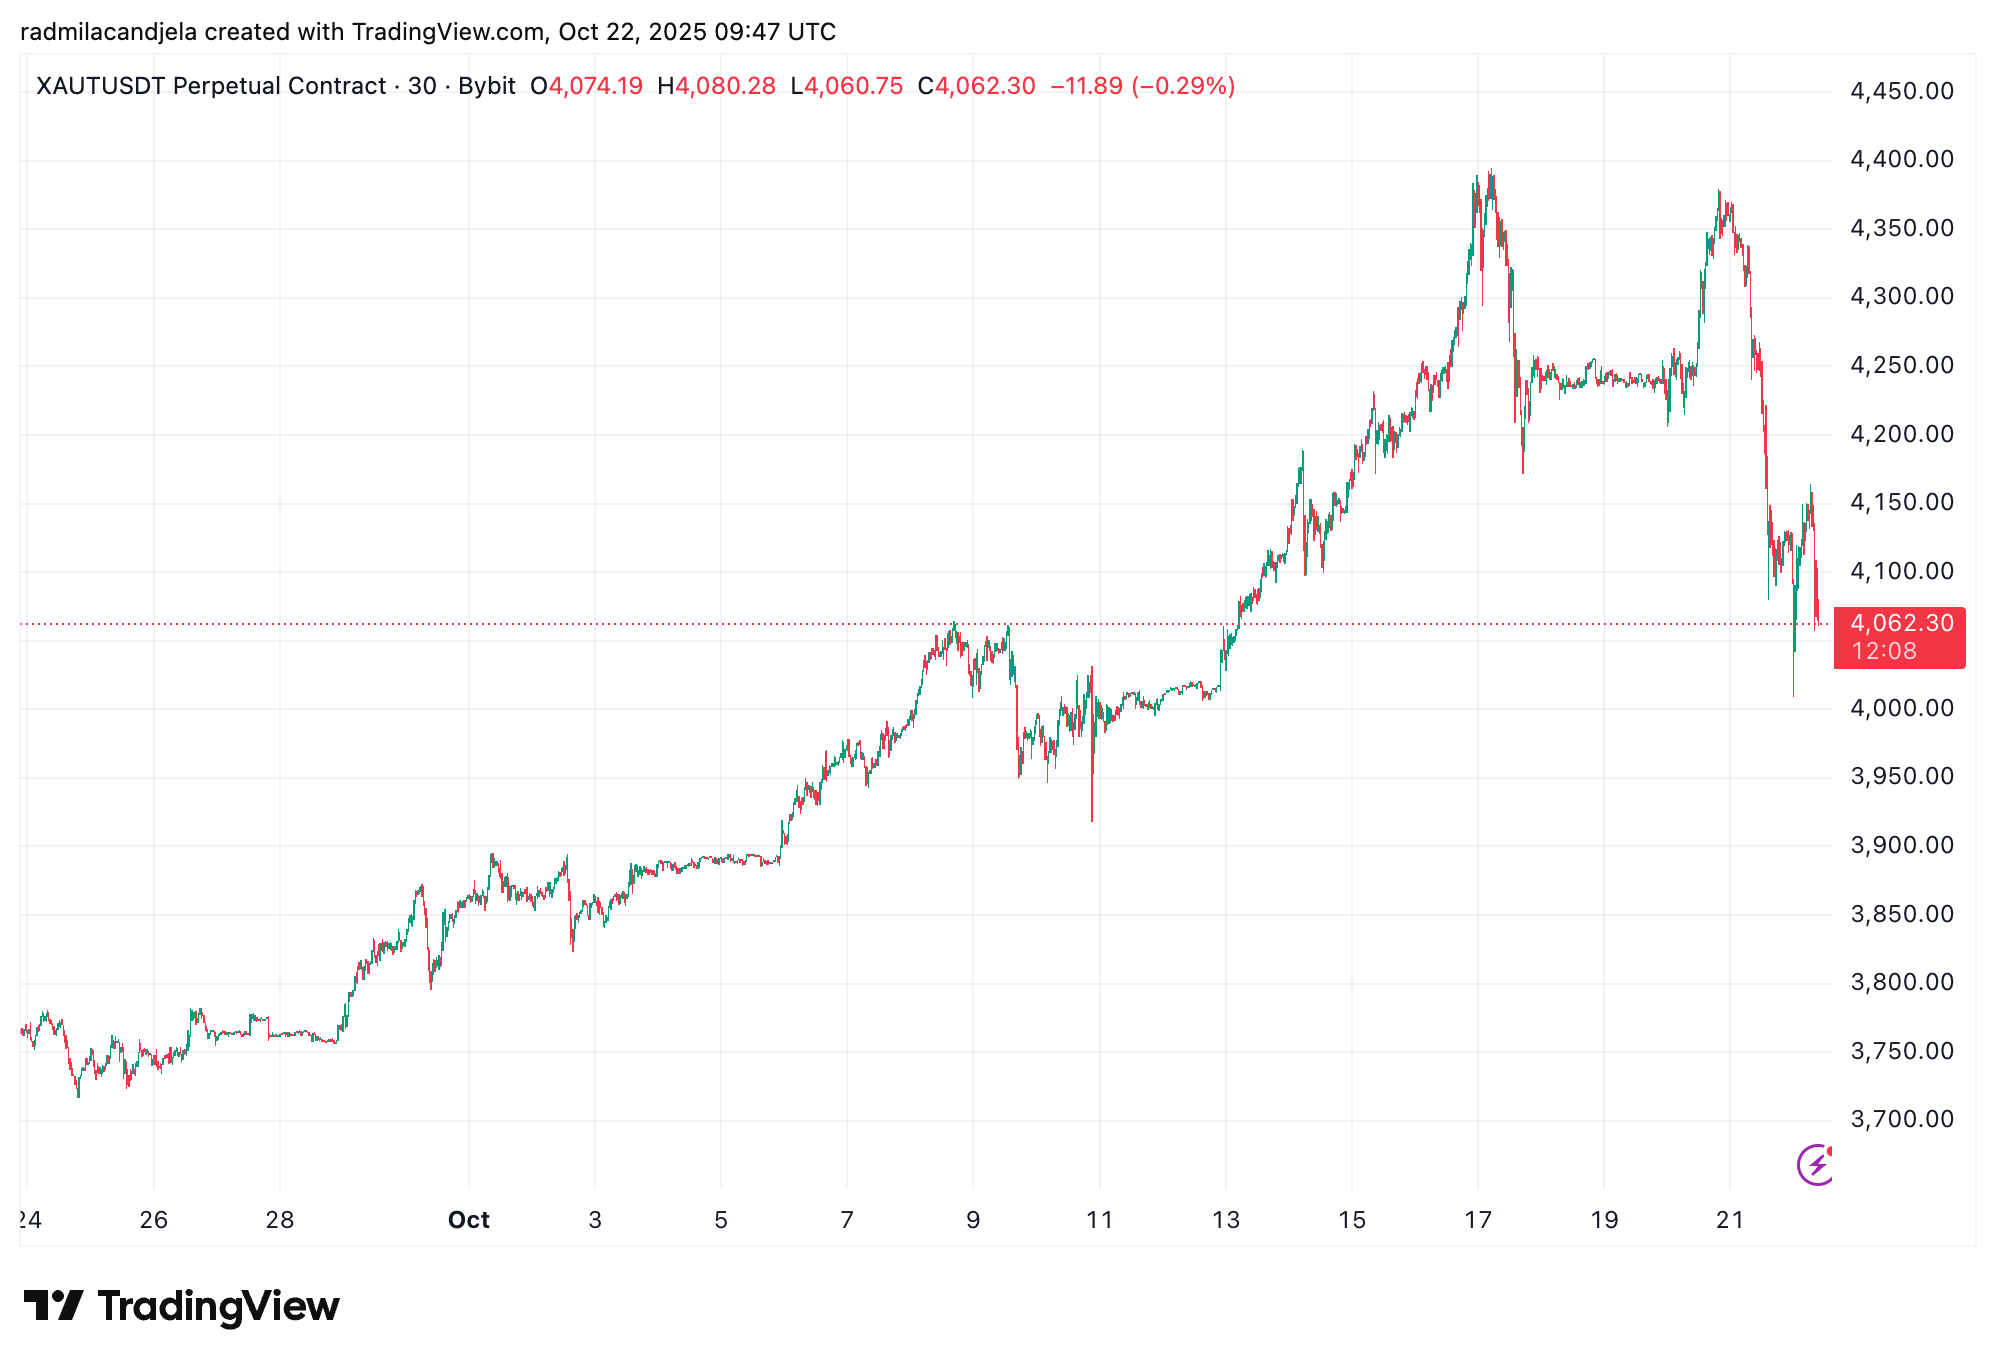
Importantly, the infrastructure supporting gold’s crypto representation remained intact. The Bybit XAUTUSDT perpetual, a gold contract priced in USDT operating 24/7, mirrored the real-world spot price closely. There were no significant deviations, funding pressures, or liquidity issues.
The gold market’s adjustment followed a period of sustained gains, indicating a natural correction. The close tracking observed also demonstrates the efficiency with which tokenized commodities now function within the cryptocurrency ecosystem.
These perpetual contracts offer round-the-clock risk management for collateral and hedging purposes without the complexities of traditional futures contracts.
Bitcoin’s higher volatility led it to react more quickly, reaching its low point before gold began its decline. At the point when gold’s price weakened, Bitcoin had already found support above $100,000. Its beta relative to gold was approximately 0.15, signifying a very weak relationship.
The divergence highlights a critical point: despite the “digital gold” narrative, Bitcoin and gold frequently operate on separate cycles. Gold is reactive to macroeconomic factors like central bank actions and shifts in liquidity.
Bitcoin’s price is driven more by market sentiment, influenced by leverage, ETF flows, and on-chain distribution, which leads to short-term volatility. Moments where both assets respond to the same liquidity events are less common than many believe.
The recent market activity serves as a reminder that observed correlations are highly dependent on the timeframe analyzed. While the assets might appear unrelated in the short term (daily), a shared inflation narrative may reemerge over a longer period (quarterly). However, the split in October demonstrates that this narrative can easily break down when one asset is primarily influenced by traditional financial markets and the other by crypto-specific leverage.
In conclusion, Bitcoin experienced its decline first, followed by gold. This link is chronological. In a market often searching for macroeconomic symmetry, the ability to recognize when two assets cease to move in sync is a potentially valuable strategy.