

Key Takeaways
- Dogecoin experienced a notable increase of 11%, and Solana rose by 10% over the past week, bucking typical crypto market trends for this time of year.
- Anticipation is building for a Federal Reserve interest rate reduction this week, fueled by a moderation in inflation to 2.9%, potentially benefitting higher-risk assets.
- Observations from the Myriad prediction platform suggest growing optimism within the crypto community. Let’s examine the price charts for further insight.
The cryptocurrency market appears to be defying expectations of a historically challenging “Red September.” Alternative cryptocurrencies (altcoins), notably Dogecoin and Solana, are attracting renewed investor interest, indicating a continuing appetite for higher-risk investments.
The Altcoin Season Index has reached a high of 80, its highest level of 2025 to date. Concurrently, the Crypto Fear and Greed Index has increased from 39 to 53 since the start of the month, reflecting a broader increase in bullish market sentiment.
In traditional financial markets, the S&P 500 has risen by 0.85% to 6,587.47, and the Nasdaq has gained 0.72% to 22,043.07, both reaching new all-time highs. This supportive environment for risk assets is further reinforced by market expectations of an 89% probability that the Federal Reserve will lower interest rates at its September 17th meeting.
The Federal Reserve has maintained interest rates in a range of 4.25%-4.50% since December of last year, but financial observers anticipate a rate cut of at least 0.25% at the upcoming meeting. On the Myriad prediction market, operated by Dastan (the parent company of Decrypt), users are forecasting an 88% likelihood of a 0.25% rate reduction.
The combination of a 2.9% core inflation rate and a July unemployment rate rising to 4.2% provides the Federal Reserve with the flexibility to begin easing monetary policy. Such easing could potentially unlock approximately $7 trillion currently held in money market funds, directing it toward riskier assets like stocks and cryptocurrencies.
Let’s examine the current state of the charts:
Dogecoin (DOGE) Price: A Breakout in Progress – Exercise Caution
Dogecoin has demonstrated strong performance over the past week, increasing by more than 11%, which typically correlates with a resurgence of retail investment in the cryptocurrency sector.
However, current indicators suggest a potential correction. DOGE has decreased approximately 5% in the last 24 hours and is currently valued at $0.2649.
Despite this slight downturn today, the overall technical analysis suggests underlying strength.
The Relative Strength Index (RSI) for Dogecoin is currently at 60, which is generally interpreted as a positive sign by traders. The RSI measures the momentum of price changes, with readings under 30 indicating an oversold condition and readings over 70 signaling an overbought condition. An RSI of 60 suggests that DOGE is experiencing strong demand but has not yet reached overbought levels, suggesting potential for further price appreciation.
The Average Directional Index (ADX) for DOGE stands at 26, confirming an environment where a trend is in progress. The ADX measures the strength of a trend, regardless of direction, on a scale from 0 to 100. An ADX reading above 25 signifies that a trend is present, and the recent upward trajectory appears robust enough to be classified as directional.
However, existing price support for the token at around $0.23 indicates that the current correction could lead to additional short-term declines, although this is not yet cause for significant concern for traders.
Exponential moving averages (EMAs) provide traders with insights into price support and resistance, based on price averages over short, medium, and long time horizons.
Analyzing both the 50-day and 200-day EMAs reveals that Dogecoin is currently trading substantially above both averages, with an expanding gap between them. This is described as a “bullish divergence,” which typically occurs during strong uptrends. When shorter-term averages move further away from longer-term averages, it indicates sustained buying pressure across multiple timeframes.
In terms of price action, Dogecoin successfully broke out of its bullish symmetrical triangle pattern, briefly testing support near the 20-day EMA before resuming its upward climb.
Key Levels:
- Immediate support: $0.25
- Strong support: $0.22 (psychological level)
- Immediate resistance: $0.28214 (recent high)
- Strong resistance: $0.30000 (major psychological barrier)
Solana (SOL) Price: “Red September” Who?
Solana is emerging as a standout performer, particularly given that September has historically been a difficult month for digital assets.
SOL has surged nearly 10% since last Monday, currently trading at around $232, boasting a market capitalization exceeding $126 billion.
Today, the token reached a peak of $244.08 before consolidating around its present levels, falling back towards the higher range of an ascending channel that has been forming since early August when the coin entered a “golden cross” pattern.
A golden cross occurs when an asset’s 50-day moving average crosses above its 200-day moving average. This is widely considered a powerful indication of bullish sentiment, demonstrating that prices are accelerating upward over time.
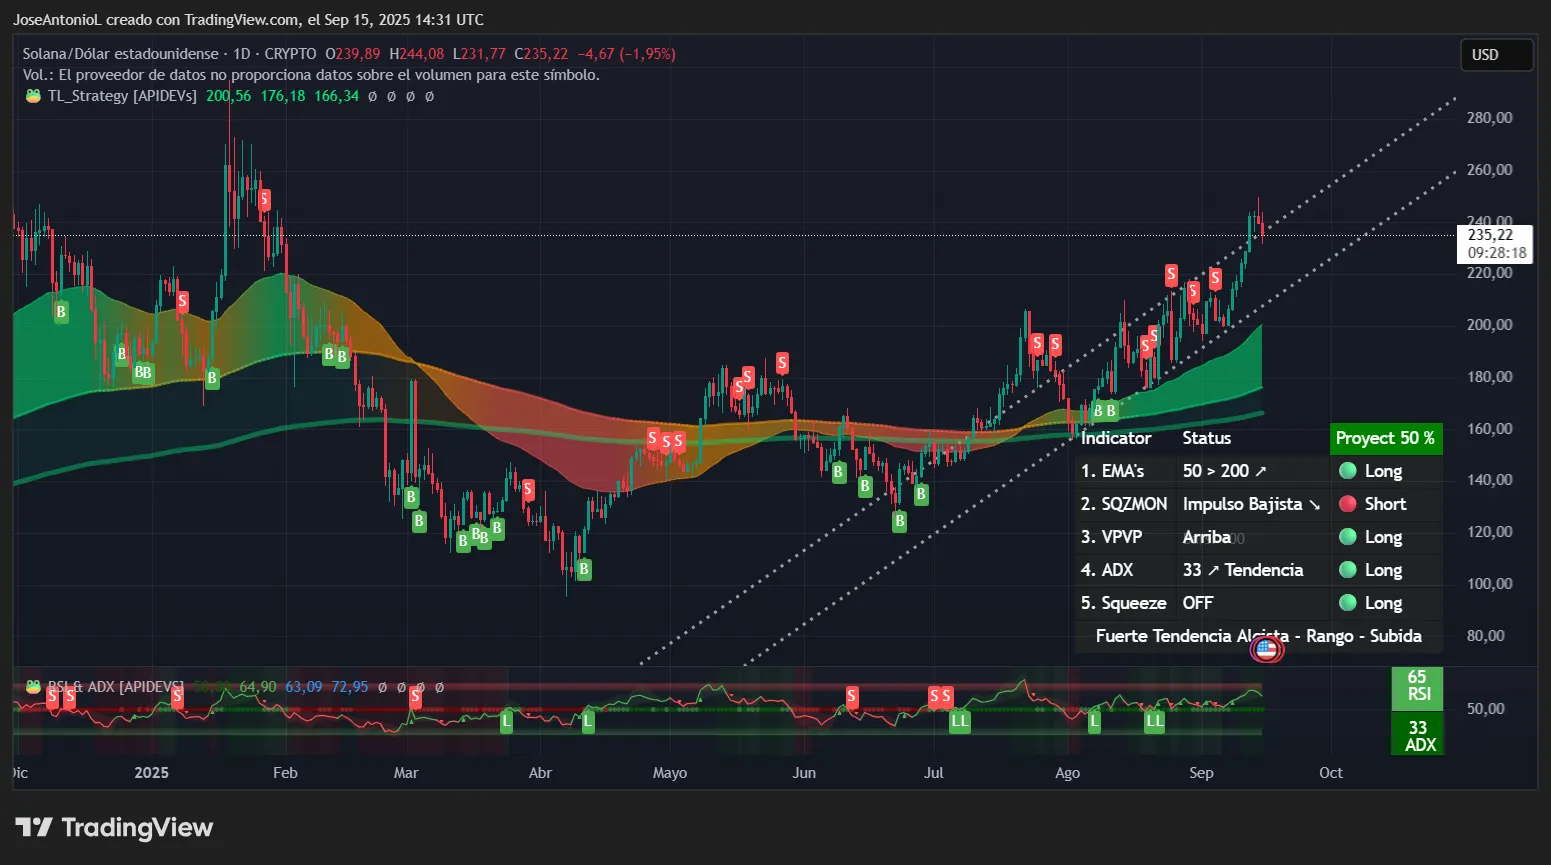
Mirroring DOGE, technical signals for Solana present a generally optimistic outlook, with a slight caveat that a minor correction could be upcoming.
SOL’s RSI is currently 65, displaying considerable buying momentum that is approaching, but hasn’t reached, the overbought threshold above 70. The ADX, at 33, signals exceptionally strong trending momentum. Readings over 30 indicate a robust directional shift that trend-following traders typically seek to exploit. For swing traders, such a high ADX advises maintaining positions in line with the prevailing trend rather than anticipating reversals, due to the tendency of momentum to continue at these levels.
The EMA (the average price of Solana over both the last 50 and 200 days) displays that SOL is trading decidedly above both averages. However, the Squeeze Momentum indicator, utilized to detect trends or price compressions prior to major movements, is showing a bearish inclination, creating an intriguing contradiction in the data.
This conflict between price movement and momentum implies the market is at a pivotal moment—either momentum will align with price (a bullish continuation) or the price will adjust to match momentum (a bearish reversal).
Regardless, we may see a short-term decline in the near future. The overall outlook for SOL, however, remains optimistic in the medium to long term.
That optimistic view is reflected in the changing odds on SOL markets on Myriad. Users now predict a 90% chance Solana reaches $250 before dropping to $130, up roughly 15% since last week. Myriad users also believe it’s probable that Solana will achieve a new all-time high price above $294 this year, putting those odds at 59%, up from 45% last week.
Key Levels:
- Immediate support: $218 (current consolidation)
- Strong support: $207 (support of the channel)
- Immediate resistance: $244.08 (recent high)
- Strong resistance: $260.00 (psychological target)
Disclaimer
The views and opinions expressed in this analysis are for informational purposes only and should not be construed as financial advice.
Daily Debrief Newsletter
Kickstart your day with the latest news, insightful articles, podcasts, videos and more.