

- Bitcoin surges back above the vital $80,000 threshold on Thursday.
- Gold continues its upward trend for the second consecutive day, bolstering a short-term bullish outlook aiming for $4,600.
- The latest US ISM report indicates an increase in Services PMI to 55.4 for August, up from 54.1 in July, exceeding expectations.
On Thursday, Bitcoin (BTC) made significant gains, trading above the crucial $80,000 mark. This uptick in the leading cryptocurrency follows favorable trends in the broader digital asset market after the US Services PMI data was released.
Gold (XAU/USD) is also on a positive trajectory, hovering around $4,500 at the moment. The precious metal has risen by over 2% for the day, indicating a resurgence of bullish sentiment.
August Sees Improvement in US ISM Services PMI
The recent data from the US Institute for Supply Management (ISM) reveals that the Services PMI improved to 55.4 in August, a rise from July’s 54.1, outpacing the anticipated figure of 54.3. This development reflects increasing momentum within the sector.
Inflationary pressures grew as indicated by the ISM Prices Paid Index (PPI), which increased to 72.6 from 70.3. Furthermore, the Employment Index experienced a slight uptick, rising to 47.8 from 47.4. Business activity also accelerated, evident by the New Orders Index climbing to 60.9 from 57.2.
This enhanced ISM Services PMI comes amid a backdrop of diminishing inflation in July, following a slight decrease in the Consumer Price Index (CPI), while the Personal Consumption Expenditures (PCE) data remained steady from the prior month. This indicates the resilience of the US economy despite persistent inflationary challenges.
US inflation continues to hover well above the Federal Reserve’s (Fed) target of 2%. This situation has prompted policymakers to exercise caution, especially considering ongoing tensions in the Middle East and the lingering effects of US tariffs.
Technical Analysis: Bitcoin Gains Above $80,000
Bitcoin is currently priced at $80,861, extending its upward movement well beyond key Exponential Moving Averages (EMAs). The 50-day EMA stands at $70,713, the 100-day EMA is around $69,463, and the 200-day EMA sits at $72,492, all offering significant support below the current trading level. This arrangement suggests a bullish outlook in the near term, although the Relative Strength Index (RSI) at 72.35 is nearing overbought territory, and the Moving Average Convergence Divergence (MACD) is retreating towards the zero line, indicating that upward momentum might be waning following the recent rally.
Immediate demand is noted in the current price range, with initial support levels aligning near the 50-day EMA at $70,713 and the 200-day EMA at $72,492, followed by deeper support found at the 100-day EMA close to $69,463 during broader corrections.
Maintaining prices above these EMA levels means any pullback towards this support zone would likely be viewed as a temporary dip within a continuing uptrend. However, sustained selling pressure that pushes prices below the $70,000-$72,000 range could start to undermine the current bullish structure.
Gold Technical Analysis: XAU Grows Recovery Strength
Gold is trading near $4,500 and holds a positive near-term outlook as it remains above the 50-day, 100-day, and 200-day EMAs, which are closely positioned between approximately $4,318 and $4,366. The price is advancing toward the descending trendline resistance near $4,540, with momentum appearing favorable.
At the same time, the RSI at 56 resides in neutral-to-positive territory, while the MACD remains negative yet shows signs of diminishing bearish pressure after the recent downturn.
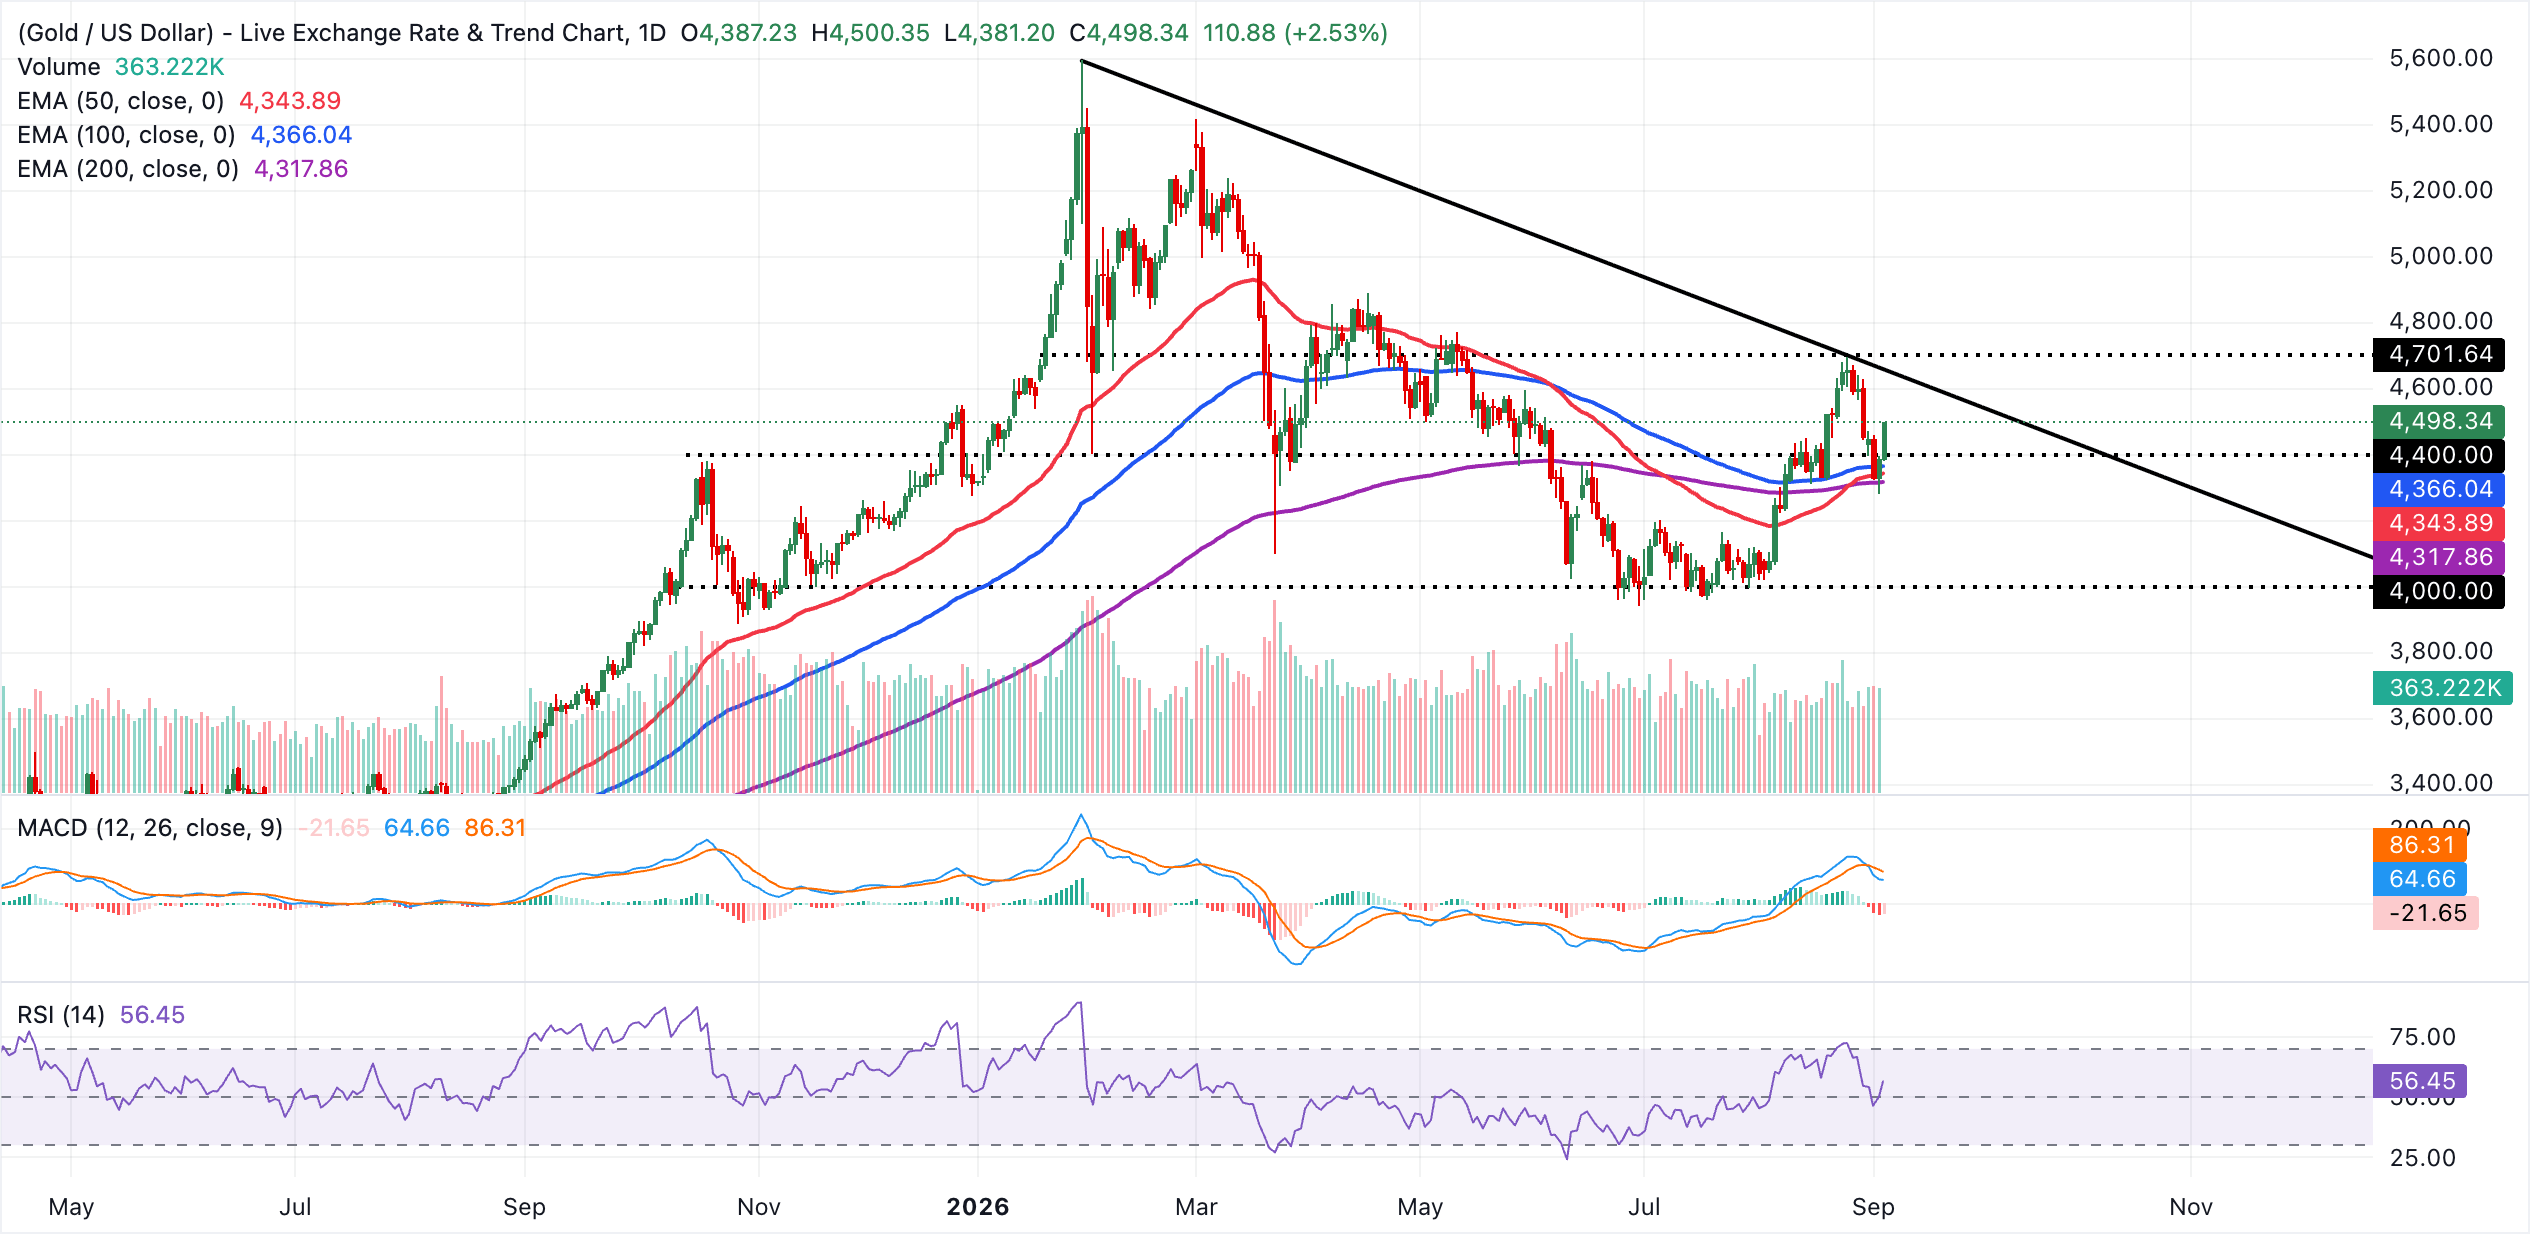
Immediate buy interest is located at the 100-day EMA around $4,366, followed by the 50-day EMA at $4,344, and then the 200-day EMA at $4,318, collectively forming a broad support area that reinforces the uptrend. On the upside, the next challenge is the downward trendline resistance at $4,540.47. Successfully breaking above this level could lead to additional gains, whereas failure to do so could trigger a correction back towards the EMA support cluster.
(This technical analysis was crafted with support from an AI tool. Learn more.)
Bitcoin, Altcoins, and Stablecoins FAQs
Bitcoin is recognized as the largest cryptocurrency by market capitalization, functioning as a decentralized digital currency. It is designed to operate independently of any single entity, eliminating the need for intermediaries during transactions.
Altcoins refer to all cryptocurrencies excluding Bitcoin. However, some consider Ethereum as distinct due to its significant role in forking from Bitcoin. Litecoin is often recognized as the first altcoin, having been derived from Bitcoin’s protocol as an ‘enhanced’ version.
Stablecoins are cryptocurrencies engineered to maintain a stable price, with their value typically tied to a reserve of the asset they represent. This pegs their worth to commodities or financial instruments, such as the US Dollar (USD), while their supply is managed by an algorithm or demand. The primary objective of stablecoins is to facilitate transactions for investors looking to engage with cryptocurrencies, while also providing a safe storage option given the overall market volatility.
Bitcoin dominance represents the proportion of Bitcoin’s market cap compared to the total market cap of all cryptocurrencies combined. It offers insights into Bitcoin’s popularity among investors. Typically, high BTC dominance is observed preceding and during market uptrends, where investors favor stable, high-cap cryptocurrencies like Bitcoin. Conversely, a decline in BTC dominance indicates that investors are reallocating their funds towards altcoins seeking greater returns, often leading to significant altcoin rallies.