

Anticipation is building around Cardano (ADA), with projections suggesting a significant price surge in the near future. This optimism is fueled by increasing probabilities of the Securities and Exchange Commission (SEC) giving the green light to the Grayscale ADA Fund in October. Moreover, technical indicators, including analysis of the Ichimoku Cloud and Murrey Math Lines, currently present a strong bullish outlook for ADA’s price trajectory.
Cardano Primed for Potential Boost from Forthcoming ADA Exchange-Traded Fund (ETF)
A key factor potentially influencing Cardano’s value is the growing expectation that the SEC might approve several cryptocurrency ETFs.
A significant event occurred recently when the SEC approved broader standards for listing alternative cryptocurrencies, paving the way for quicker introductions of crypto-based investment funds. A primary requirement for these funds is the presence of a Coinbase futures product, a condition Cardano meets.
The SEC has designated October 22 as the decisive date for potentially approving the Grayscale ADA ETF. Data from Polymarket indicates an 87% likelihood that the regulatory body will authorize this ETF on or before this date.
The potential approval of a Cardano ETF gains credibility from the SEC’s prior approval of multiple spot Ethereum ETFs, involving prominent firms such as Franklin Templeton and BlackRock. Furthermore, Cardano’s status as a prominent cryptocurrency project originating from the United States could contribute to a favorable outcome.
For Cardano, the ETF approval would be very helpful. The Cardano blockchain network has struggled in recent years.
In contrast to networks like Solana, Sui, and Sei, Cardano’s ecosystem has faced challenges in attracting significant decentralized applications. Additionally, it currently holds a limited market share within the stablecoin sector.
ADA Price Prediction: Ichimoku Analysis Suggests Positive Momentum
A technical assessment of Cardano’s daily price chart reveals an optimistic ADA price forecast extending into 2025.
The chart illustrates the formation of a substantial double-bottom pattern around $0.5025, representing price lows observed in April and June of the current year. This pattern typically signals a forthcoming bullish reversal, explaining the price rebound seen in recent weeks.
Cardano’s price remains above the double-bottom pattern’s neckline, located at $0.8650, which marked its highest point in May. Adding to the bullish signals, the price has surpassed the Ichimoku Cloud indicator, suggesting that buyers are in control.
The ADA price also formed a golden cross pattern on July 22nd and has remained above the two moving averages. It’s also holding above the pivot reverse on the Murrey Math Lines tool.
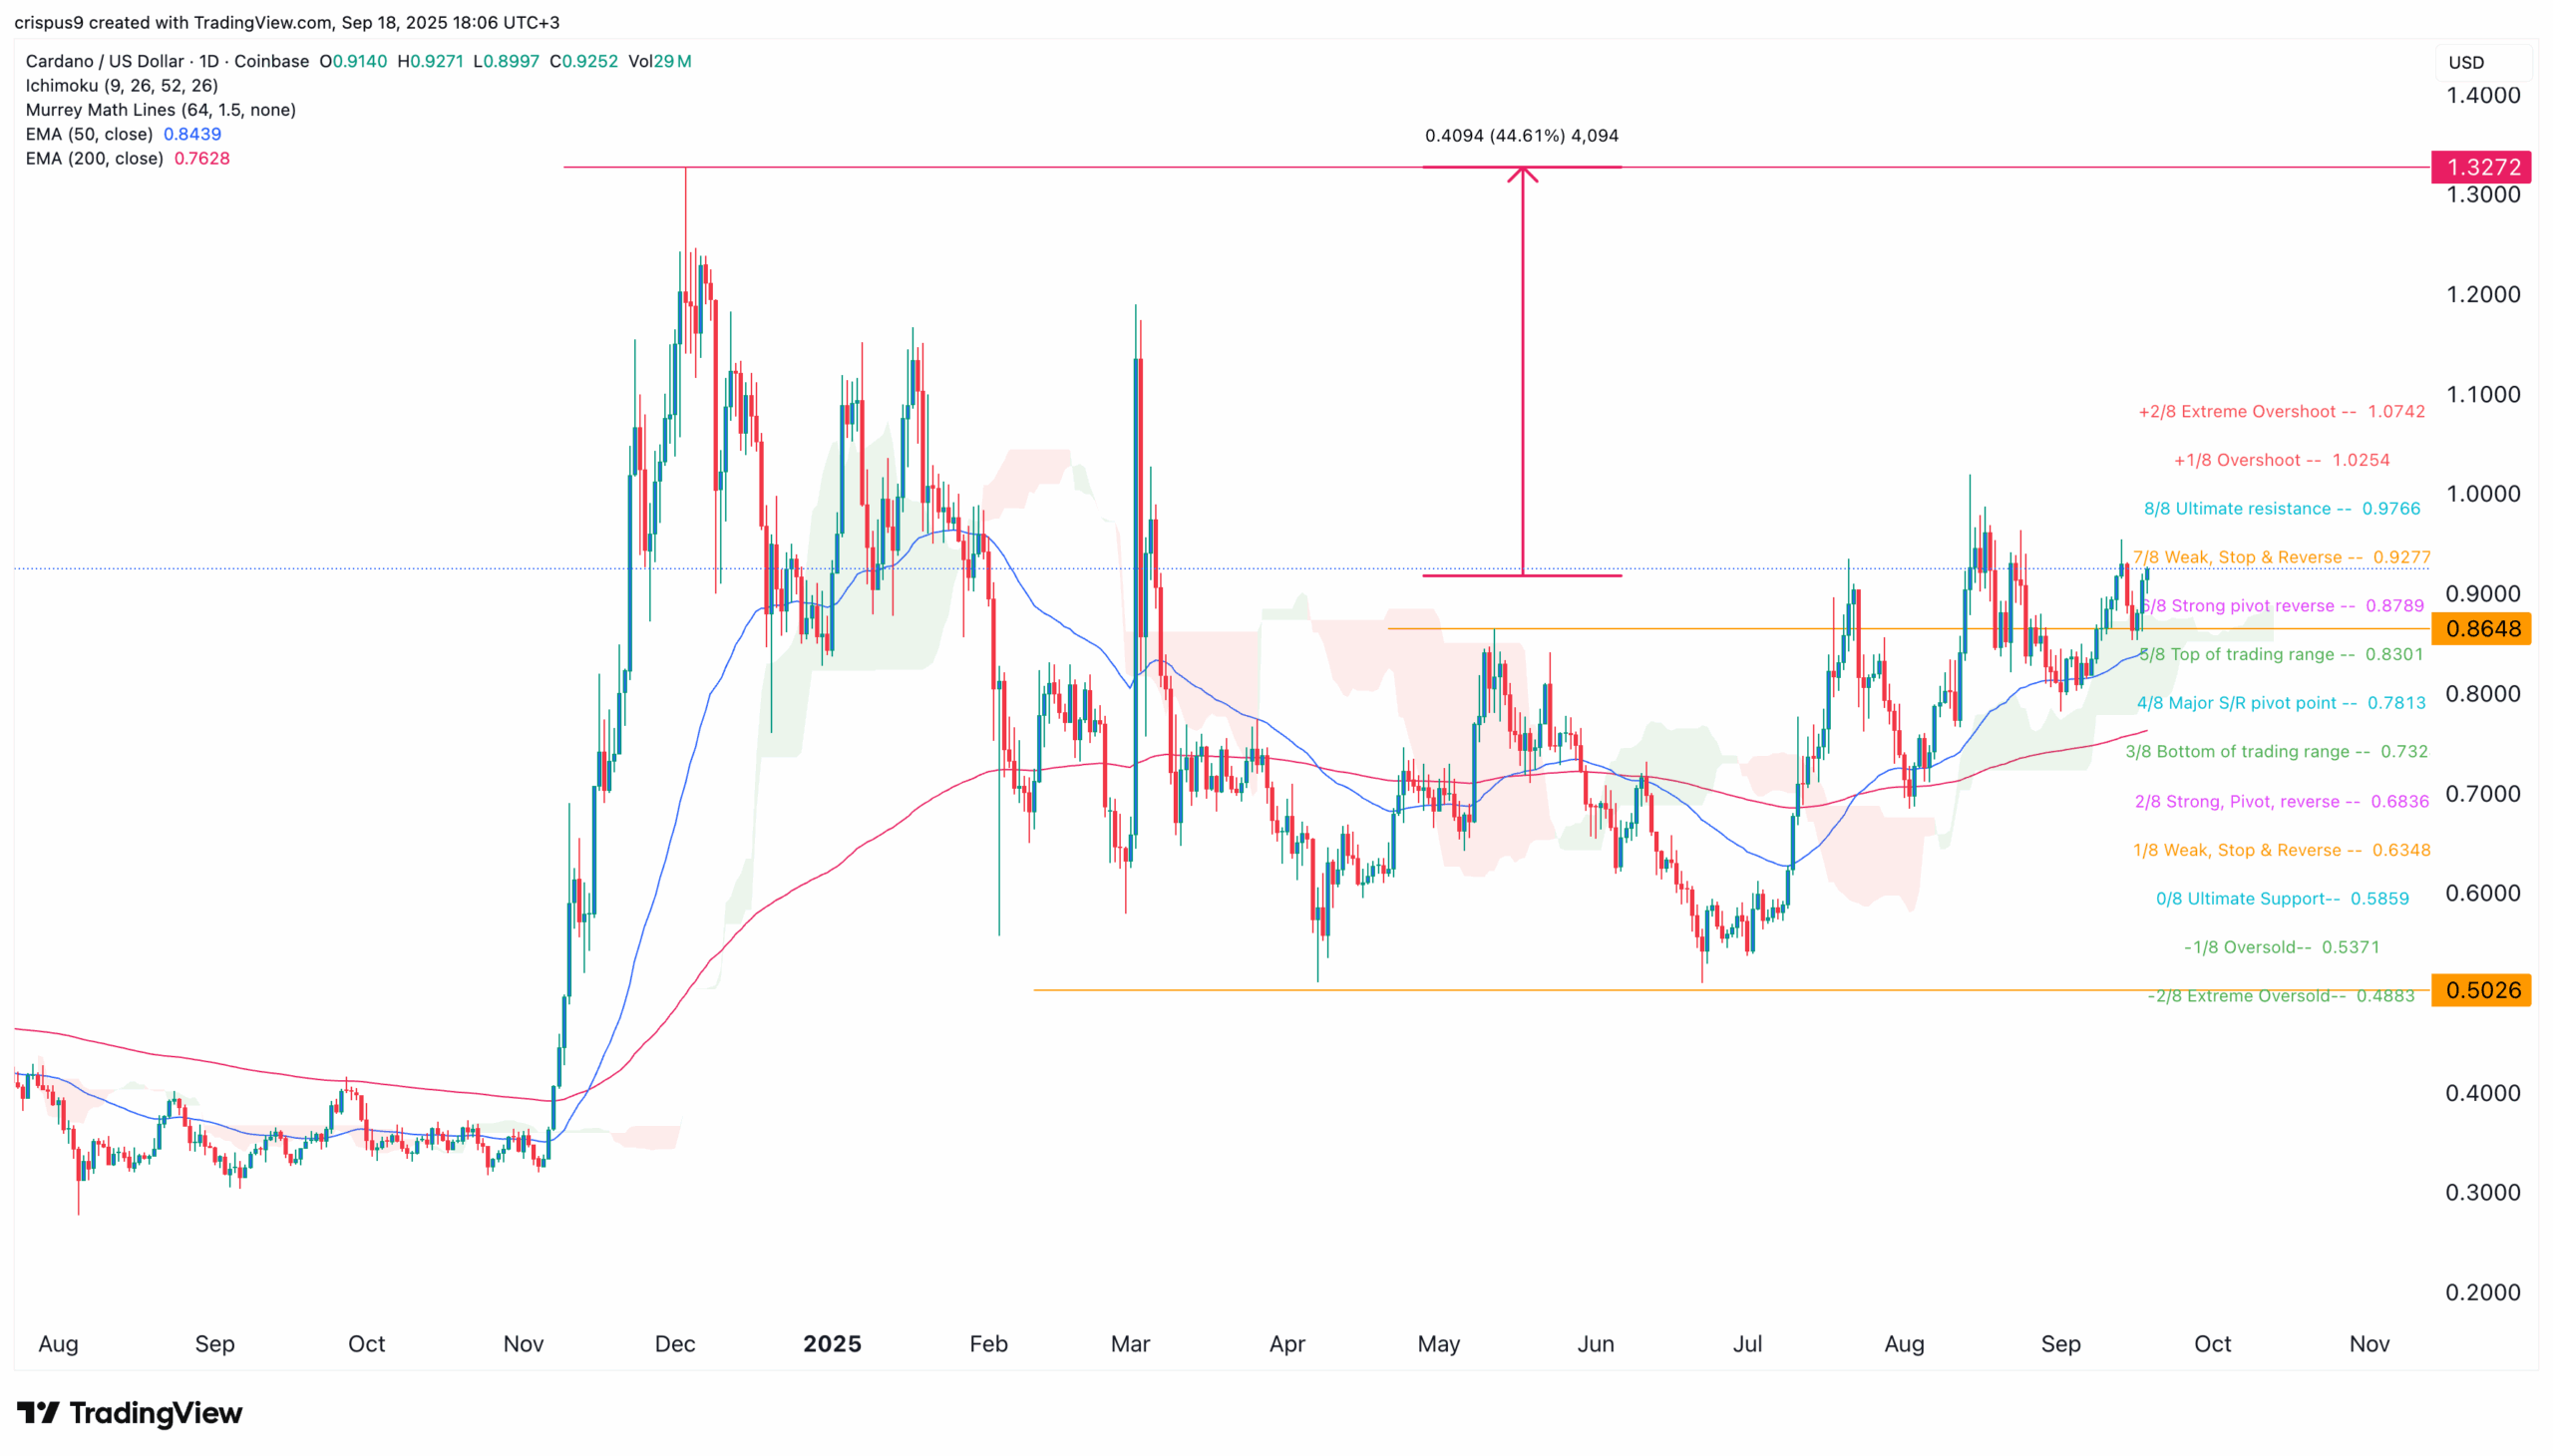
Consequently, the price could continue its upward trend, potentially reaching a key resistance level around $1.3272, the peak seen in December of the prior year – representing an increase of approximately 45% from current levels. Conversely, a drop below the support level of $0.8300 would negate this positive forecast.