

- Bitcoin price action remains steady above a key support level as market participants await crucial inflation figures from the US.
- Ethereum demonstrates notable momentum, boosted by record-breaking inflows into its spot ETFs, surpassing the $1 billion mark.
- XRP price holds firm above the $3.00 threshold, with stable funding rates suggesting resilience and a potential price surge on the horizon.
The cryptocurrency market displays widespread consolidation this Tuesday, with all eyes on the impending release of the Consumer Price Index (CPI) data from the United States. Bitcoin (BTC) is currently maintaining its position above a significant support zone, located between $117,000 and $118,000, following a notable push to $122,335 observed on Monday.
Concurrently, Ethereum (ETH) is exhibiting a strong, positive trend, trading just shy of $4,300, as buyers aim to surpass its all-time high of $4,878, recorded back in November 2021. Meanwhile, Ripple (XRP) is fluctuating around $3.11, with its support level at $3.00 proving robust.
Market Outlook: Deciphering the Impact of US Inflation Data
Later today, the Bureau of Labor Statistics (BLS) will unveil the latest US CPI figures, following the recent implementation of higher tariffs initiated earlier in the month.
Market forecasts indicate a modest 0.2% increase in monthly inflation for July, and a 2.8% increase when looking at the year-over-year figure. The core CPI, which excludes the more volatile food and energy sectors, is projected to climb by 0.3% month-over-month, and 3% compared to last year.
Inflation within the US demonstrated an upward trajectory in June, with the CPI rising by 2.7% annually, an increase from the 2.4% recorded in May. Core inflation, when excluding food and energy expenses, experienced a 2.9% rise over the past 12 months as of June.
The inflation data has the potential to significantly impact market expectations regarding potential interest rate cuts during the Federal Reserve’s (Fed) September meeting. While investors are currently anticipating a rate reduction next month, mounting evidence that tariffs are affecting prices could dampen those expectations. The Fed has already postponed interest rate cuts this year, citing the influence of higher tariffs on inflation.
In the cryptocurrency arena, investors are likely to proceed cautiously, mindful of the potential for increased volatility. Given Bitcoin’s recent retreat from its weekly high of $122,335, market participants may be looking for a rebound above $120,000, potentially targeting the record peak of $123,218 achieved on July 14, should the inflation data prove favorable.
Data Insights: Ethereum ETFs See Inflows Reach $1 Billion Milestone
Ethereum spot Exchange Traded Funds (ETFs) prolonged their positive surge on Monday, registering inflows of $1.02 billion on average, the highest single-day amount recorded to date. Data from SoSoValue shows that BlackRock’s ETHA ETF led the way among US-based spot ETFs, attracting $640 million in new investments, closely followed by Fidelity’s FETH ETF with $277 million.
Ethereum spot ETF data | Source: SoSoValue
Bitcoin spot ETFs operating within the United States also saw inflows increase on Monday, reaching $404 million, pushing the total cumulative net inflow up to $54.4 billion. The total net assets average $151 billion at the time of this report.

Bitcoin spot ETF data | Source: SoSoValue
Regarding XRP, investor interest seems to be stable, based on the futures weighted funding rate, which currently averages around 0.0086%. This level is considered healthy; rates exceeding 0.05% often indicate an impending price correction. Stable funding rates suggest that a greater number of traders are engaging in long positions, anticipating the price will sustain its current upward trend.

XRP Futures Weighted Funding Rate | Source: CoinGlass
Chart Analysis: Bitcoin Retesting a Crucial Support Zone
Bitcoin’s price shows signs of weakness in the shorter-term, trending downwards to test the support range located between $117,000 and $118,000. The Relative Strength Index (RSI), which is dropping toward the midline on the 8-hour chart after peaking in overbought territory around 72 on Monday, implies a lessening of buying pressure.
Traders might continue to reduce risk exposure or initiate short positions on Bitcoin if the RSI continues its decline below the midline.
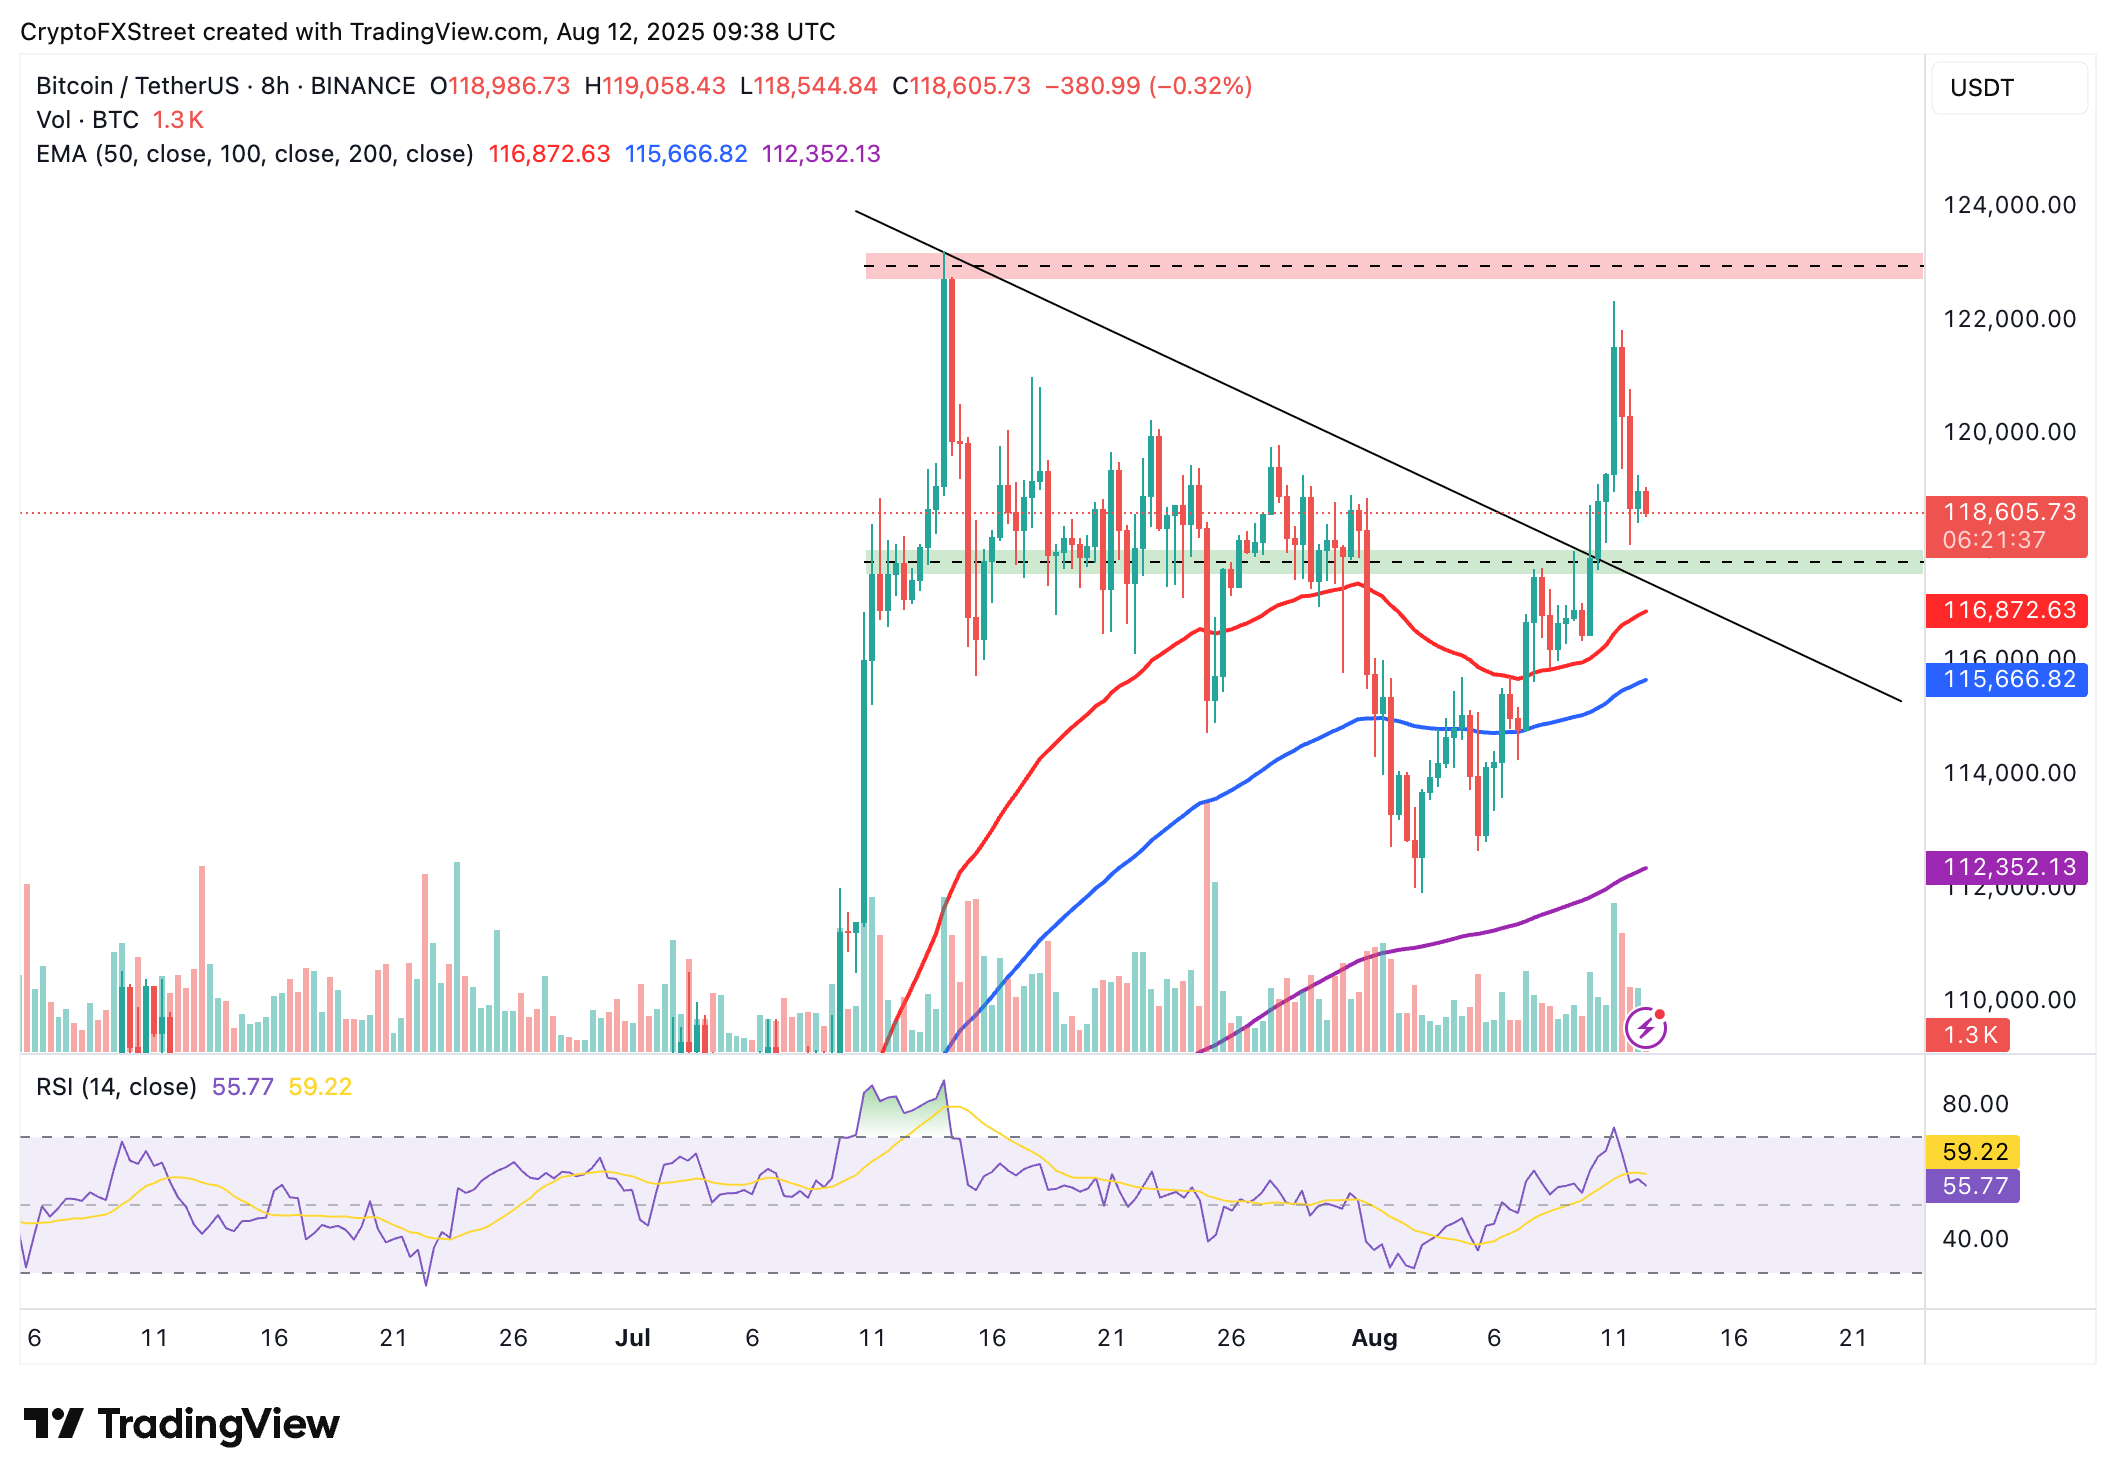
BTC/USDT 8-hour chart
However, Bitcoin remains positioned above its upward-trending moving averages, including the 50-period Exponential Moving Average (EMA) at $116,872, the 100-period EMA at $115,666, and the 200-period EMA at $112,352. Should a reversal occur, these levels would likely act as support, preventing a steeper decline toward the psychological support level of $110,000.
Altcoin Market Update: Ethereum Maintains Uptrend, XRP Consolidates
The price of Ethereum is currently holding just below the critical $4,300 mark, as buyers aim to push towards a new all-time high above $4,878. The RSI remains in overbought conditions, but also suggests the uptrend may continue, demonstrating ongoing market demand.
Key areas for traders to watch in upcoming sessions include the immediate resistance at $4,300 and the all-time high of $4,878. If broken, a sustained move above these levels could see Ethereum close in on the $5,000 milestone for the first time.
On the downside, the support zone around $4,000 is likely to absorb potential selling pressure from profit-taking, and ensure the overall uptrend remains intact.

ETH/USDT daily chart
As for XRP, its price is consolidating above the $3.00 support level. However, the RSI’s decline towards the midline suggests that selling pressure could outweigh buying interest, resulting in short-term downside potential.
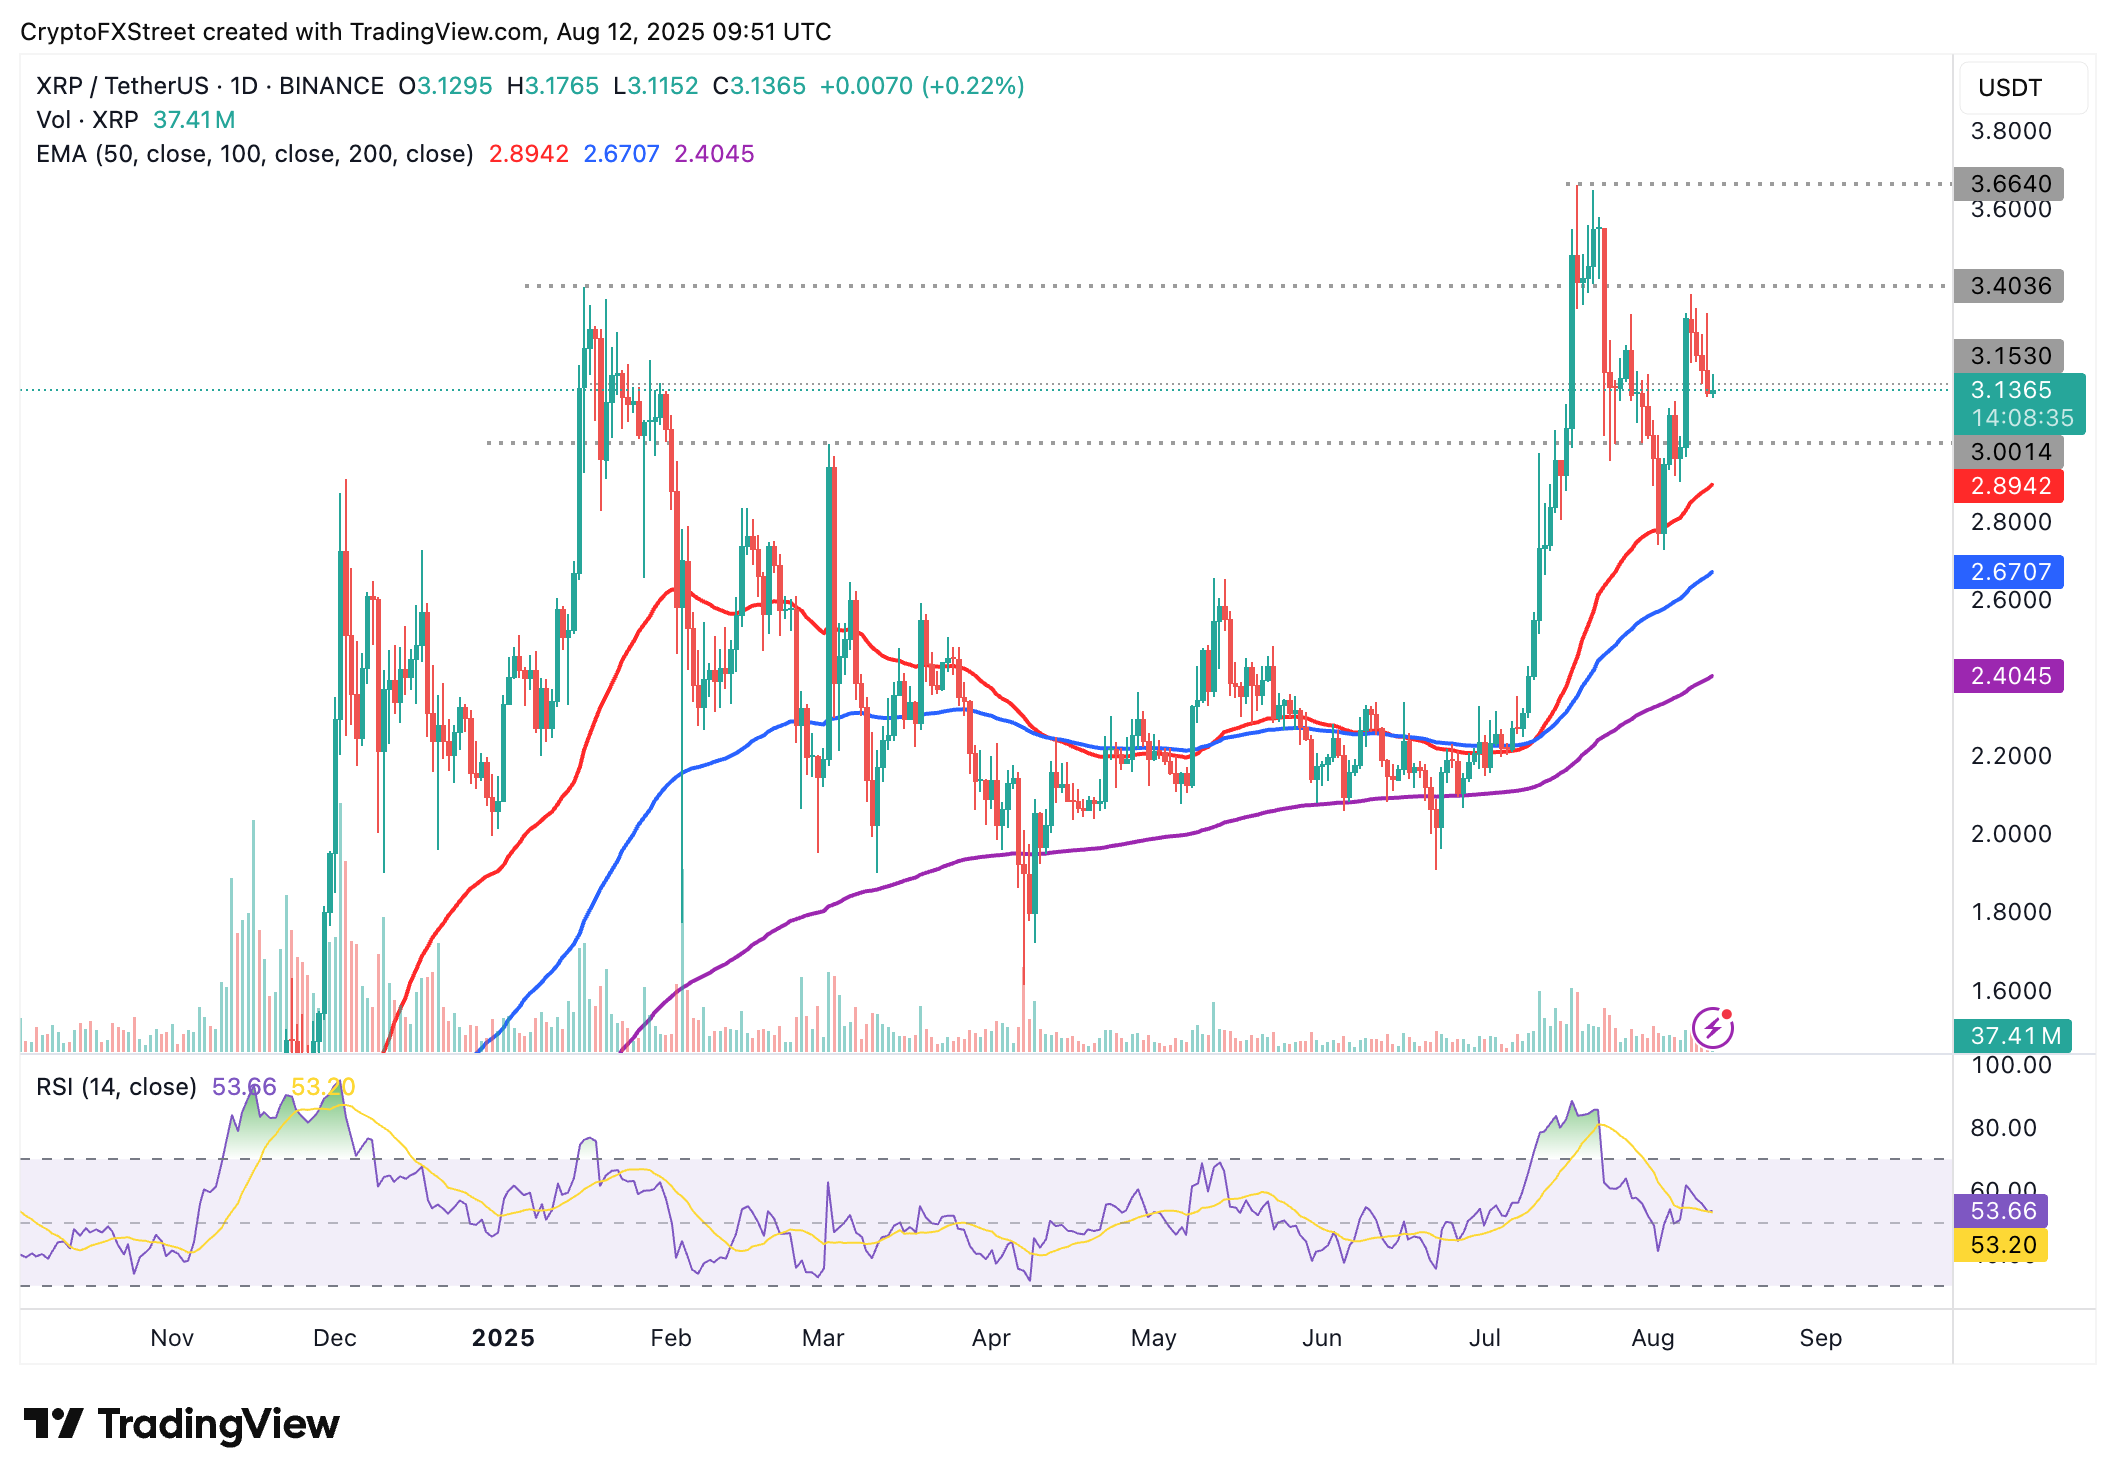
XRP/USDT daily chart
If buyers step in to buy the dip between the current price of $3.13 and the $3.00 support level, positive momentum could fuel a rebound for XRP.
The $3.40 resistance area remains a crucial hurdle in a potential recovery towards the record high of $3.66, achieved on July 18th. If XRP is rejected at this level, the $3.00 support level remains vulnerable, with a further decline towards the 50-day EMA at $2.89 becoming a possibility.
Bitcoin, altcoins, stablecoins FAQs
Bitcoin is the dominant cryptocurrency, defined by its sizable market capitalization. It’s a digital form of money conceived as a decentralized payment system, without a central authority. This facilitates peer-to-peer transactions removing third-party intermediaries.
Alternative cryptocurrencies, or “altcoins,” encompass any crypto asset other than Bitcoin. Ethereum is often categorized separately due to its substantial influence, as many forks originate from either Bitcoin or Ethereum. Litecoin is historically significant as one of the earliest altcoins; it forked from Bitcoin, offering an intended “improved” version.
Stablecoins are cryptocurrencies designed to minimize price volatility, typically by being pegged to a reserve asset. Most commonly, this peg is maintained through a 1:1 backing with a fiat currency like the US Dollar (USD). The supply of these stablecoins is adjusted either algorithmically or in response to market demand to maintain the stable peg. Stablecoins serve primarily as a bridge between fiat currencies and cryptocurrencies, allowing investors to easily move between the two. They also offer a stable store of value compared to the highly volatile nature of other cryptocurrencies.
Bitcoin dominance represents the ratio between Bitcoin’s market capitalization and the overall market capitalization of the entire cryptocurrency market. This metric offers insight into investor confidence in Bitcoin relative to other crypto assets. A high Bitcoin dominance often precedes or accompanies a bull market, as investors seek refuge in the relative stability of the largest cryptocurrency. Conversely, a decreasing Bitcoin dominance typically suggests investors are shifting capital towards altcoins, seeking greater returns, which often sparks altcoin rallies.
Disclaimer: For informational purposes only. Past performance does not guarantee future results.