

- Bitcoin is striving to surpass the $115,000 mark, with optimistic traders targeting $118,000, fueled by consistent buying activity.
- Ethereum bounces back, exceeding $3,500 as buyers aim for $3,800, supported by a solid 12 weeks of positive investment into its spot ETFs.
- XRP price regains the $3.00 level as momentum indicators suggest growing strength.
Cryptocurrency values are generally climbing again on Monday, following the market instability and price declines observed last week. Bitcoin (BTC), after briefly dropping to around $111,886 on Saturday, is showing renewed strength, getting close to the immediate resistance point of $115,000.
Other major cryptocurrencies, such as Ethereum (ETH) and Ripple (XRP), are also experiencing upward movement on Monday, driven by a gradual increase in investor confidence. ETH, the primary platform for smart contracts, is holding above the $3,500 support level, as buyers seek to push the price towards the $3,800 objective.
Market Overview: BTC, ETH, and XRP Show Recovery After Profit-Taking and Central Bank Statements
Last week was a nervous period for investors, influenced by significant economic data releases from the United States, announcements about interest rate policies, and the introduction of new tariffs by President Trump on Friday.
“The week had a promising beginning with substantial investment inflows of US$883 million. However, this trend reversed in the latter half of the week, most likely caused by the central bank’s cautious meeting and stronger-than-expected US economic figures,” the CoinShares analysis noted.
According to a CoinShares report published on Monday, crypto investment products saw more withdrawals than deposits overall, with Bitcoin leading the way at $404 million. In total, digital asset investment vehicles experienced net outflows of $223 million during the week.
Ethereum’s underlying factors have remained largely favorable, with financial products related to Ethereum recording their fifteenth consecutive week of inflows, totaling $134 million. Other digital assets showing positive inflows were XRP and Solana (SOL), with $31.3 million and $8.8 million respectively.
Digital investment products inflows | Source: CoinShares
Data Analysis: Ethereum Continues to Attract ETF Investment
Exchange Traded Funds (ETFs) focused on Ethereum have continued their positive trend, experiencing inflows for the twelfth week in a row. Data from SoSoValue indicates inflows of $154 million last week, a considerable decrease from the $1.85 billion observed the previous week.
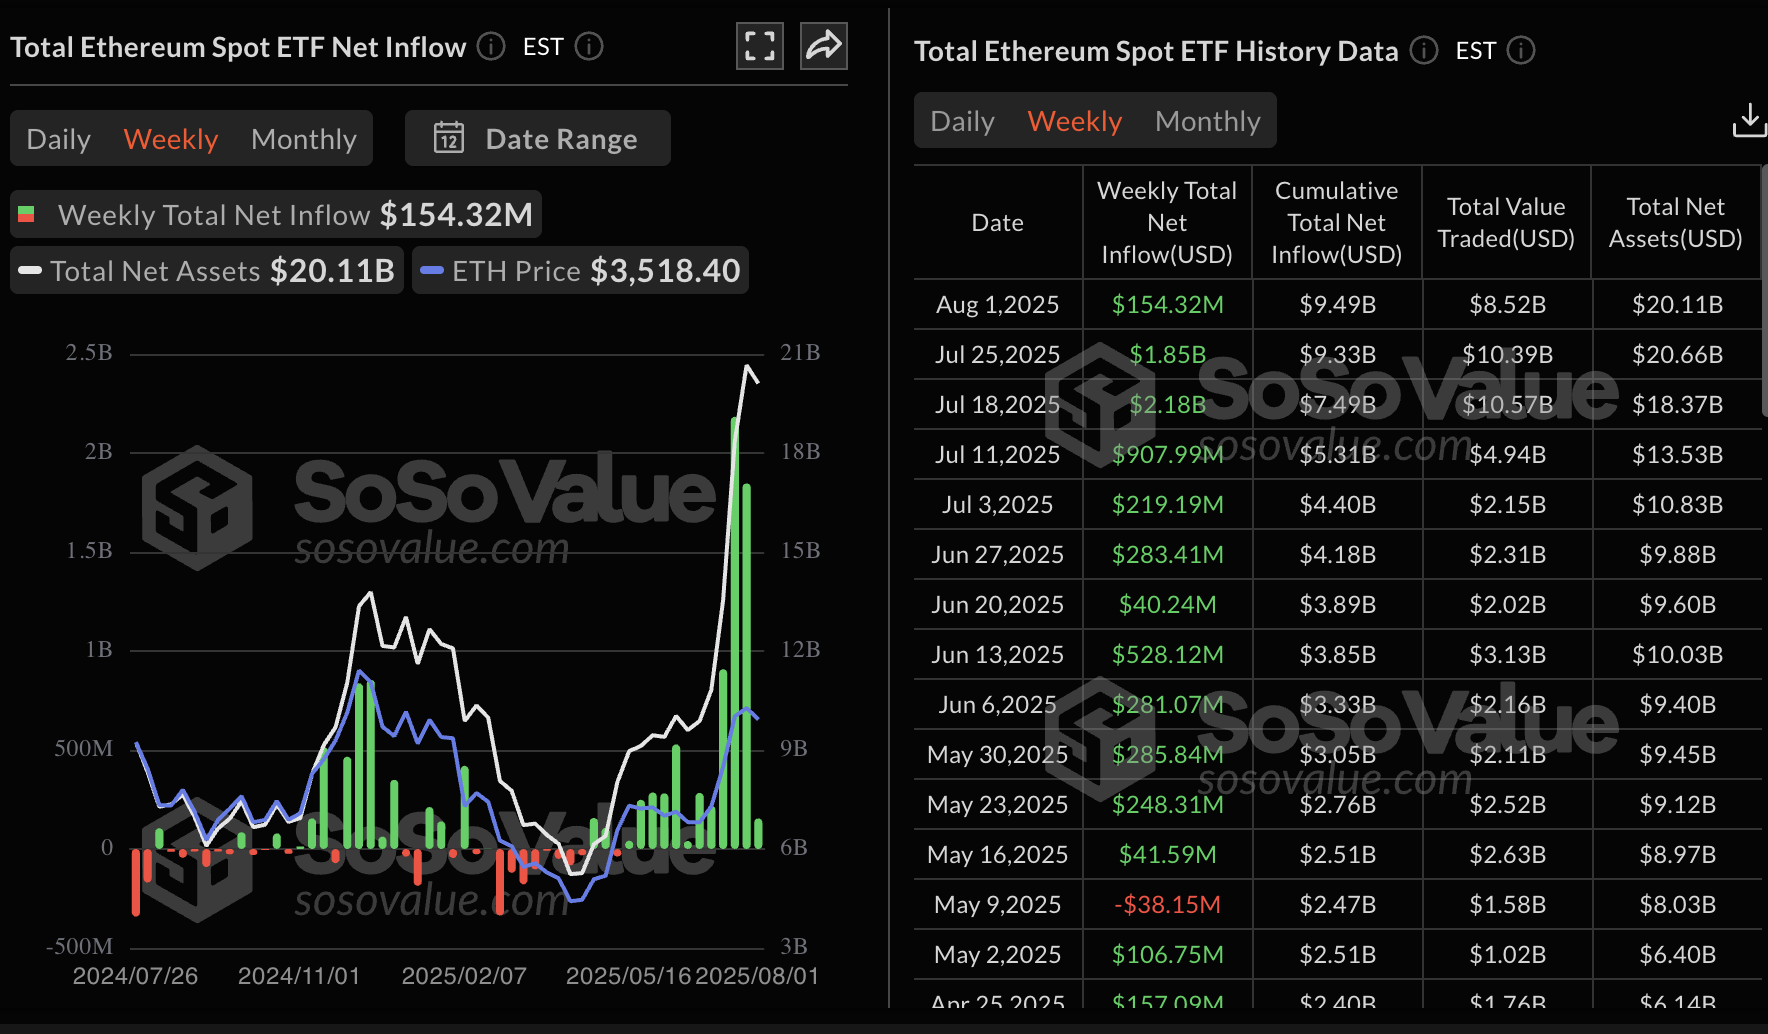
Ethereum spot ETF data | Source: SoSoValue
In contrast, Bitcoin spot ETFs saw outflows for the second day running, averaging $812 million on Friday. Bitcoin’s seven-week streak of positive inflows was broken, resulting in total outflows of $643 million, as illustrated in the chart below.
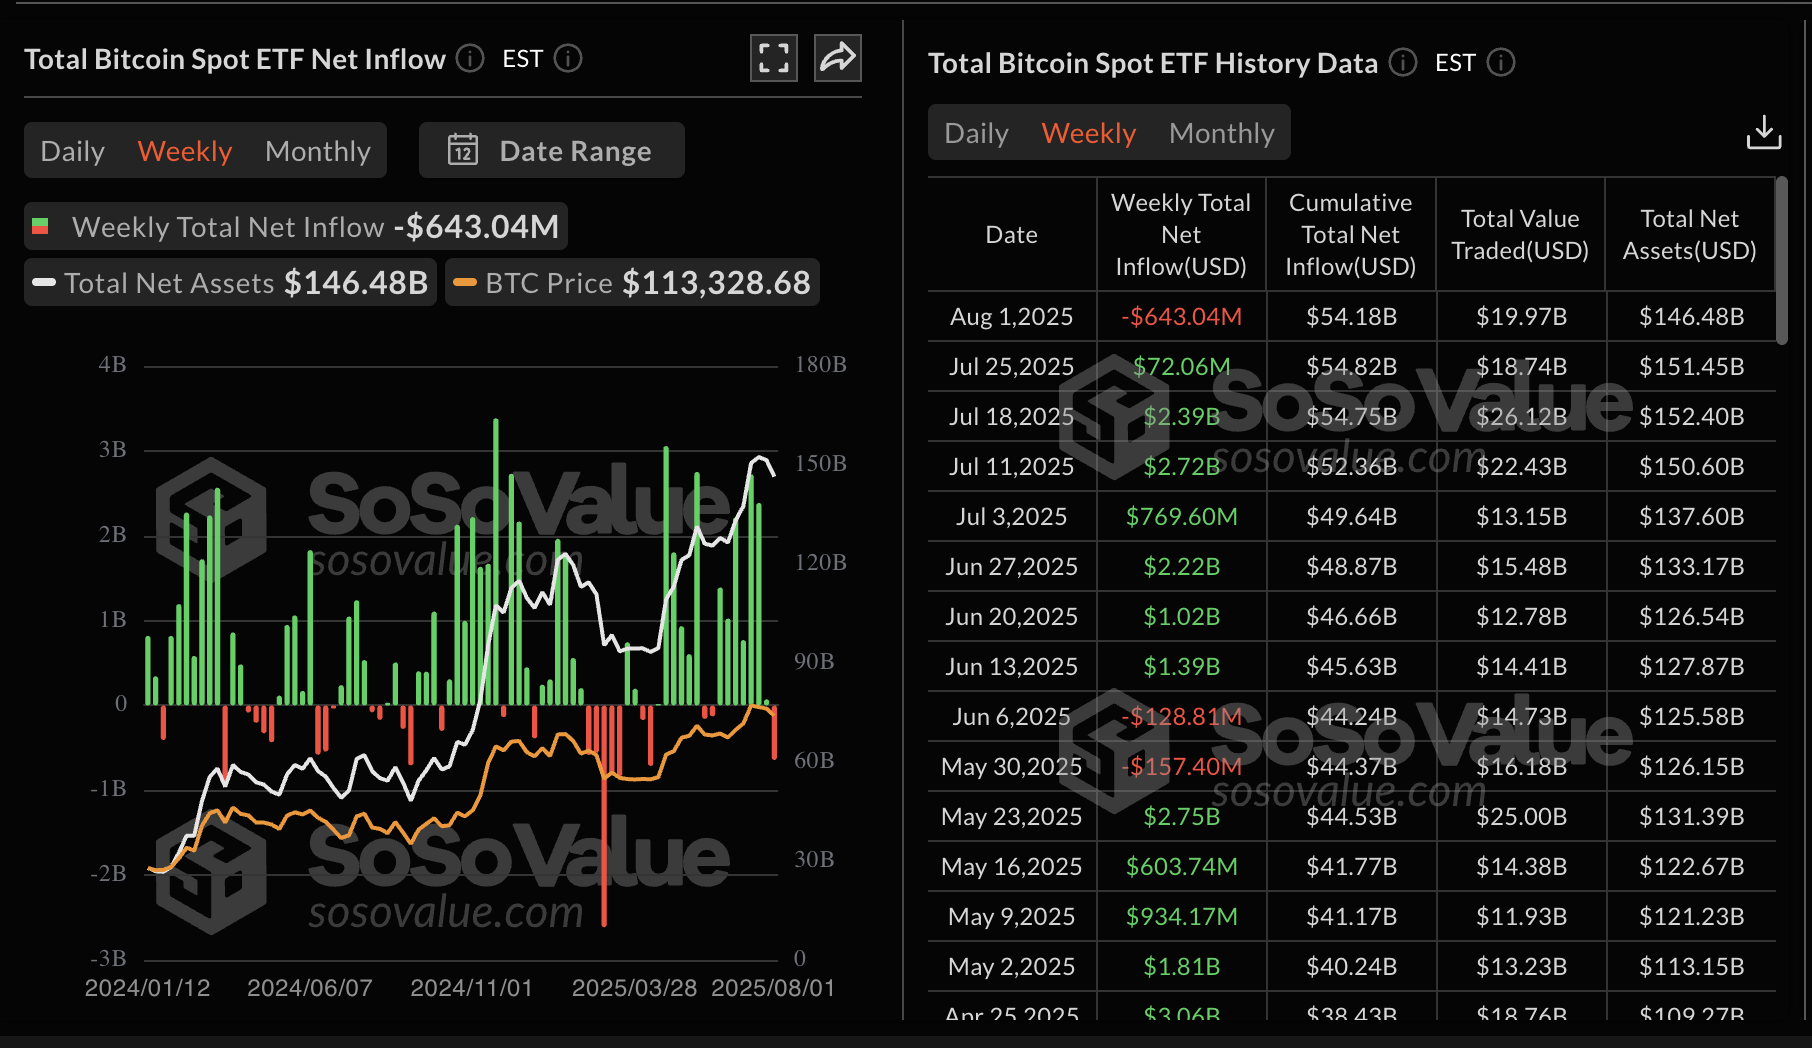
Bitcoin spot ETF data | Source: SoSoValue
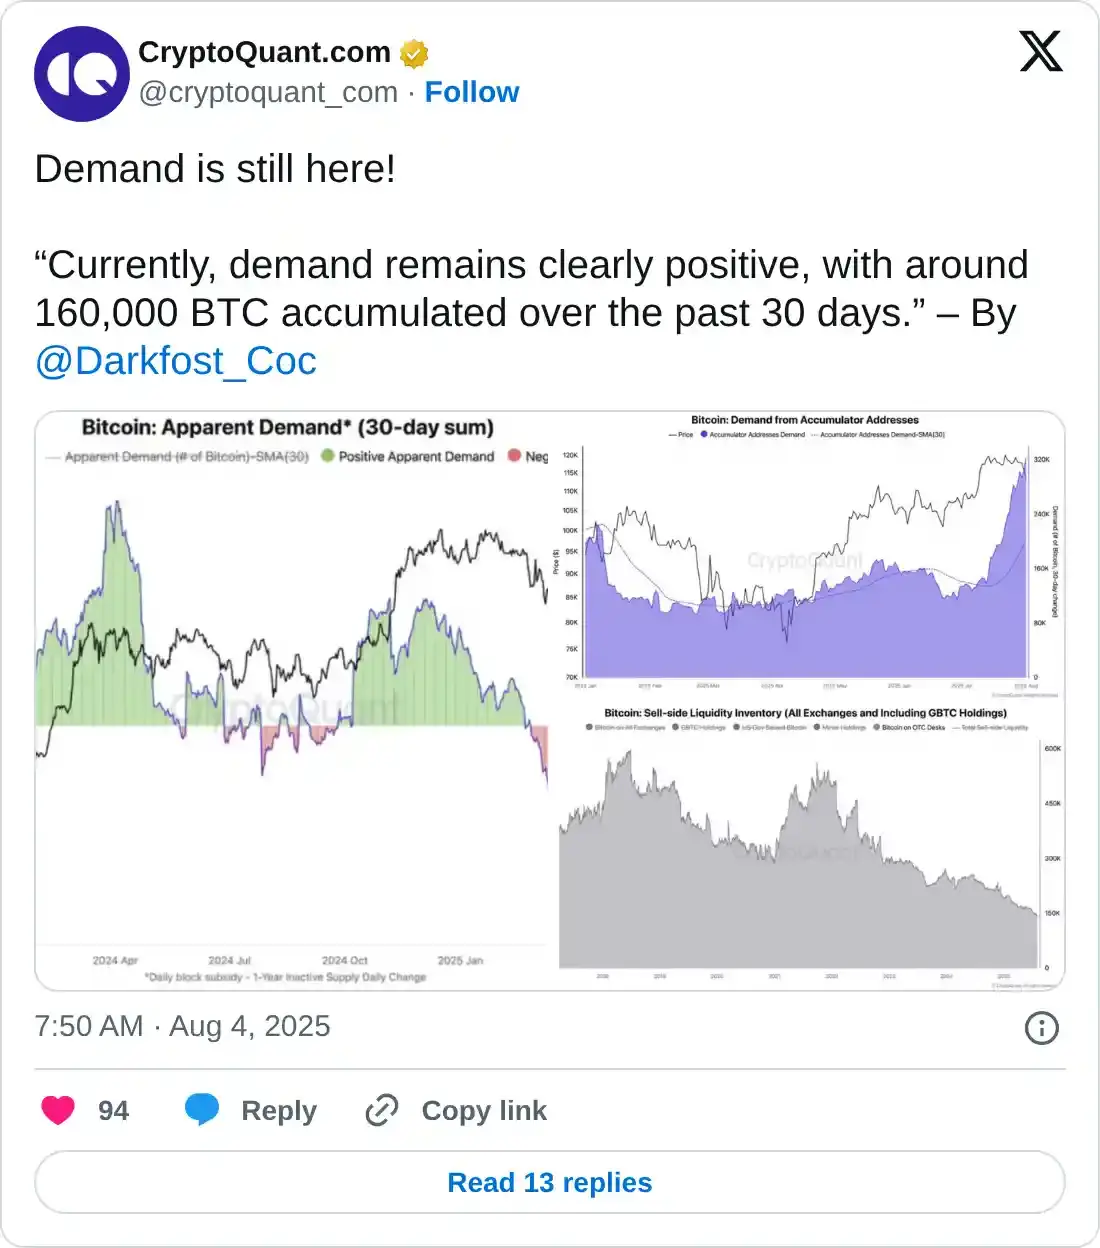
Nevertheless, data collected from CryptoQuant suggests that underlying demand remains strong, as investors continue to add to their Bitcoin holdings despite the recent dip in price. Over the past month, approximately 160,000 BTC have been acquired, demonstrating continued interest in the leading cryptocurrency by market value.
Market Chart: Bitcoin Makes Gains
The price of Bitcoin has been increasing for the past two days, after finding support around $111,886 on Saturday. Bulls are aiming to overcome the $115,000 resistance level, potentially leading to a further recovery towards the psychological barrier of $118,000.
Supporting this potential reversal is the Relative Strength Index (RSI), which is moving back towards the center line after stabilizing at 40. If the RSI continues to rise towards overbought conditions, the likelihood of further upward price movement increases.
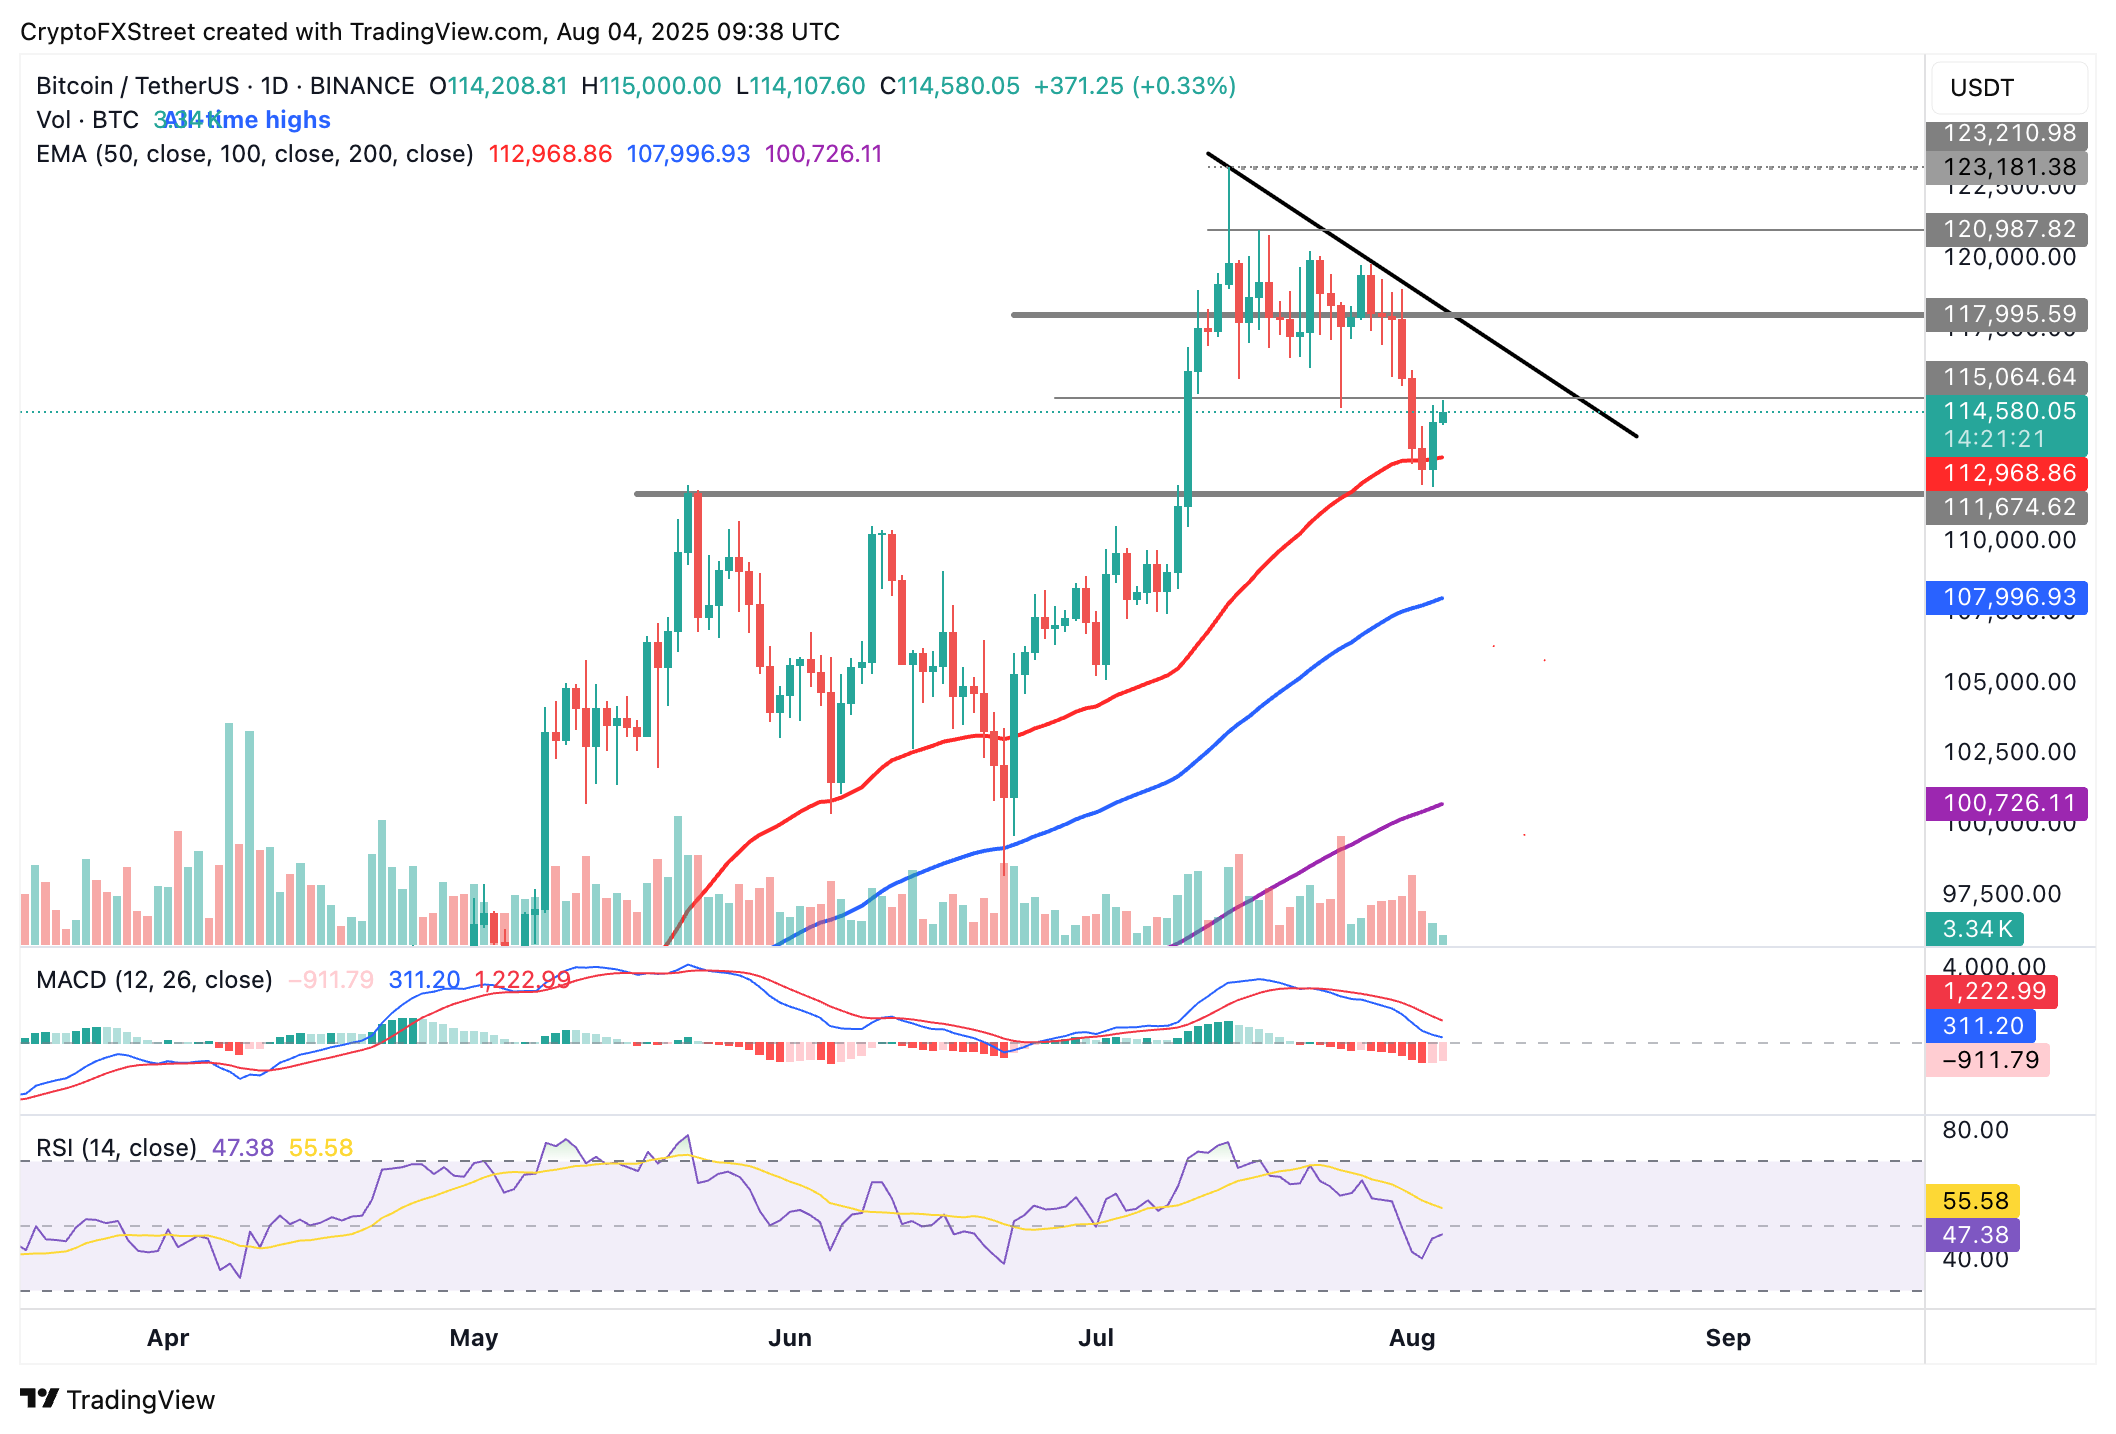
BTC/USDT daily chart
While the short-term outlook appears positive, investors should monitor potential support areas. The 50-day Exponential Moving Average (EMA) at $112,968 and the 100-day EMA at $107,996 are significant levels to watch if the recent downward trend resumes.
Altcoin Updates: Ethereum and XRP Display Positive Signals
Ethereum’s price is showing recovery for a second consecutive day, up approximately 6% from its low of $3,350 last week. The token is currently trading around $3,549 as bulls push for a quick move towards the next major resistance point at $3,800.
The RSI and the Moving Average Convergence Divergence (MACD) indicators are important to track, particularly for shorter-term traders. With the RSI rising to 56 from the midline, increased buying interest could fuel Ethereum’s recovery in the near term.
The MACD currently indicates that sellers still have control, but selling momentum is showing signs of weakening. Traders should look for a buy signal if the blue MACD line crosses above the red signal line.
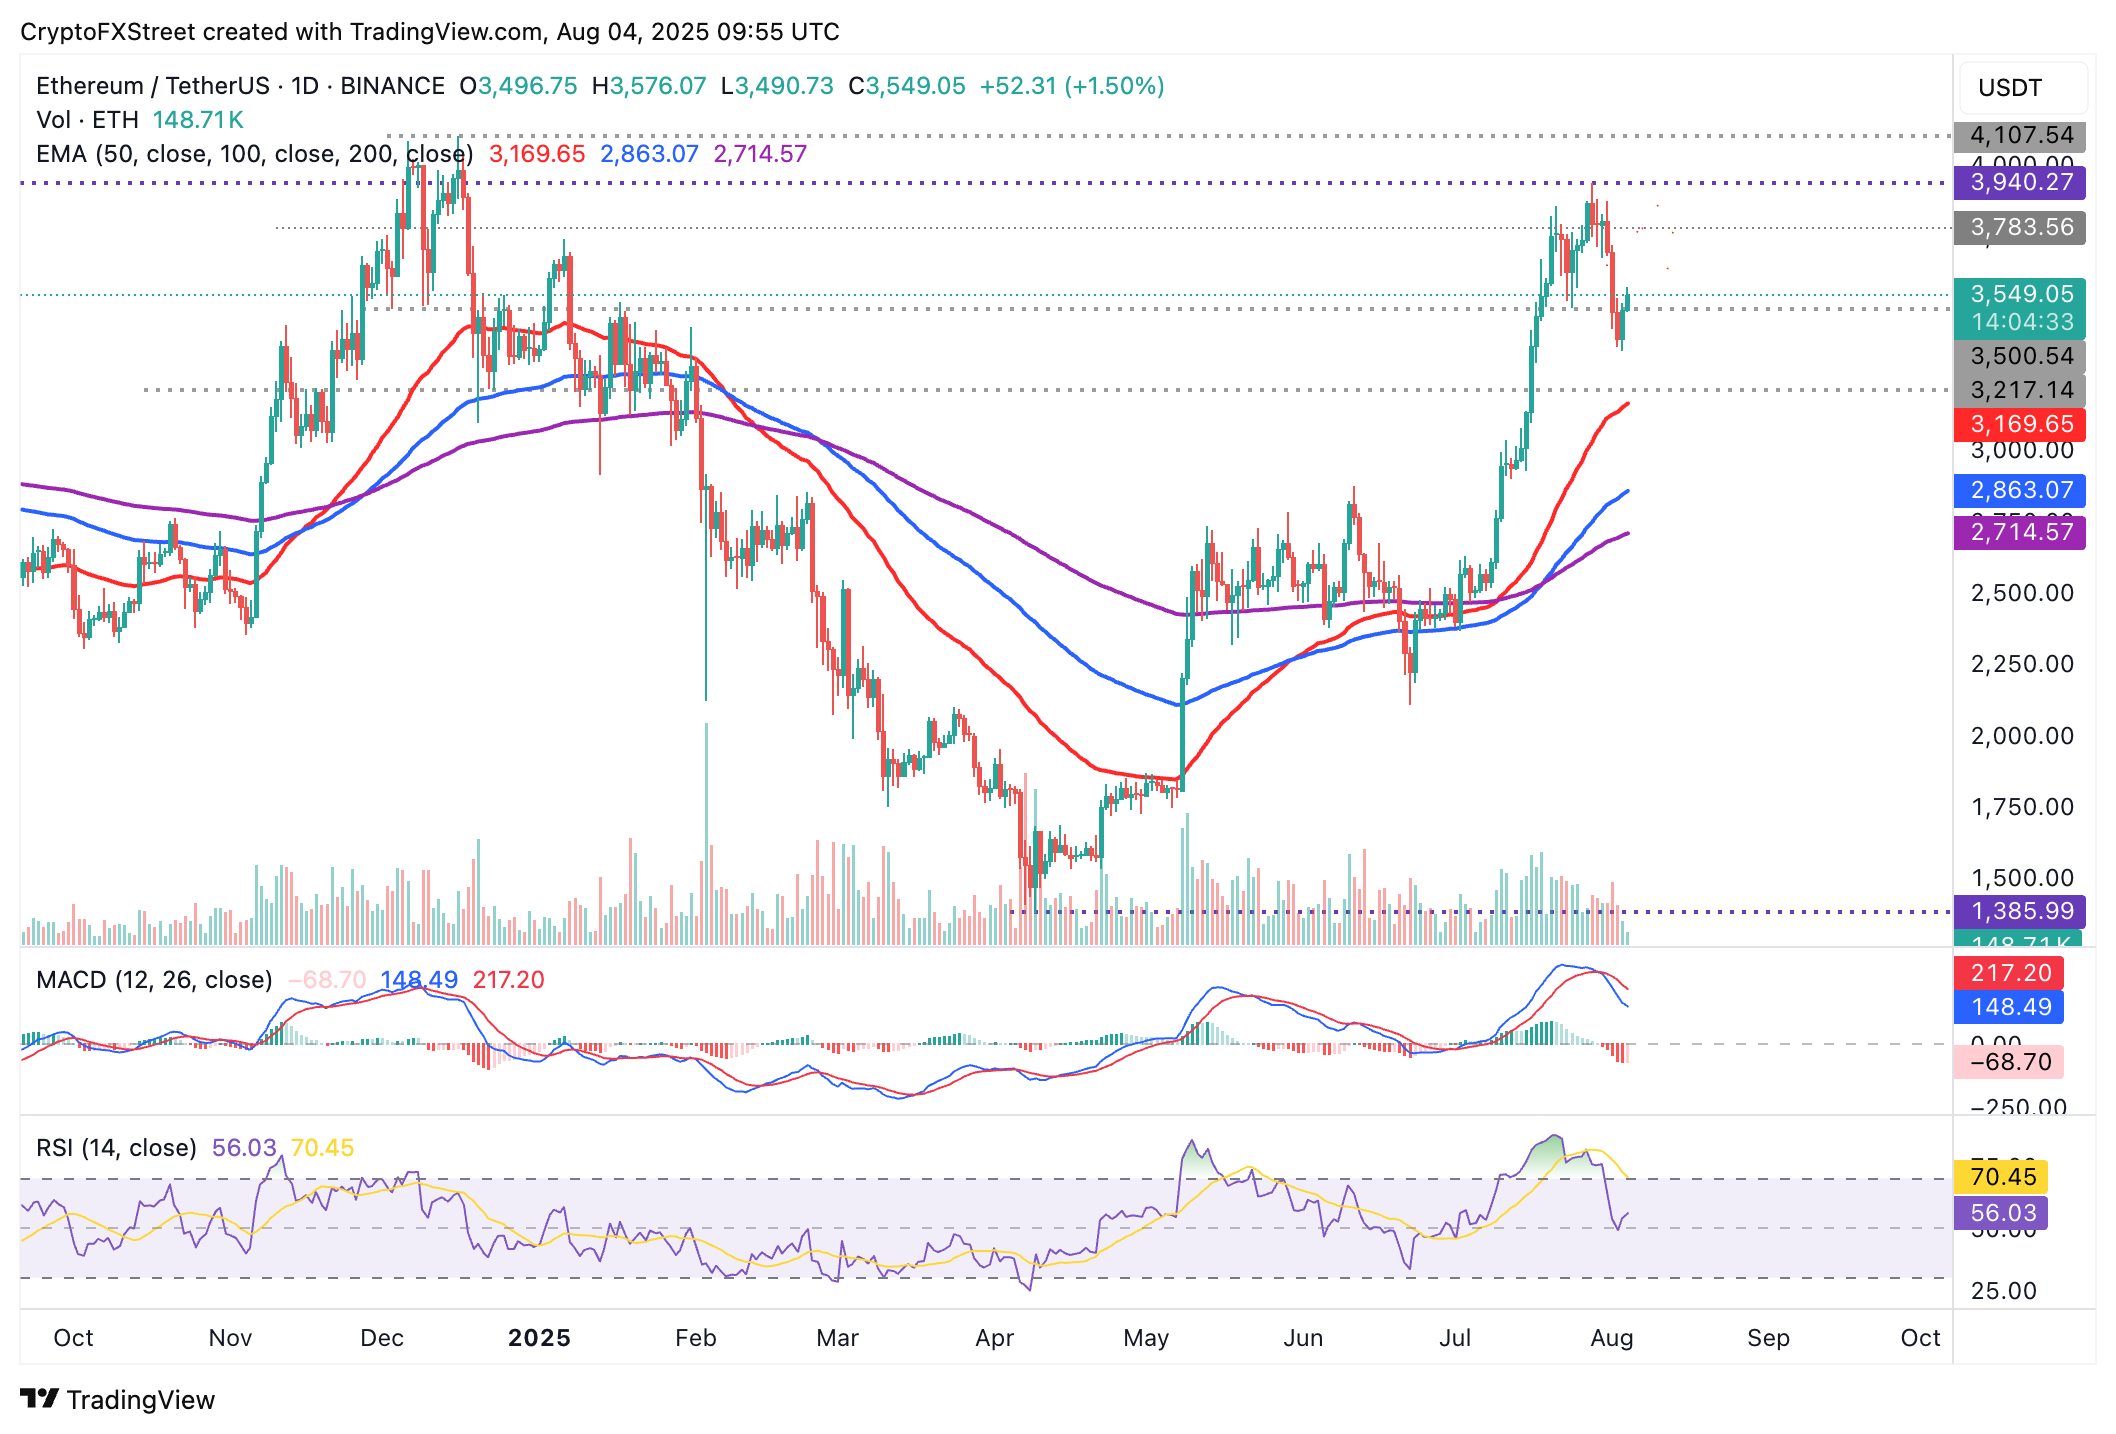
ETH/USDT daily chart
XRP is exhibiting a slightly positive outlook, trading just above $3.00 on Monday. Ongoing institutional interest is evident from the $31.3 million of inflows into related investment products, as discussed earlier.
If retail buying interest returns, the cryptocurrency designed for international money transfers could continue its recovery towards the $3.30 level, and potentially reach its all-time high around $3.66.
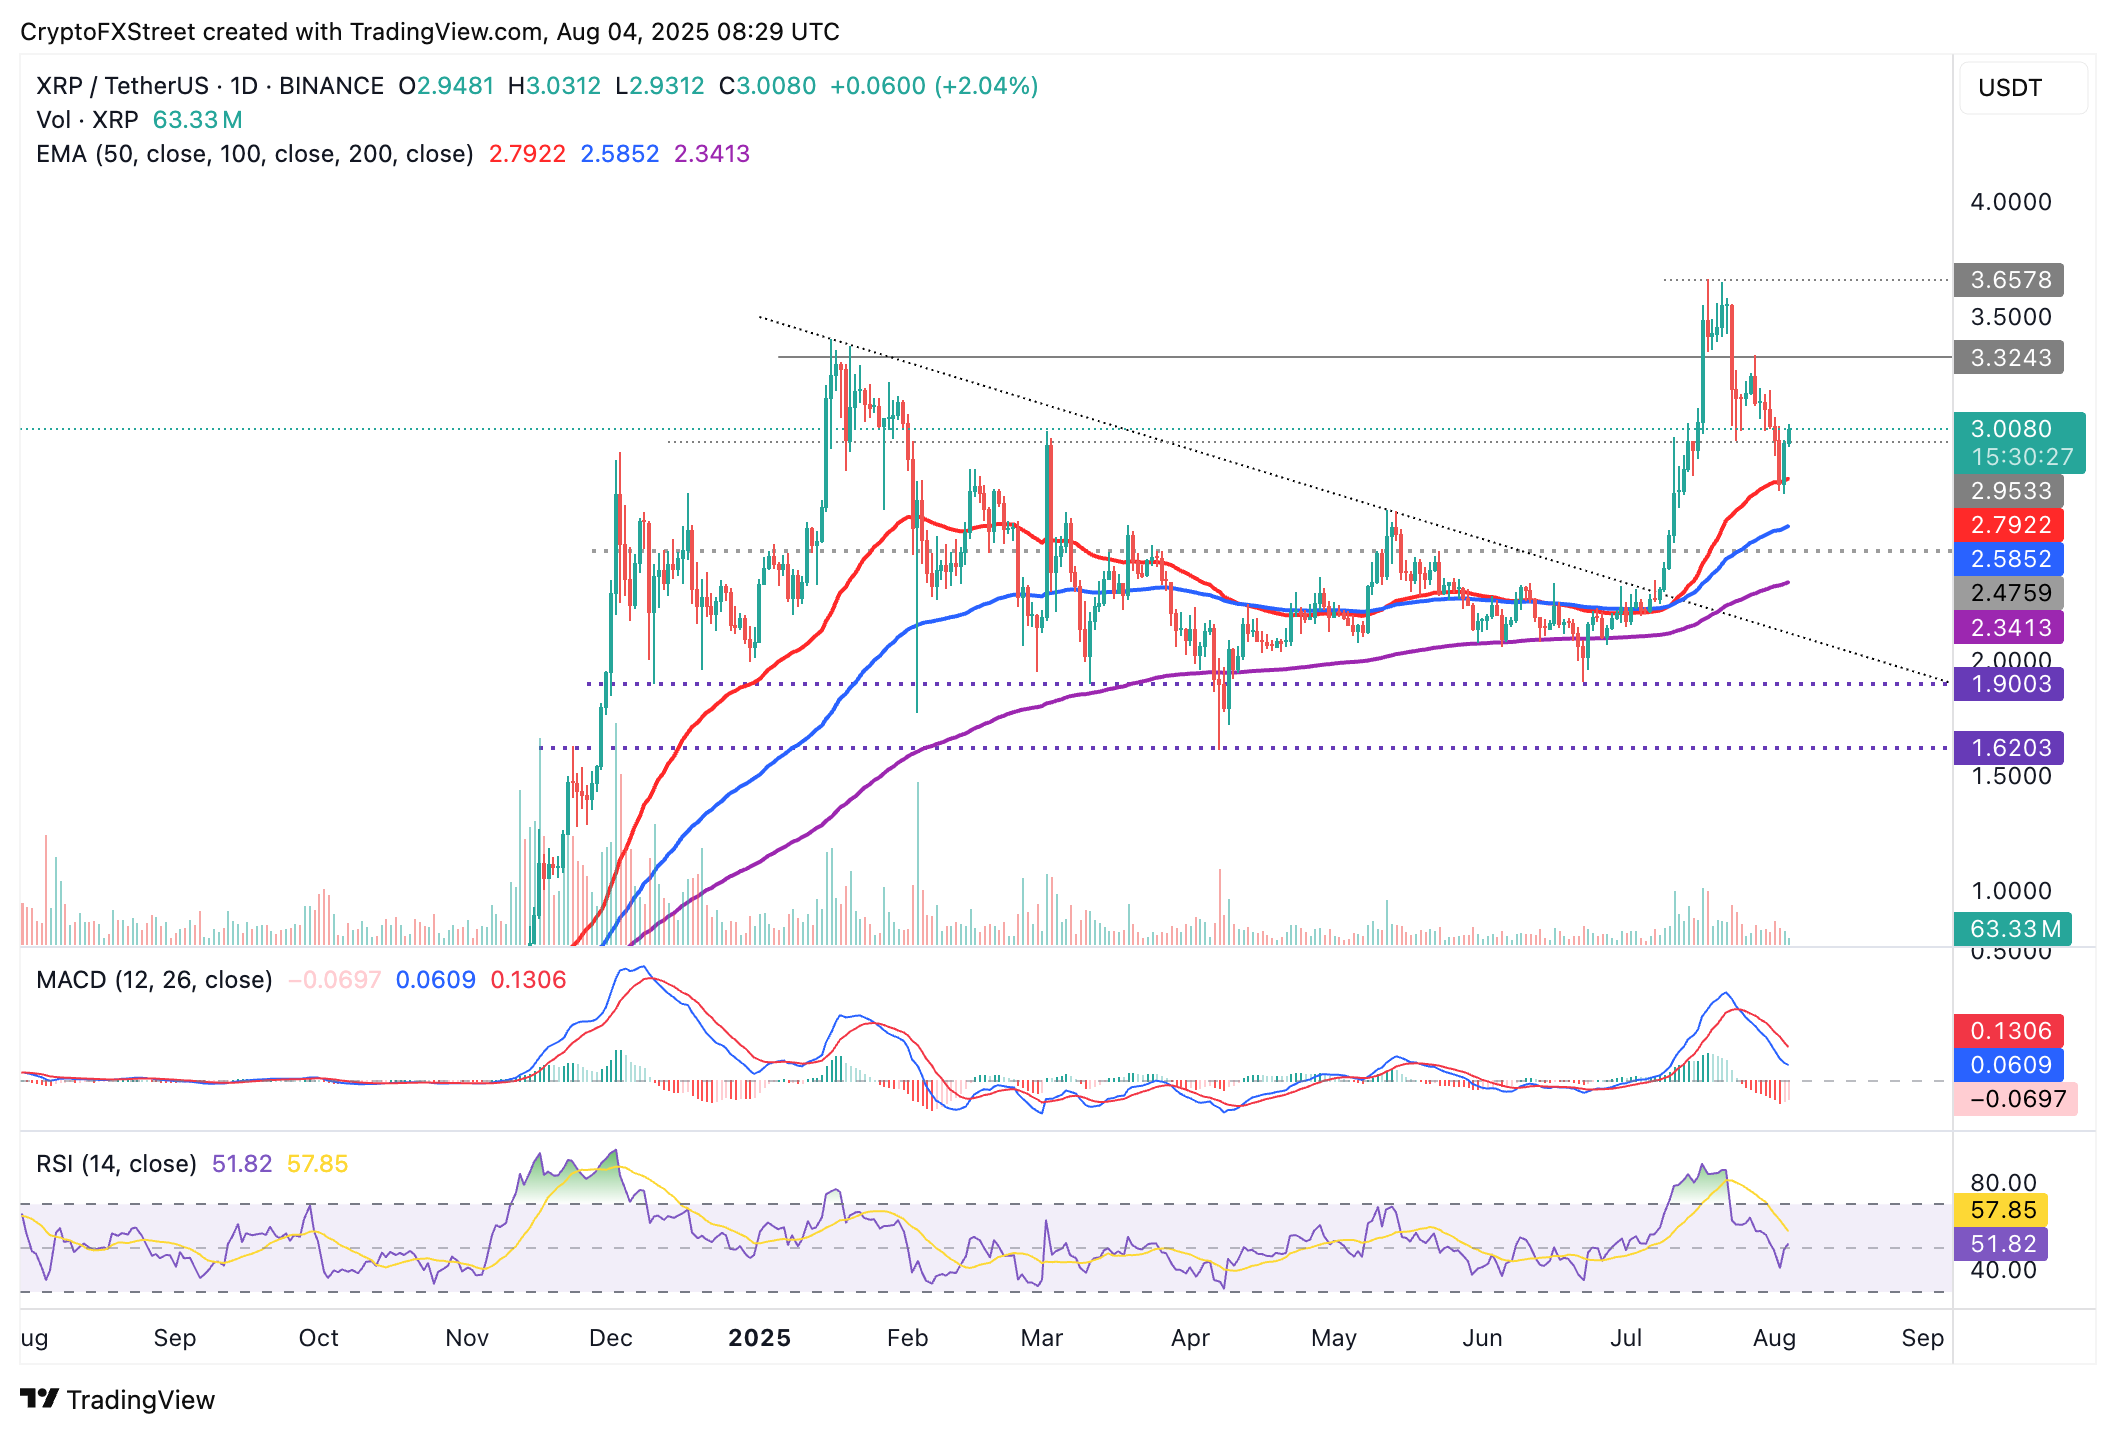
XRP/USDT daily chart
The RSI supports the recovery, as it moves slightly above the midpoint. Continued upward movement toward the overbought region could sustain speculative demand. On the downside, traders should keep an eye on potential support zones, including the 50-day EMA at $2.79 and the 100-day EMA at $2.58.
Open Interest, funding rate FAQs
Disclaimer: This information is for educational purposes only and should not be considered financial advice. Past performance does not guarantee future success.