

- Bitcoin Surges Past $112,000 as Crypto Market Shows Renewed Strength.
- Ethereum Holds Steady Above Key Support; ETH ETFs See Inflows After a Period of Outflows.
- XRP Preparing for Potential Breakout, Targeting $3.35 in Near Term, All-Time High of $3.66 Further Out.
Bitcoin (BTC) climbed above the $112,000 mark on Wednesday, reflecting a positive shift after a decline the previous day. The leading cryptocurrency briefly tested a support level of $110,803 on Tuesday before regaining upward momentum.
For a confirmed bullish trend, Bitcoin needs to break through and close above the immediate resistance level of $113,000.
Concurrently, other cryptocurrencies, including Ethereum (ETH) and Ripple (XRP), are maintaining positions above crucial support levels, suggesting a possible broader market recovery heading into the weekend.
Ethereum ETFs Experience Renewed Investor Interest
Growing institutional investment in Ethereum indicates a potential resurgence, highlighted by $44 million flowing into ETH spot Exchange-Traded Funds (ETFs) on Tuesday. Previously, a cautious market sentiment led institutional investors to withdraw funds for six consecutive days.
While all nine of the US-based ETH spot ETFs saw no outflows yesterday, BlackRock’s ETHA was the sole contributor to the recent inflow of funds.
Ethereum ETFs collectively boast a net inflow of $12.67 billion and hold a total net asset value of $27.39 billion.
Ethereum ETF stats | Source: SoSoValue
Bitcoin ETFs are experiencing their second consecutive day of inflows, following a two-day period of outflows earlier in the week. US BTC spot ETFs registered $23 million in inflows on Tuesday and $368 million on Monday, bringing the total net inflow to $54.88 billion and the cumulative net assets to $144.3 billion.
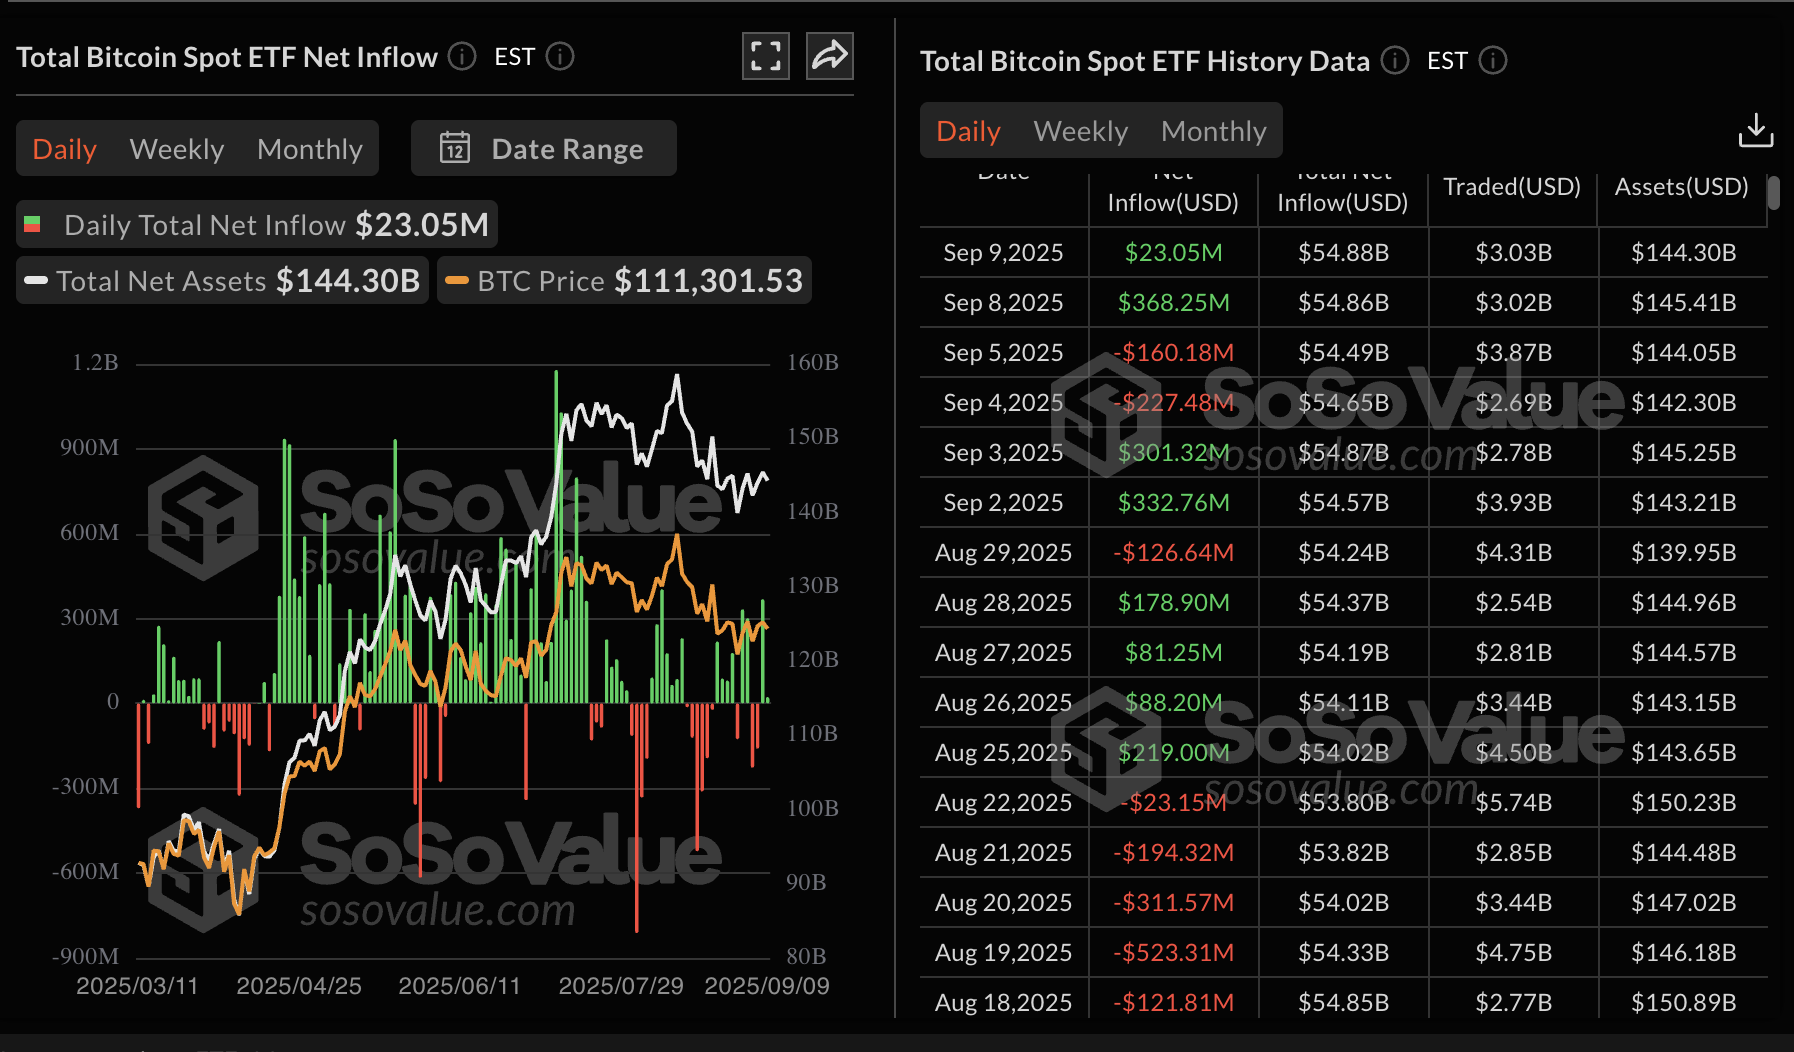
Bitcoin ETF stats | Source: SoSoValue
In parallel, retail interest in XRP is increasing, fueled by a consistent rise in futures Open Interest (OI), averaging $7.91 billion on Wednesday, up from $7.37 billion on Sunday. This upward trend suggests a strong investor belief in XRP’s ability to sustain its recovery and potentially reach its all-time high of $3.66, recorded on July 18.
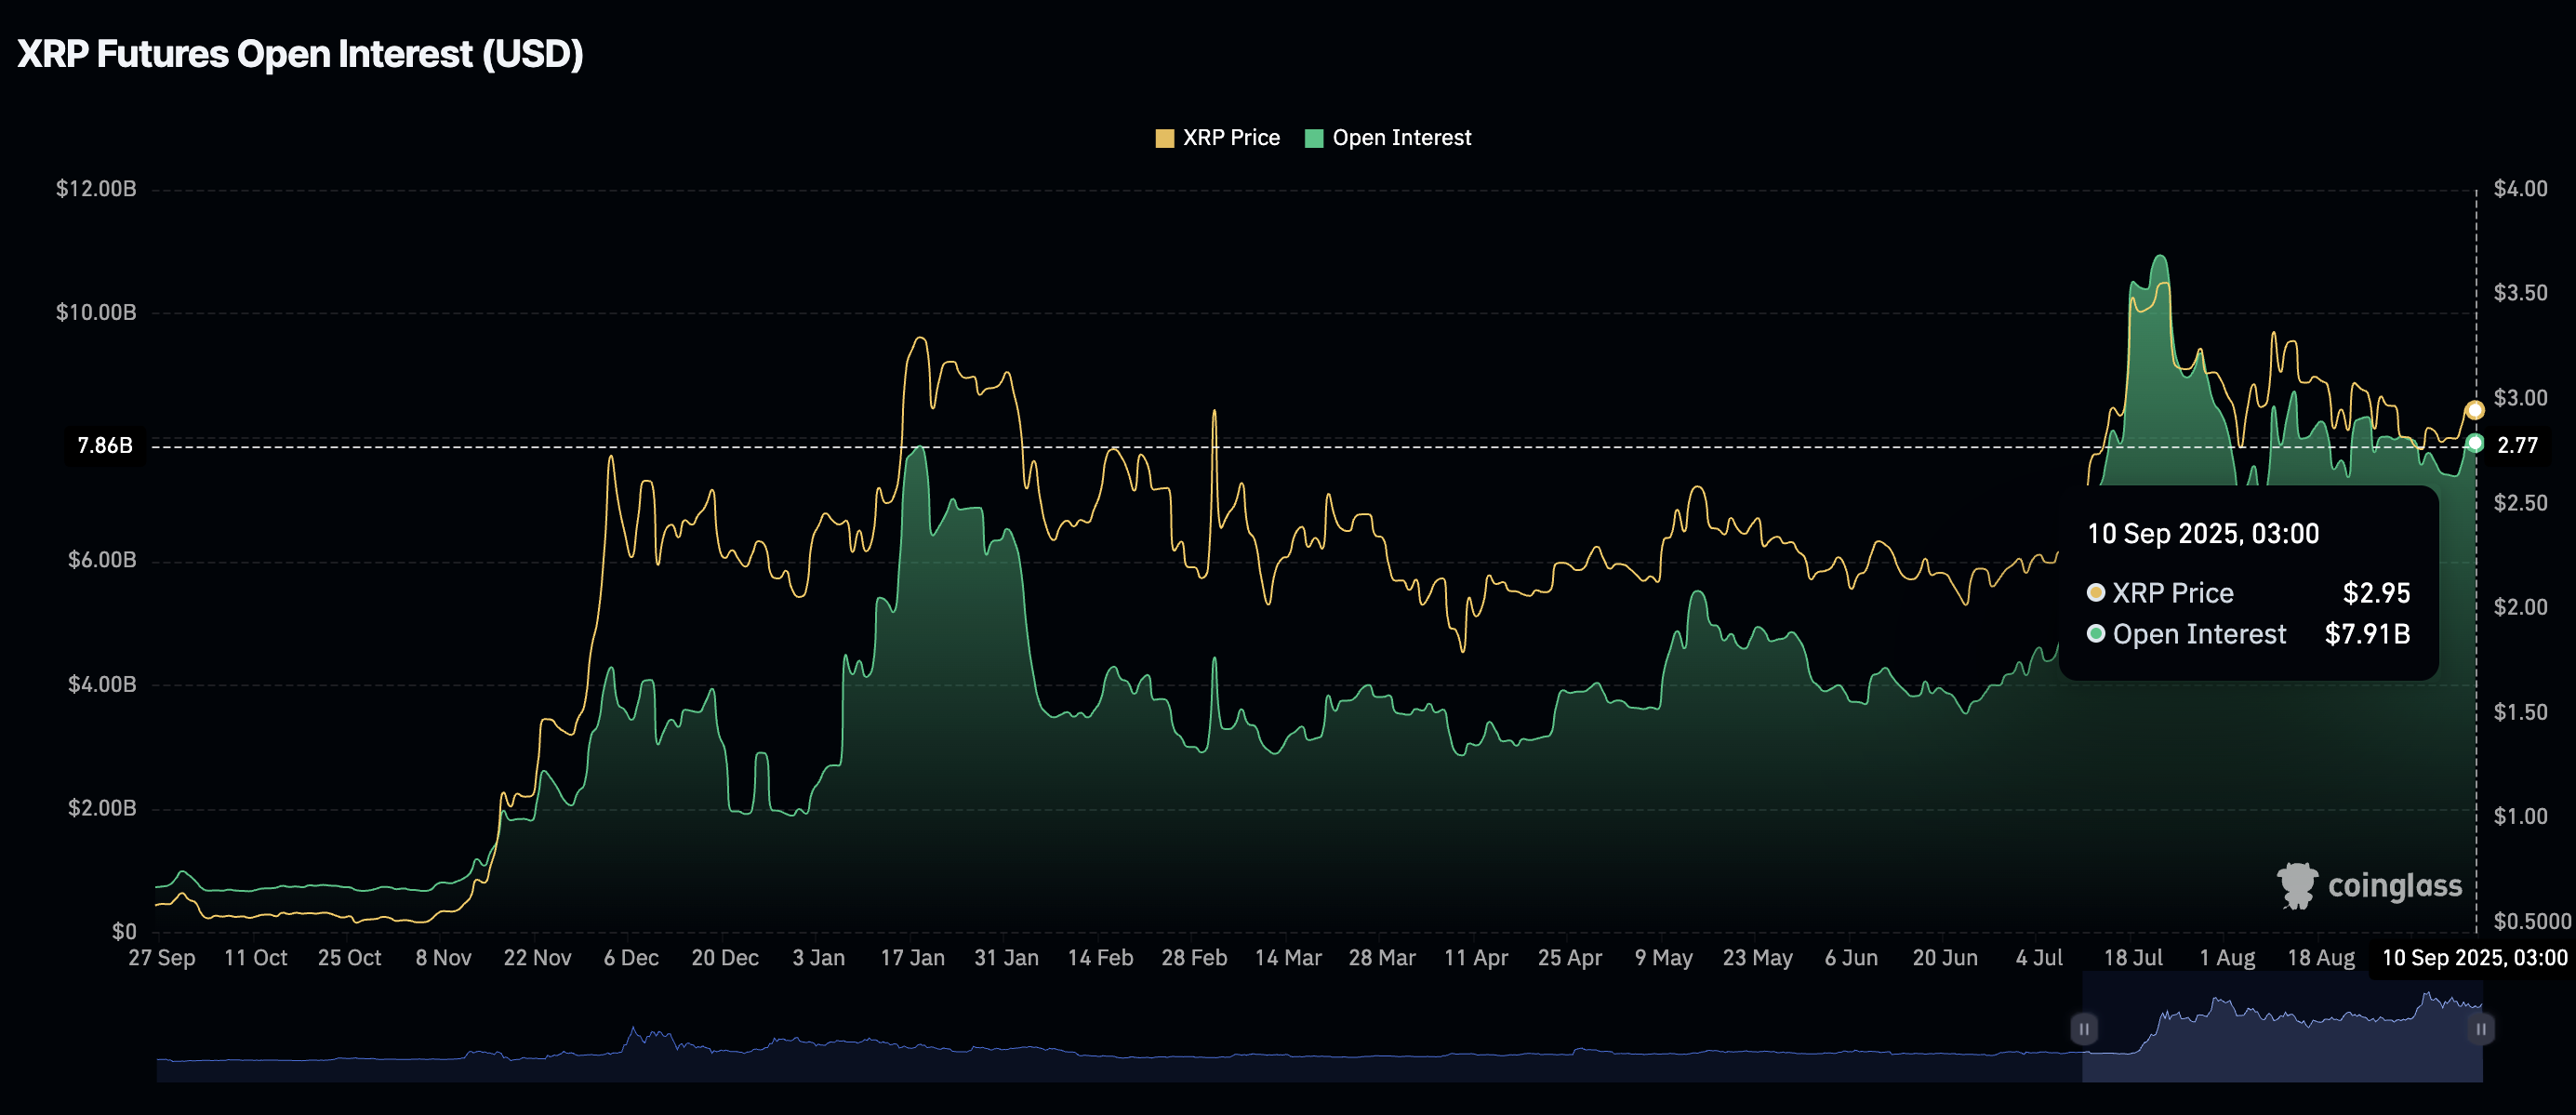
XRP Futures Open Interest | Source: CoinGlass
Bitcoin Chart Analysis: Eyes on $120,000 Target
Bitcoin’s price remains above $112,000, boosted by growing retail investor engagement and optimism surrounding a potential interest rate cut by the Federal Reserve (Fed) on September 17. Recent economic data, including revisions to the US Nonfarm Payrolls, indicates a softening labor market, increasing the likelihood of rate cuts later this year.
The daily chart exhibits a robust technical structure, supporting a positive outlook, starting with a buy signal from the Moving Average Convergence Divergence (MACD) indicator, which has been in place since Sunday.
The Relative Strength Index (RSI) has rebounded to 49 after dipping to 38 on August 30, reinforcing the bullish signals from the MACD. A higher RSI reading would suggest that selling pressure is diminishing as buyers regain control, paving the way for a breakout toward the $120,000 target.
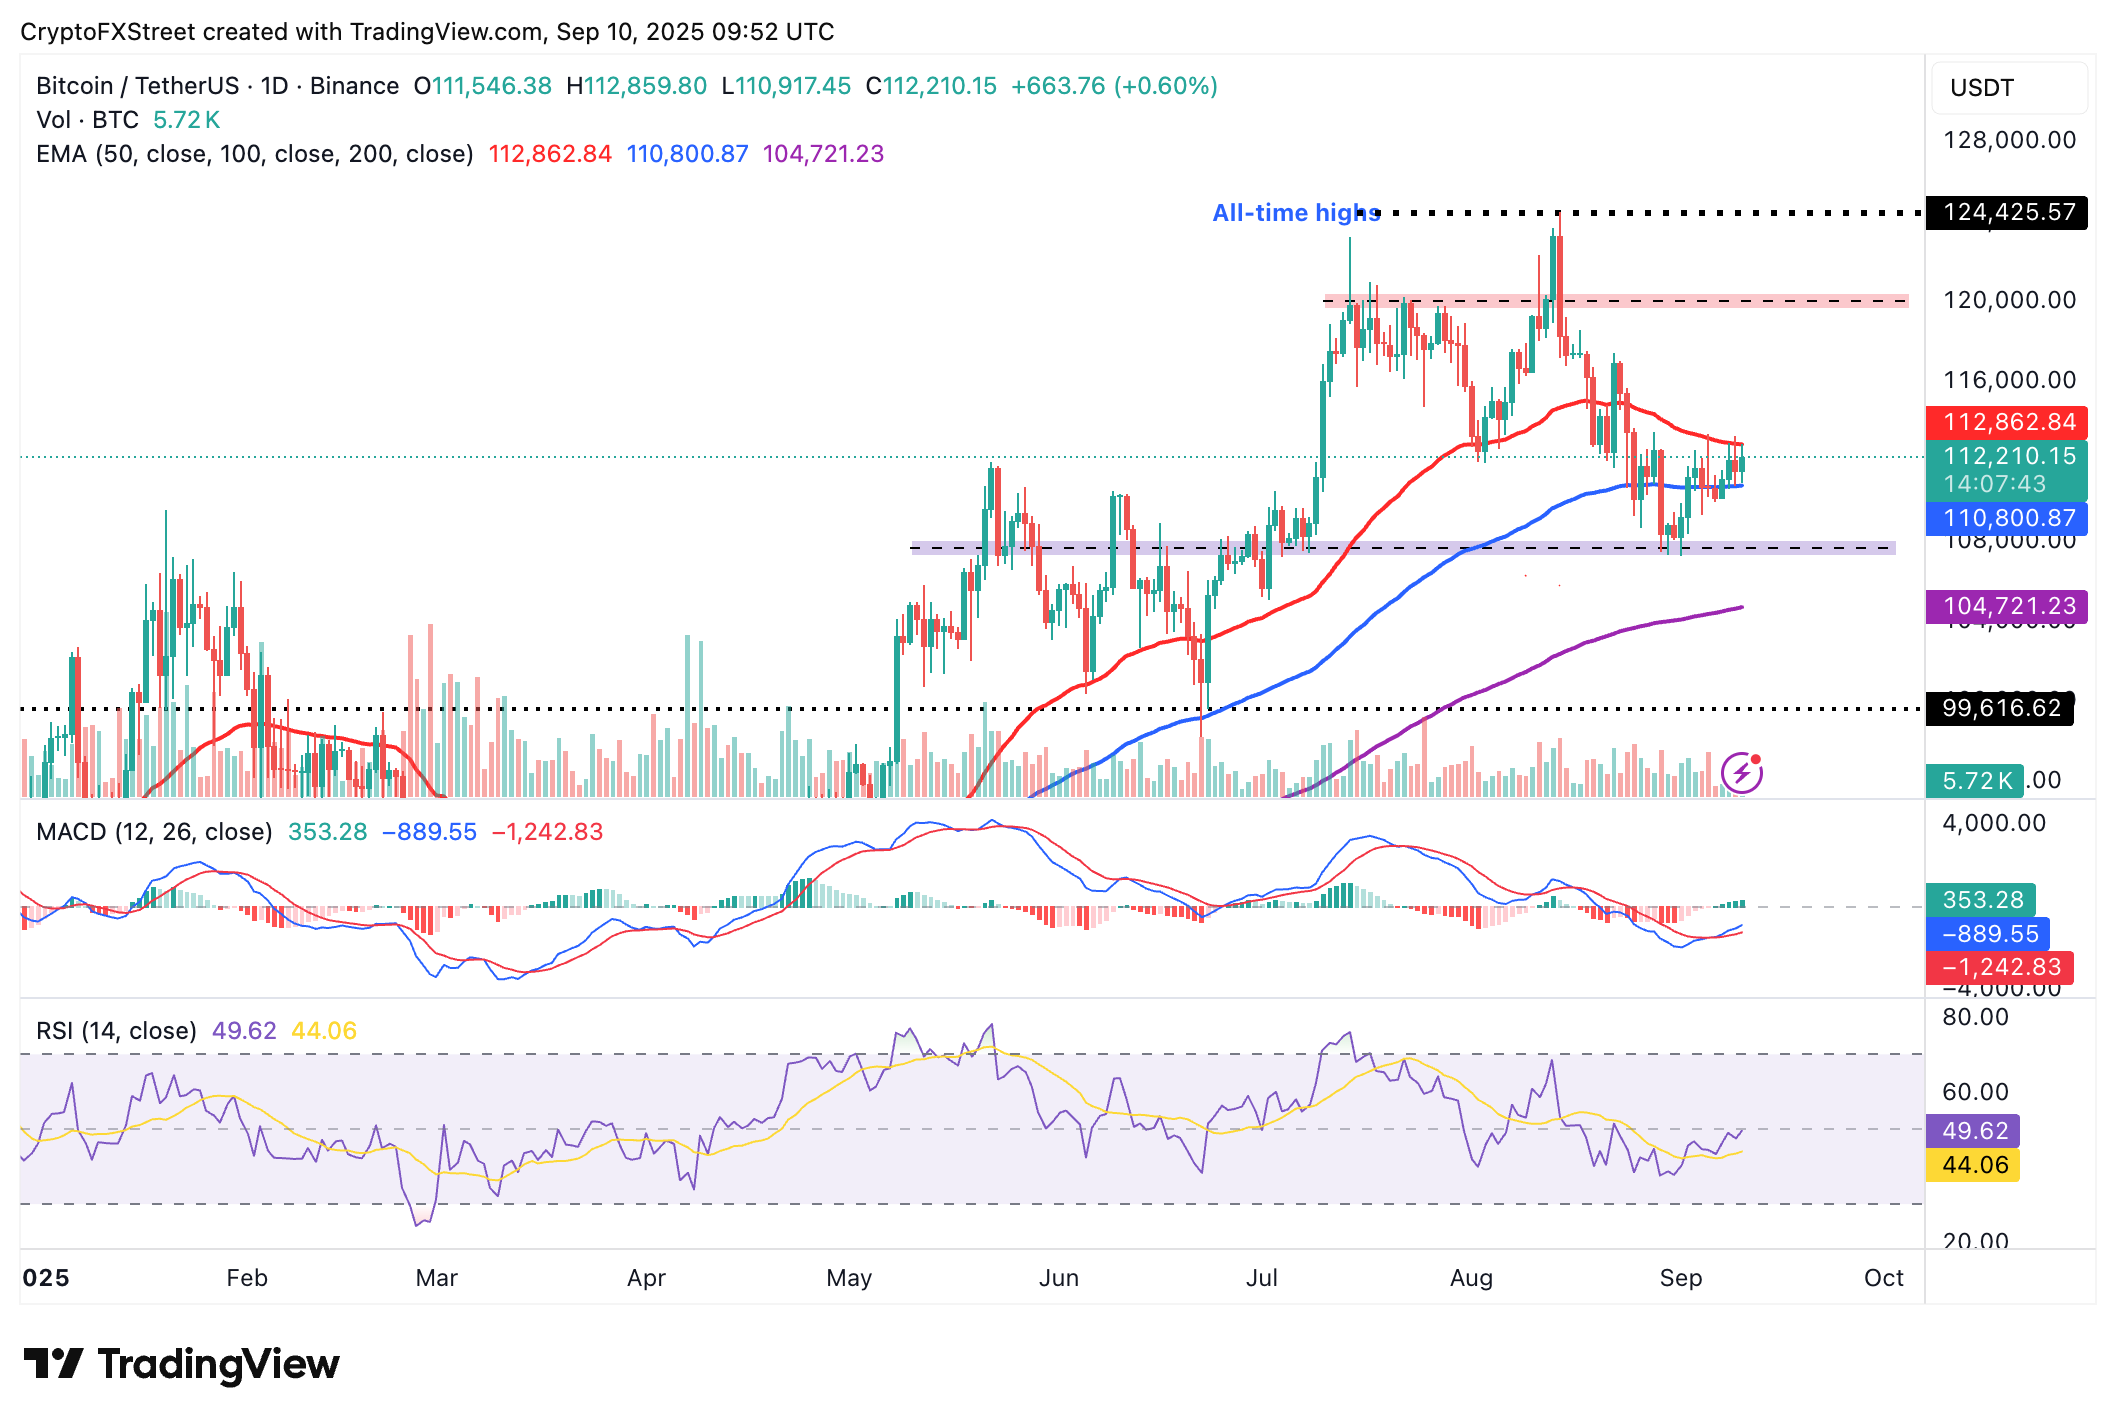
BTC/USDT daily chart
Altcoin Insights: Ethereum Consolidates, XRP Attempts Breakout
Ethereum is holding above the 50-day Exponential Moving Average (EMA) support at $4,096, but still trades significantly below its all-time high of $4,956 reached on August 24.
Technical indicators suggest ongoing consolidation, including a stable RSI around the 50 midline on the daily chart. A neutral RSI indicates a balance between buying and selling forces, leading to market uncertainty.
The MACD indicator has maintained a sell signal since August 25, suggesting that sellers currently have a slight advantage.
However, traders should exercise caution with bearish expectations, as the MACD shows signs of stabilizing above the mean line. If the MACD line (blue) crosses above the red signal line, demand for ETH could rise along with risk-on sentiment, increasing the potential for a rebound towards the all-time high.
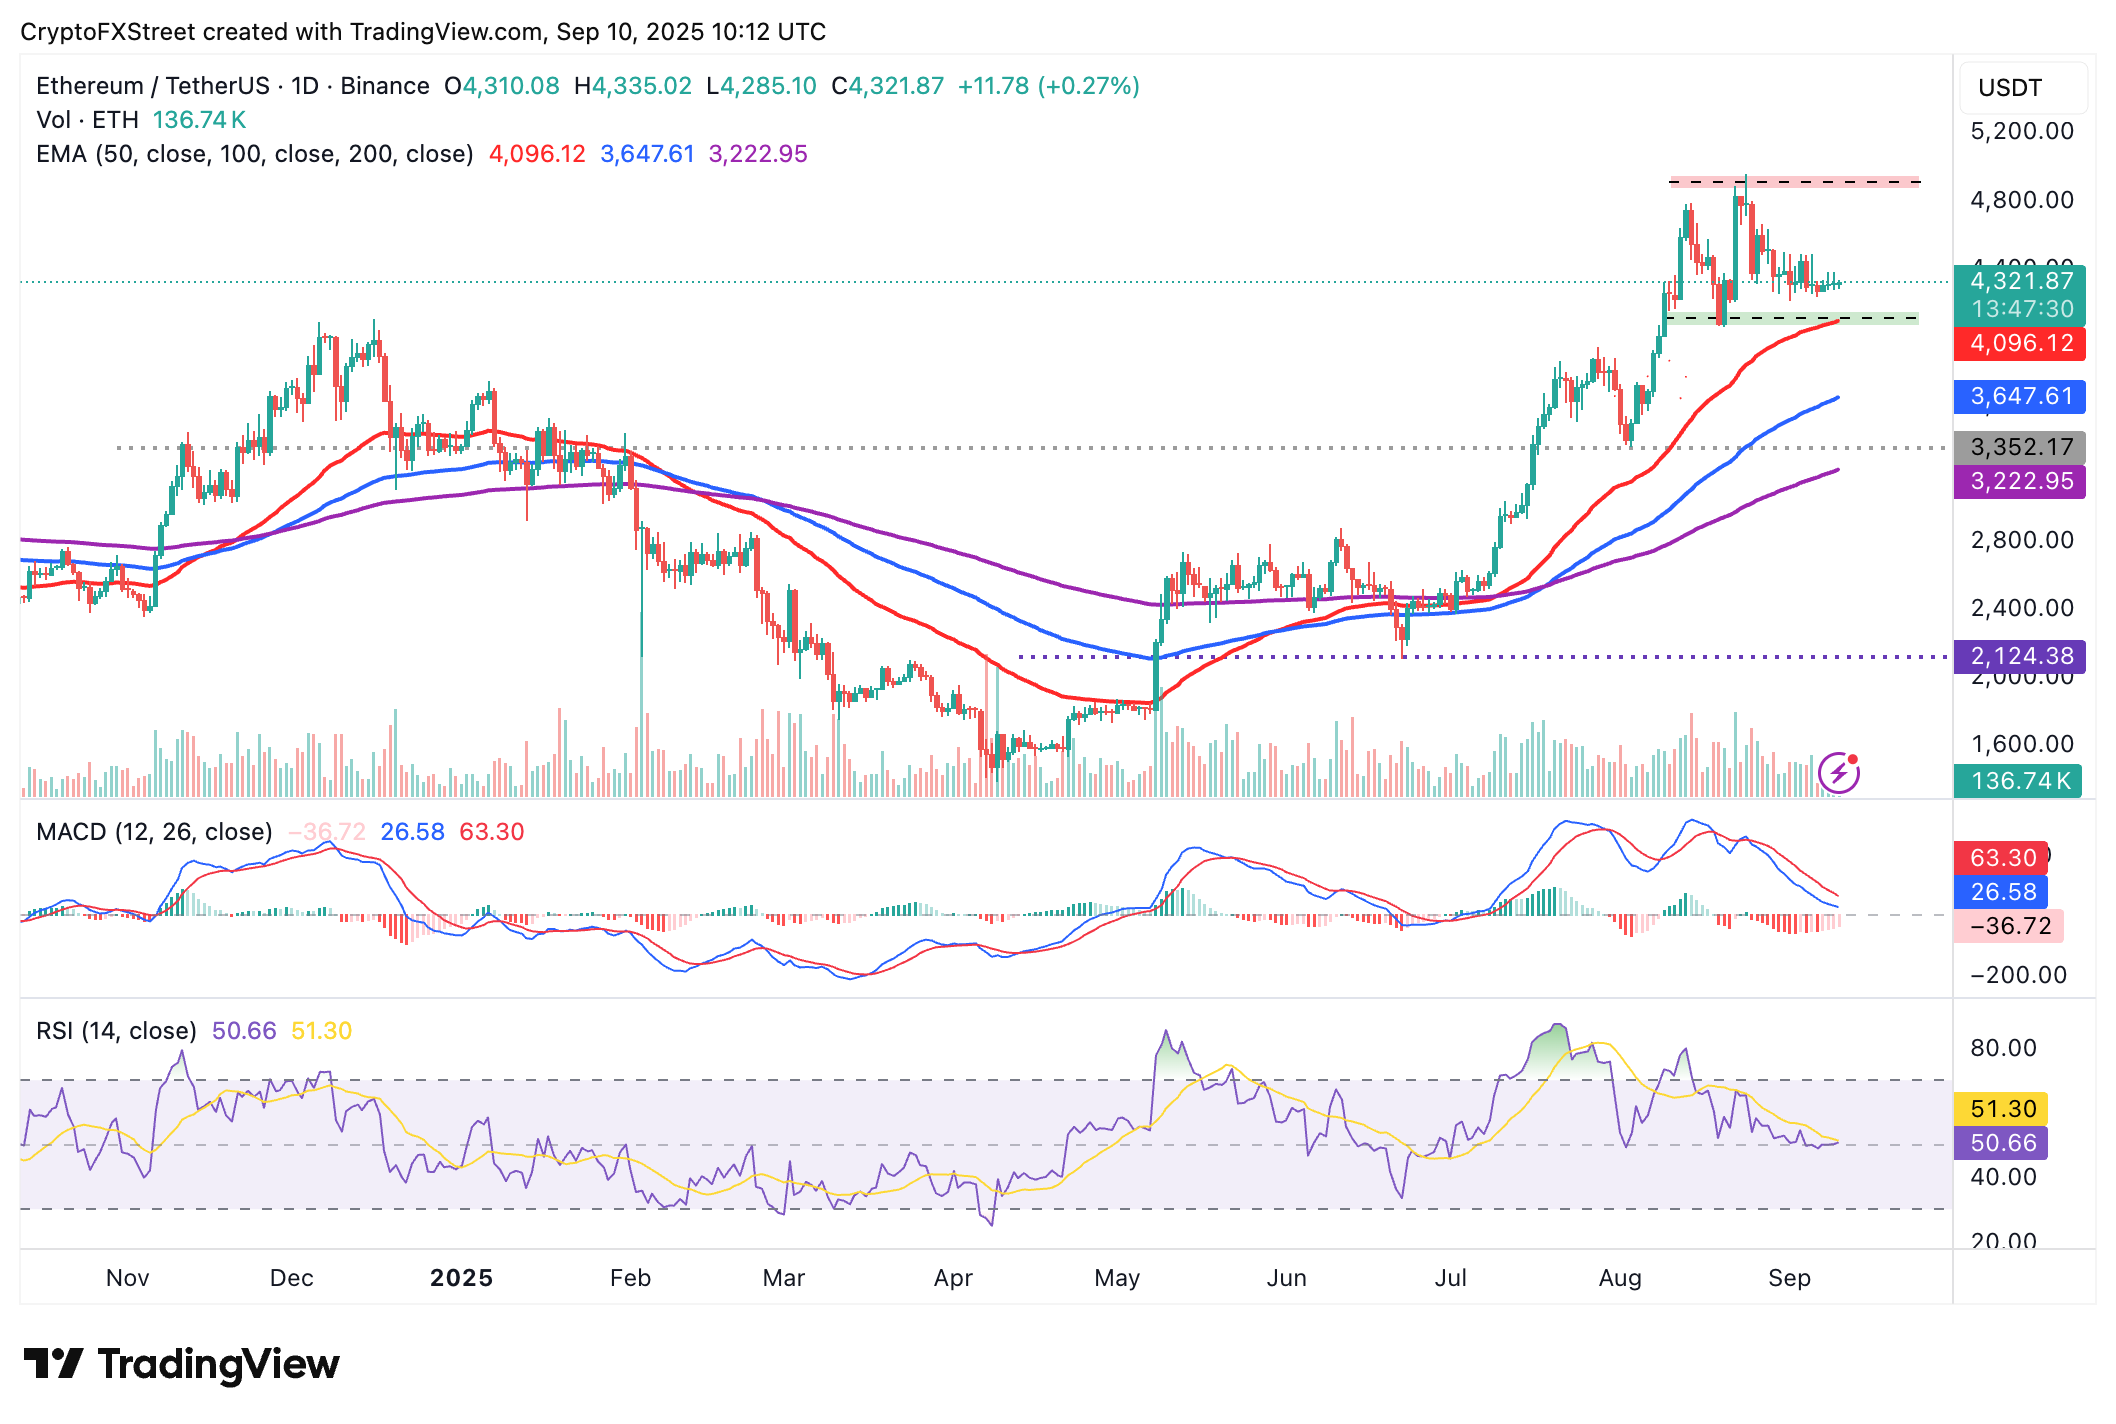
ETH/USDT daily chart
Regarding XRP, buyers are striving to overcome the resistance at $3.00 and advance towards the next key level at $3.35. A descending trendline reinforces the resistance around $3.00, as illustrated on the daily chart.
Key indicators to watch include the MACD, which has maintained a buy signal since Sunday, and the RSI, currently stable at 52.
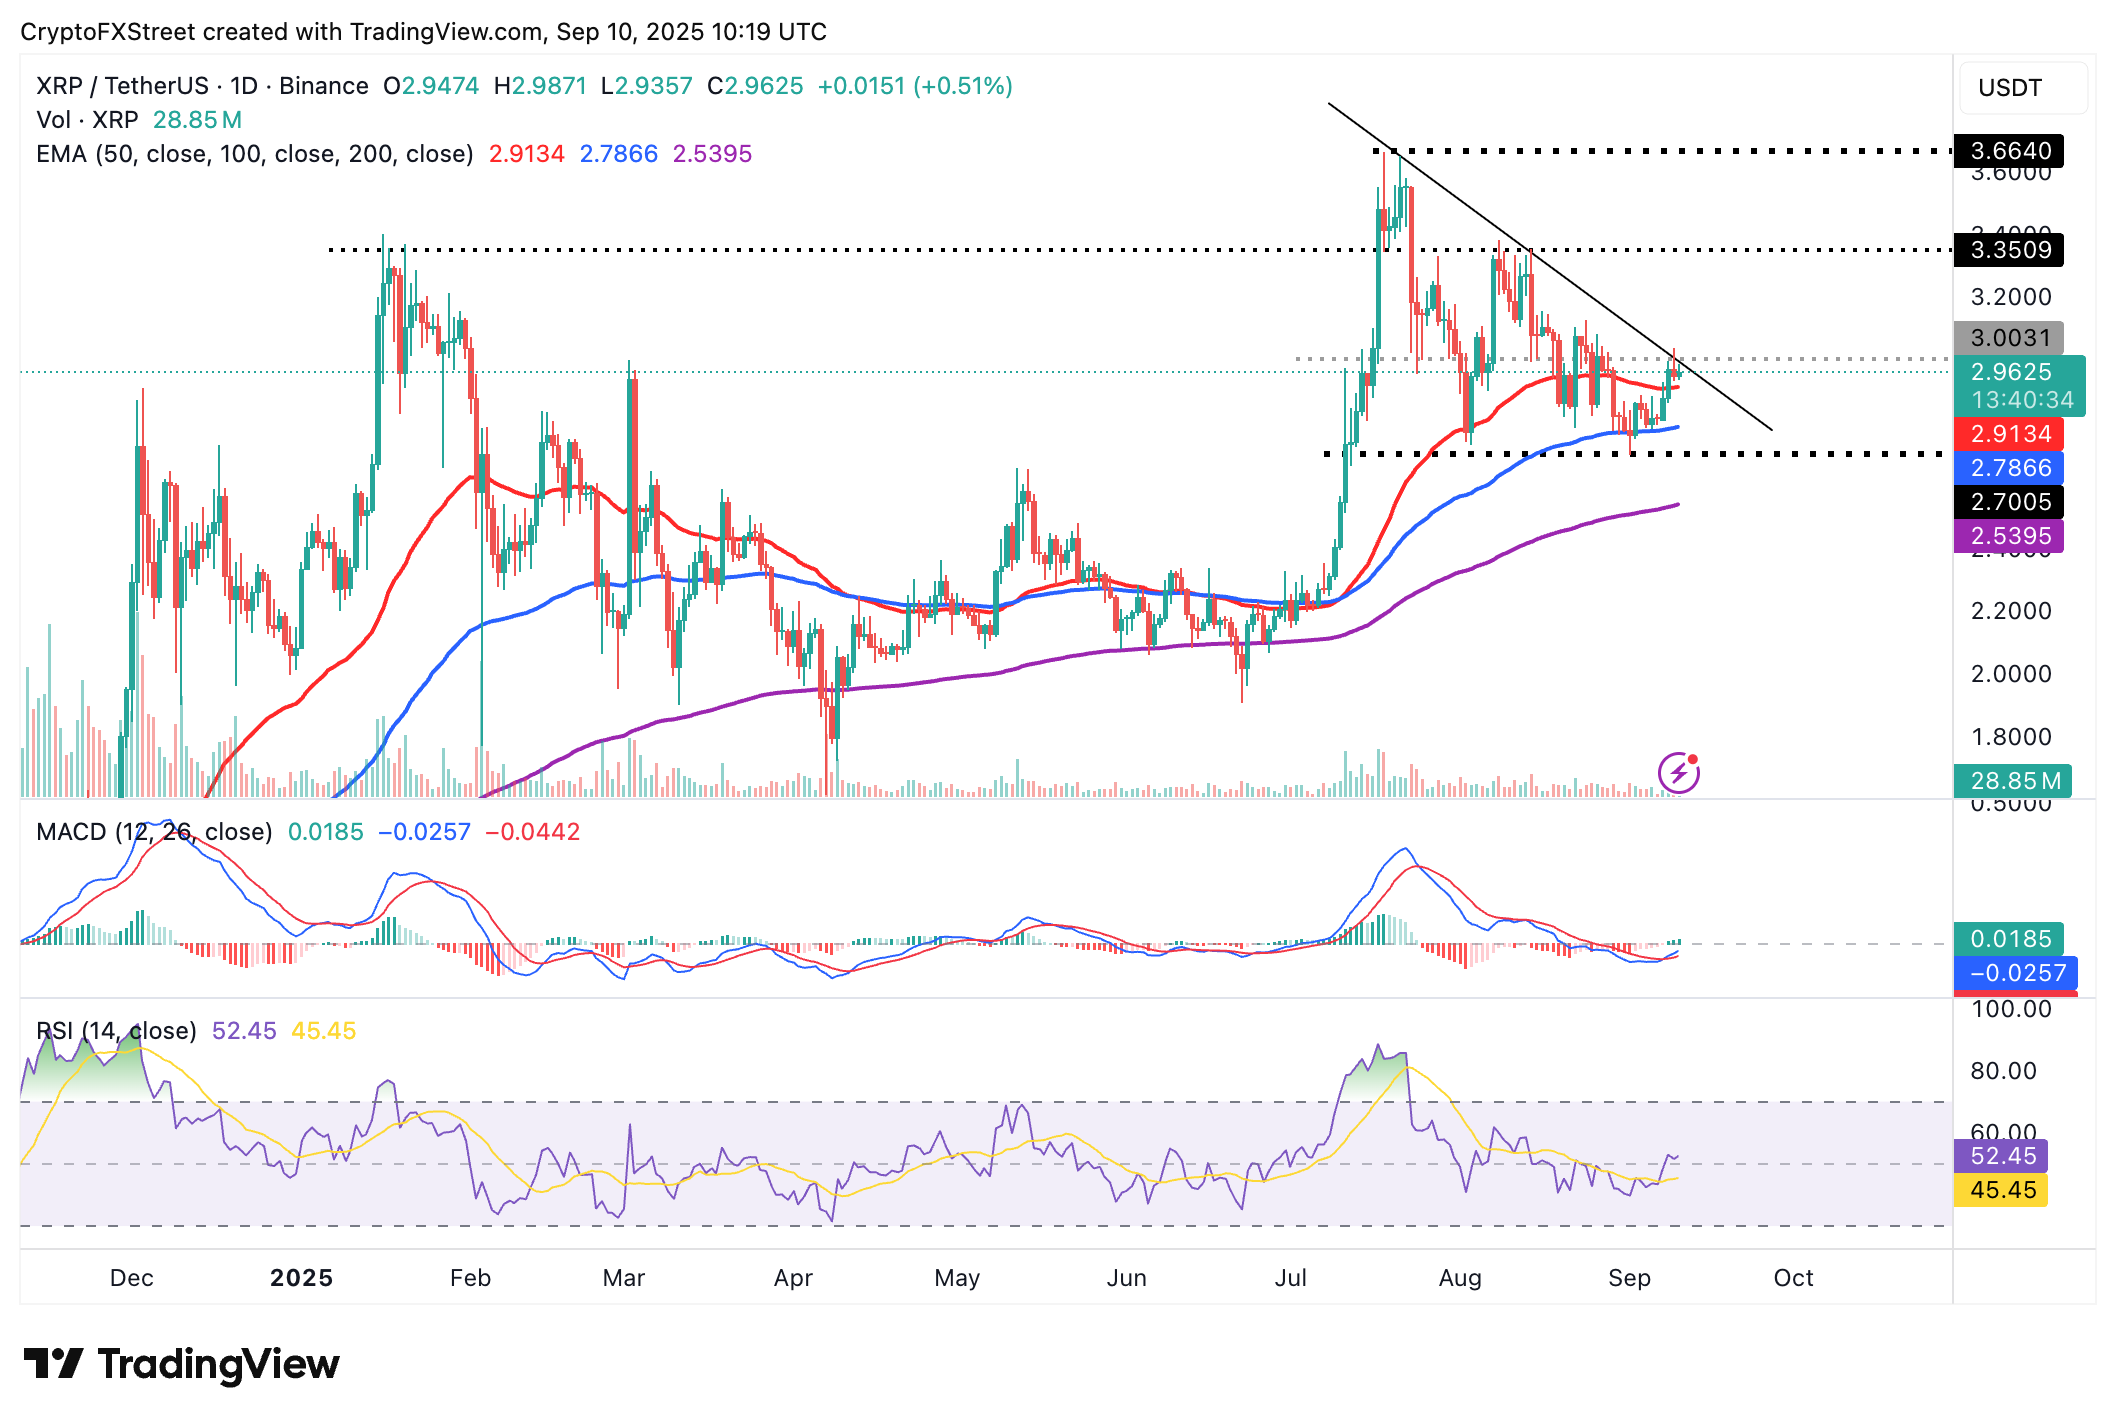
XRP/USDT daily chart
Bullish momentum is likely to strengthen as the RSI moves towards overbought territory. A daily close above the descending trendline and resistance at $3.00 would confirm the positive outlook.
Cryptocurrency prices FAQs
Disclaimer: For informational purposes only. Past performance does not guarantee future results.