

Bitcoin (BTC), Ethereum (ETH), and Ripple (XRP) are currently experiencing downward pressure near significant psychological levels, as the momentum from last week’s double-digit rally begins to fade. This correction reflects short-term adjustments as traders realize profits.
Bitcoin Struggles Below $80,000 Amidst Overbought Signals
As of Wednesday, Bitcoin is trading around $78,760, retaining a bullish sentiment following a remarkable 23% jump last week. The price remains above the 78.6% Fibonacci retracement level of $77,489, calculated from its drop between $82,850 and $57,800.
Bitcoin encounters resistance near the $80,000 mark, which acts as a barrier to re-approaching the $82,850 peak. A confirmed breakout past these resistance levels could pave the way for a move towards the 127.2% Fibonacci extension level at $89,663, closely nearing the $90,000 milestone.
Momentum appears to be slowing on the daily chart, with the Relative Strength Index (14) nearing 80, indicating overbought conditions and an extended rally. Meanwhile, the Moving Average Convergence Divergence (MACD) line and the signal line continue their upward trend, although the histogram shows signs of diminishing strength.
On the downside, immediate support is positioned at the 78.6% retracement level of $77,489, while important mid-term supports are highlighted by the 200-day Exponential Moving Average (EMA) at $72,797 and the 50% retracement level at $70,325.
Ethereum Holds Steady Below $2,500 as Buyers Take a Breather
Ethereum is currently hovering above $2,400 on Wednesday, maintaining a bullish outlook as the price stays above the 50-day EMA at $2,022 and the 200-day EMA at $2,146. The prominent altcoin is testing the 50% retracement level at $2,476, measured from a high of $3,447 to a low of $1,505.
From a technical viewpoint, the $2,500 psychological level strengthens the $2,476 resistance mark. A clear breakout surpassing $2,500 could propel the ETH rally towards the 78.6% Fibonacci retracement level at $3,031.
Momentum remains robust, with the RSI at 75, indicating an overbought condition, while the MACD stays positive, suggesting that buyers are still in control of the near-term market trend.
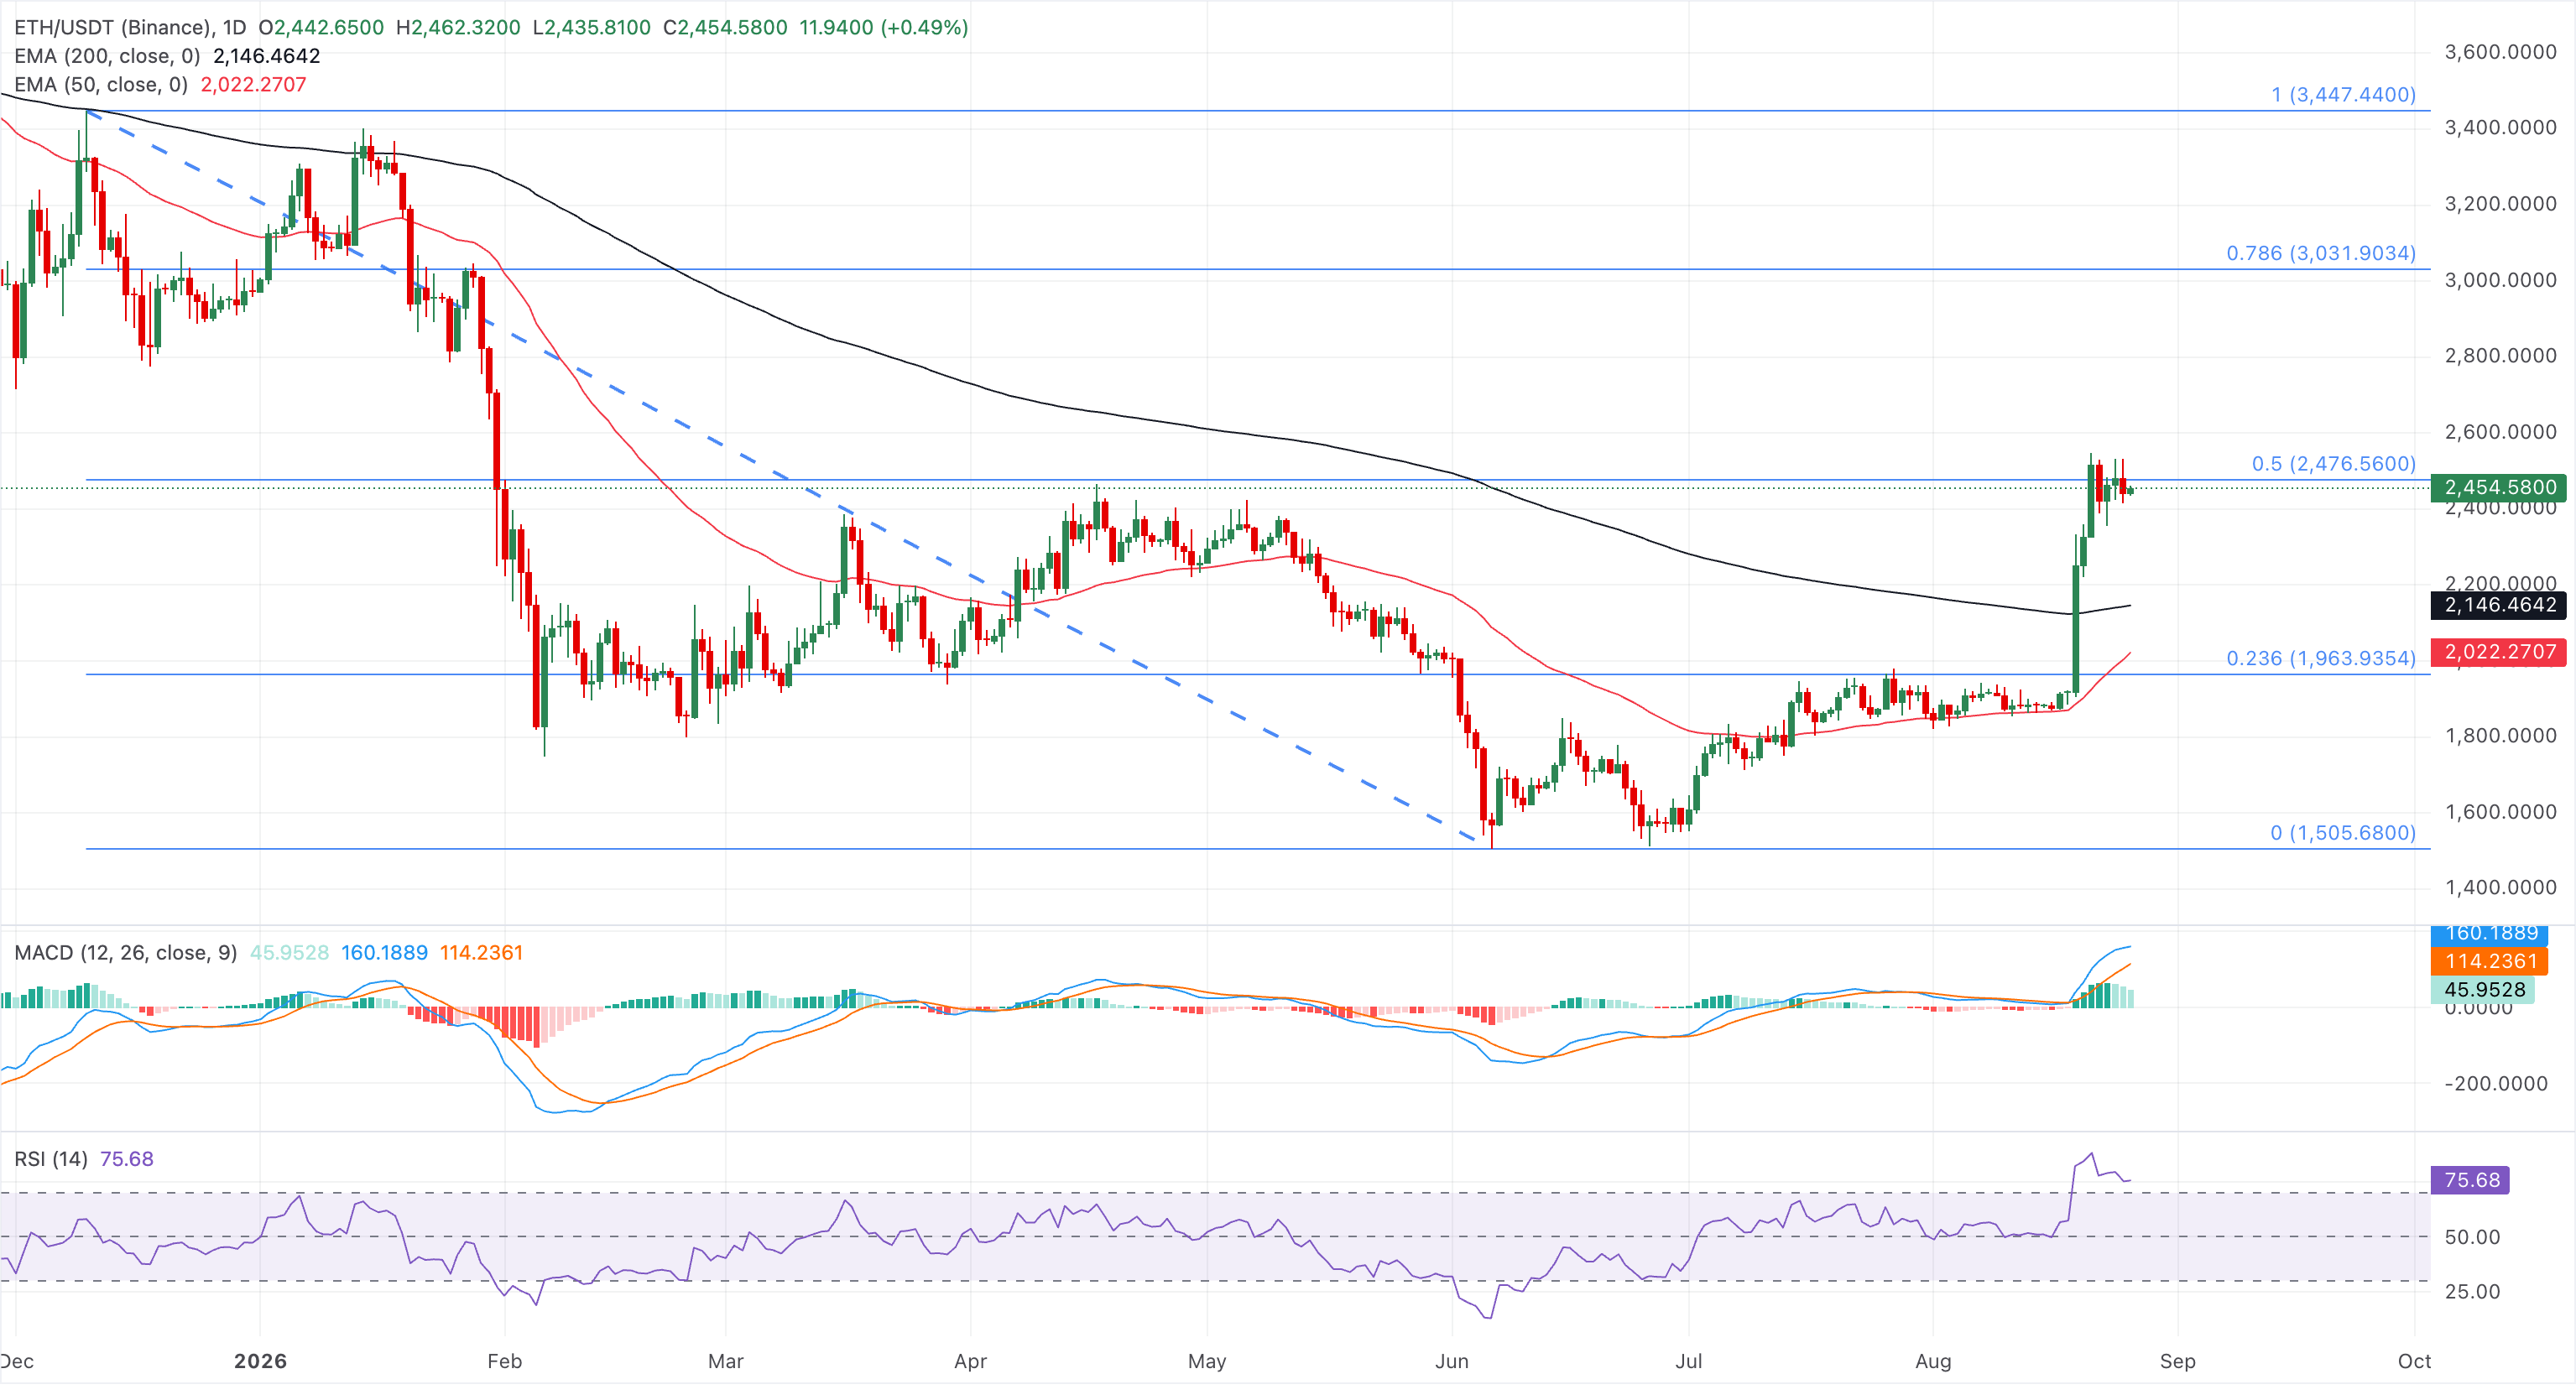
On the downside, initial support is marked at the 200-day EMA of $2,146, followed closely by the 50-day EMA at $2,022. A more significant pullback could target the 23.6% retracement at $1,963.94, while the swing low of $1,505.68 remains a distant structural support.
Ripple Experiences Downward Pressure
Ripple is trading around $1.4397 on Wednesday, remaining firmly above the 50-day EMA at $1.1646 and the 200-day EMA at $1.3822, thus preserving a bullish bias. XRP has seen a 5% decline this week, indicating a phase of profit-taking near the $1.50 psychological level.
The immediate support for XRP aligns with the 200-day EMA at $1.3822, providing a cushion against a drop towards the $1.2700 support area.
The RSI at 74 is still in the overbought range, suggesting strong but potentially exhausted upward momentum, while both the MACD and signal line remain upward, indicating that buying pressure is still prevalent.
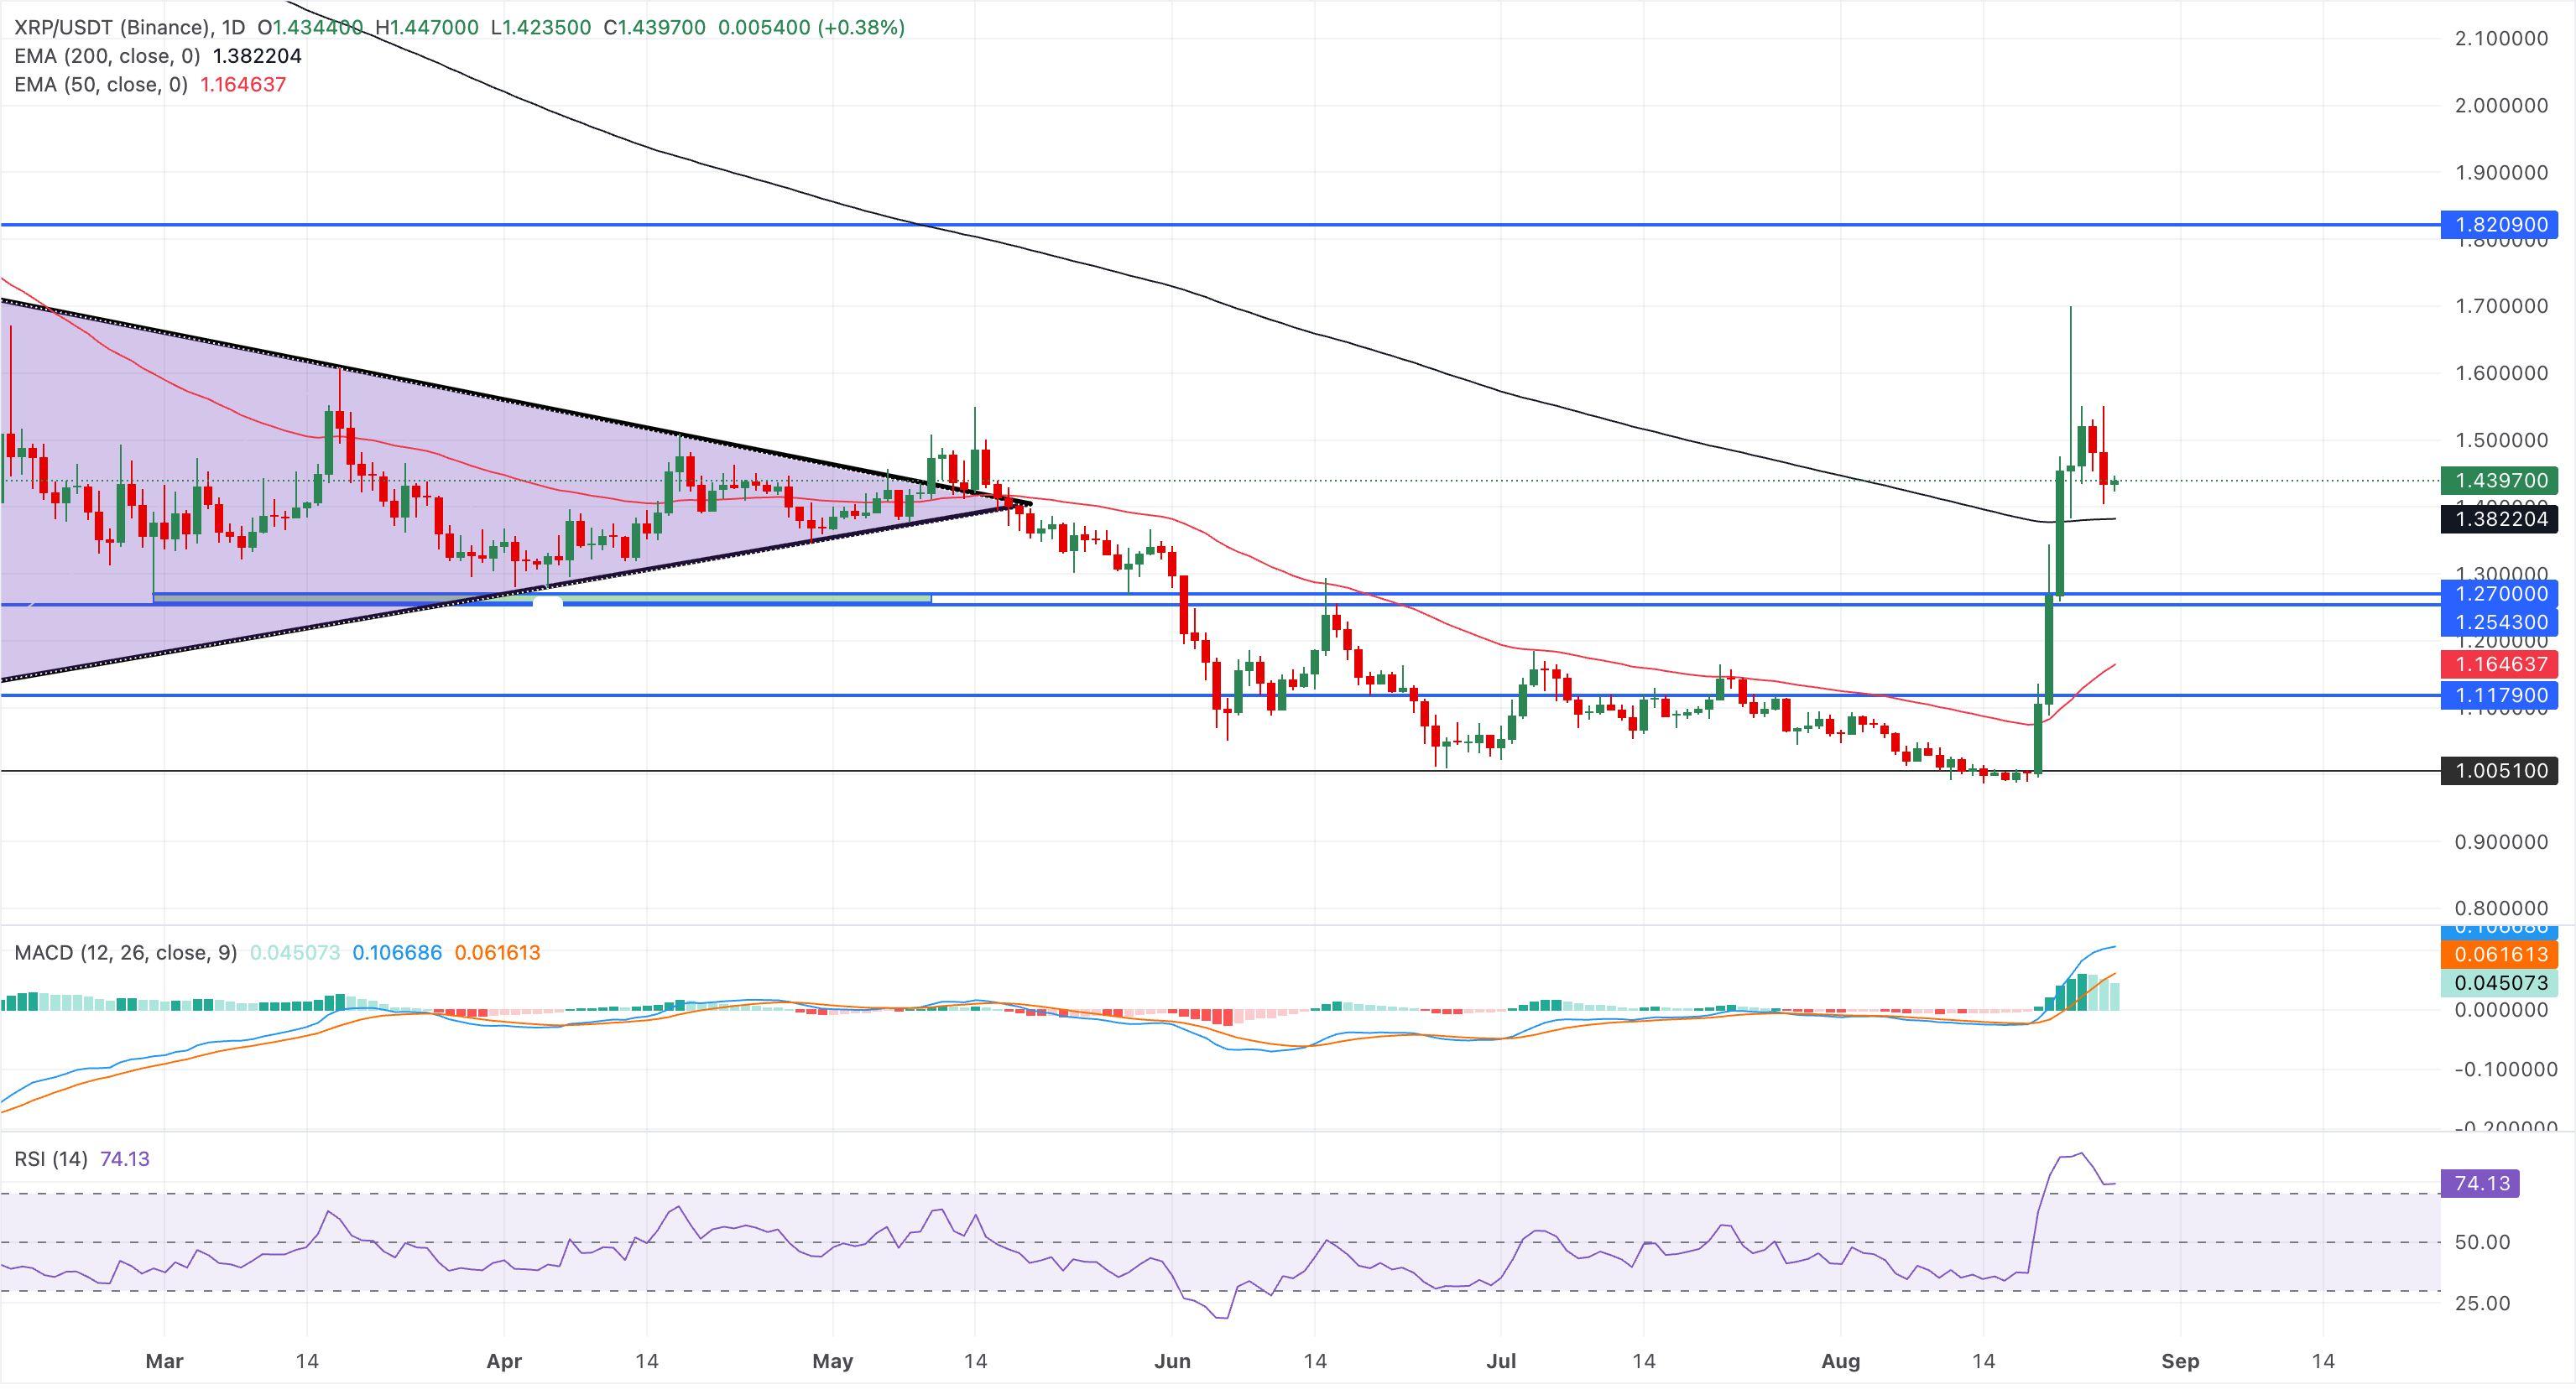
XRP needs to confirm a breakout past $1.50 with a decisive daily close to rekindle the rally, potentially aiming for the November 21 low at $1.8209.
This technical analysis was conducted with assistance from an AI tool. Learn more.