Key Takeaways
- Bitcoin Cash (BCH) is experiencing a surge, climbing 6% due to strong buyer interest and positive technical signals.
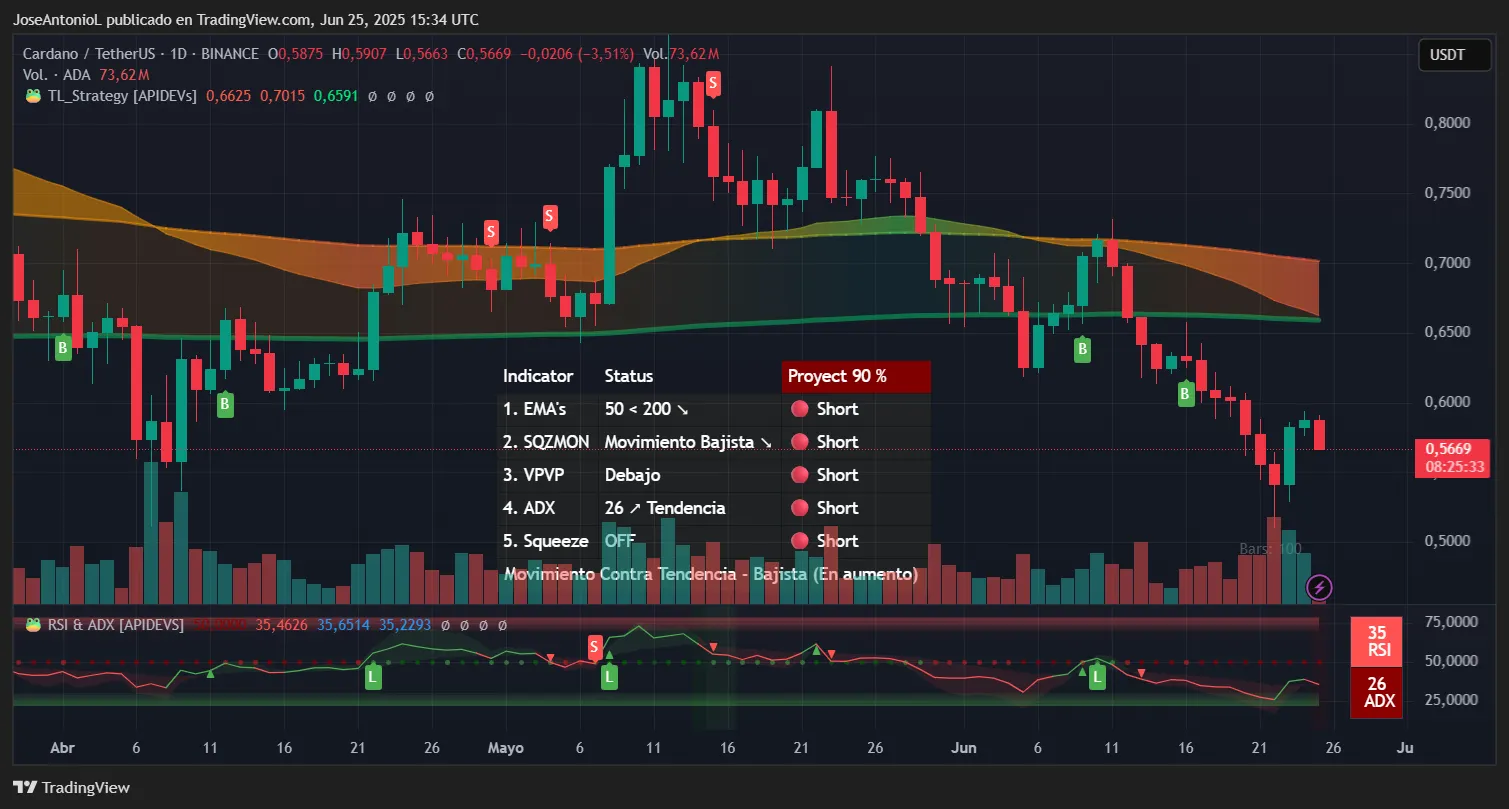
- Cardano (ADA) faces headwinds, dropping 3.5% and falling below crucial moving averages, indicating potential bearish conditions.
- The Federal Reserve has maintained current interest rates, leaving cryptocurrency traders awaiting clearer direction regarding future monetary policy.
The market appears to have already factored in the impact of the recent truce between Israel and Iran, with trading activity calming down following the significant price fluctuations earlier in the week. Only a couple of coins (Pi and Maple Finance) show gains exceeding 10%. The average price change for the top 100 cryptocurrencies, based on market capitalization, hovers around a modest 2%, both upward and downward.
Overall, cryptocurrency traders are leaning towards a bullish outlook. The total market capitalization of the cryptocurrency sector has risen to $3.283 trillion, representing a slight increase of 0.81% compared to yesterday.
Traditional financial markets are also showing relative stability, with the S&P 500 edging upward to 6,097 points, a gain of 0.07% from the previous trading session. The Federal Reserve’s decision to keep interest rates unchanged in the range of 4.25%-4.5% has fostered an atmosphere of watchful waiting. Fed Chair Jerome Powell communicated that the central bank is “well positioned to wait” for more definitive economic signals before taking further action. Looking ahead, predictions on Myriad Markets—a prediction market developed by Dastan, which also owns Decrypt—indicate that traders anticipate the Nasdaq will outperform the S&P 500 in June.
As usual, some cryptocurrencies are outperforming others. Today, Bitcoin Cash and Cardano are attracting significant trader interest, potentially driven by a desire to inject some excitement into an otherwise uneventful market day.
Bitcoin Cash (BCH) Shows Strength
Bitcoin Cash, a well-known offshoot of Bitcoin, has shown considerable strength today, advancing roughly 6% to a price of $481.30. It successfully surpassed the $470 resistance level, a price ceiling that had largely contained its upward movement throughout the month. This breakout was supported by substantial trading activity and a confluence of bullish technical indicators.
The Relative Strength Index (RSI) currently reads 61, a healthy level indicative of strong bullish momentum without yet entering overbought territory. This suggests that buyers are in control, while still leaving room for further gains before hitting the overbought threshold of 70+, where profit-taking often takes place. The RSI assesses the velocity and magnitude of price changes, and readings between 50 and 70 are commonly interpreted as signs of bullish momentum.
The Average Directional Index (ADX) stands at 20, just below the crucial threshold of 25, which is needed to confirm the establishment of a robust trend. Although this suggests the trend is currently developing and remains relatively weak, its upward trajectory implies that momentum is building towards a more definitive breakout. The ADX gauges the strength of a trend, irrespective of its direction. Values exceeding 25 typically signal robust trending conditions that traders often monitor closely.
Moving Average Insights: BCH is currently trading well above both its 50-day EMA (around $385) and its 200-day EMA (near $352). This is creating a widening gap, often referred to as “moving average divergence.” This growing separation is an indication of a strong, sustained trend. The 50-day EMA, which calculates the average price over roughly 2.5 months, often serves as a dynamic support level in an upward trend, whereas the 200-day EMA is indicative of the broader market direction. With the 50-day EMA positioned above the 200-day EMA, short-term momentum is outpacing the longer-term trend; recent buyers are paying notably more than those who invested 200 days ago, and the widening distance between these two lines suggests that the buying pressure remains intense.
The Squeeze Momentum Indicator is currently showing an “ON” status with an upward direction, suggesting that price compression is being released to the upside. This indicator identifies periods when volatility contracts before major price movements—the “ON” reading indicates the squeeze is active and momentum is building. This suggests caution, either signaling a potential strong price break in a positive direction, or a substantial correction on the horizon.
In summary, BCH is currently experiencing an upward trend, but the indicators provide mixed signals, which may lead traders to view its current price level as a challenging area.
Key Price Levels to Watch:
- Immediate support: $460-$470 (the recent breakout zone is now acting as a support level)
- Strong support: $385 (50-day EMA)
- Immediate resistance: $500 (a psychological level and the next significant obstacle)
- Strong resistance: $540 (a projected target based on the recent consolidation phase)
Cardano (ADA) Under Pressure
Is interest waning within the Cardano community? During his recent live stream, Cardano founder Charles Hoskinson suggested that the Cardano Treasury consider liquidating nearly $100 million worth of ADA to acquire a mix of stablecoins, Bitcoin, and other synthetic assets.
This development can be interpreted in different ways. It could be a positive sign for the Cardano network, potentially enhancing DeFi liquidity and further decentralizing its structure to support long-term ecosystem growth. Alternatively, it could suggest the Cardano team is seeking to reduce its exposure to a cryptocurrency that hasn’t experienced a significant bullish cycle since 2021.
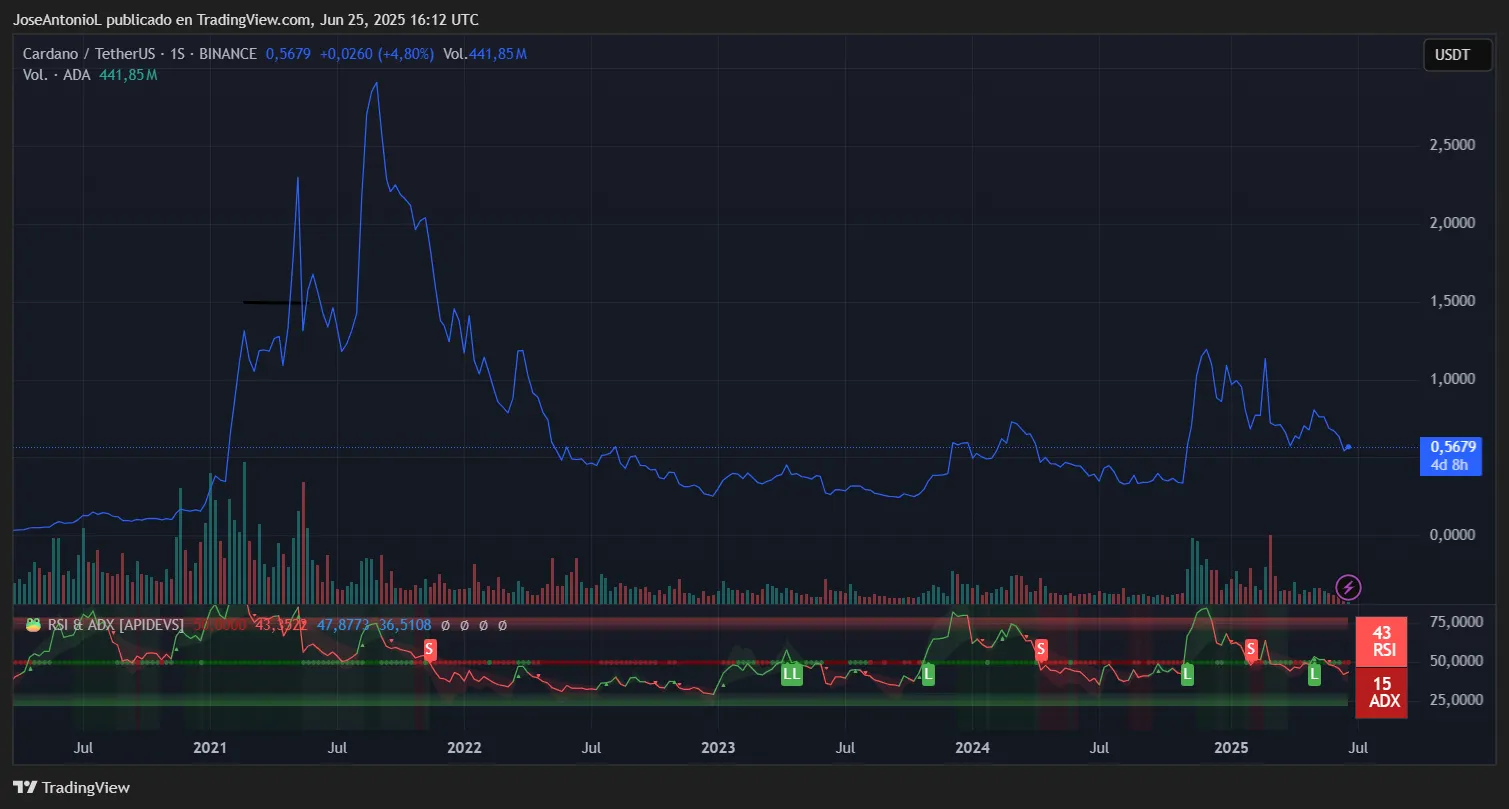
Over the past 24 hours, markets appear to have responded negatively to this news. ADA has declined by a significant 3.5%, reaching a value of $0.5669 as several technical indicators began signaling bearish trends.
The price action suggests that ADA is struggling to hold onto key support levels amidst a broader weakness in the altcoin market.