

Cryptocurrency values are experiencing a slight decline on Thursday, as Bitcoin (BTC) approaches the near-term support level at $78,000. Other digital currencies, such as Ethereum (ETH) and Ripple (XRP), are reflecting Bitcoin’s cautious trend, with ETH dropping to around $2,470 and XRP down to $1.38.
Even in the face of a broad price correction, the appetite for risk assets remains strong, with the Fear & Greed Index showing a sentiment score of 69, indicating a state of Greed, an increase from 66 the previous day. If this sentiment persists, it could provide a supportive environment for a potential breakout.
“Bitcoin has been consolidating within a narrow range for about two weeks, successfully defending the $77,000 support level, and is currently testing the upper limits of that range,” stated Yusuf Fakhro, a Partner at ARP Digital. He further mentioned, “a market that absorbs a sharp price shift rather than reversing is one that has truly adjusted its valuation.”
Meanwhile, investors are closely watching developments in the Middle East, as Iranian-backed Houthi forces intensify their attacks on Saudi energy infrastructure and shipping in the Red Sea. This situation has led to a steady rise in crude oil prices, prompting a more cautious approach from investors. Attention is also focused on the upcoming US Consumer Price Index (CPI) report set for Friday and the Federal Reserve’s monetary policy announcement next Wednesday.
“Bitcoin is particularly sensitive to changes in US interest rate expectations, with Thursday’s upward movement following dovish signals from the Fed before strong payroll data reversed that trend, leaving prices relatively unchanged for the week,” a report from K33 Research noted. The report added, “as the upcoming FOMC meeting approaches, Thursday’s PPI and Friday’s CPI data could be significant volatility triggers, while the Senate’s cloture vote on the CLARITY Act on September 15 introduces an event specific to the crypto sector.”
Technical Analysis: Bitcoin Tests Support Levels
Currently, Bitcoin is trading at $78,094, signalling a generally bullish outlook as it remains above major Exponential Moving Averages (EMAs), suggesting that the overall upward trend is still intact despite the recent adjustments from peak values.
The momentum indicators appear mixed; the Relative Strength Index (RSI) has dropped to around 59 from previous overbought conditions, indicating a neutral but positive tone. Meanwhile, the Moving Average Convergence Divergence (MACD) has shifted further into negative territory, hinting at reduced upward pressure and indicating the likelihood of continued consolidation rather than immediate bullish movement.
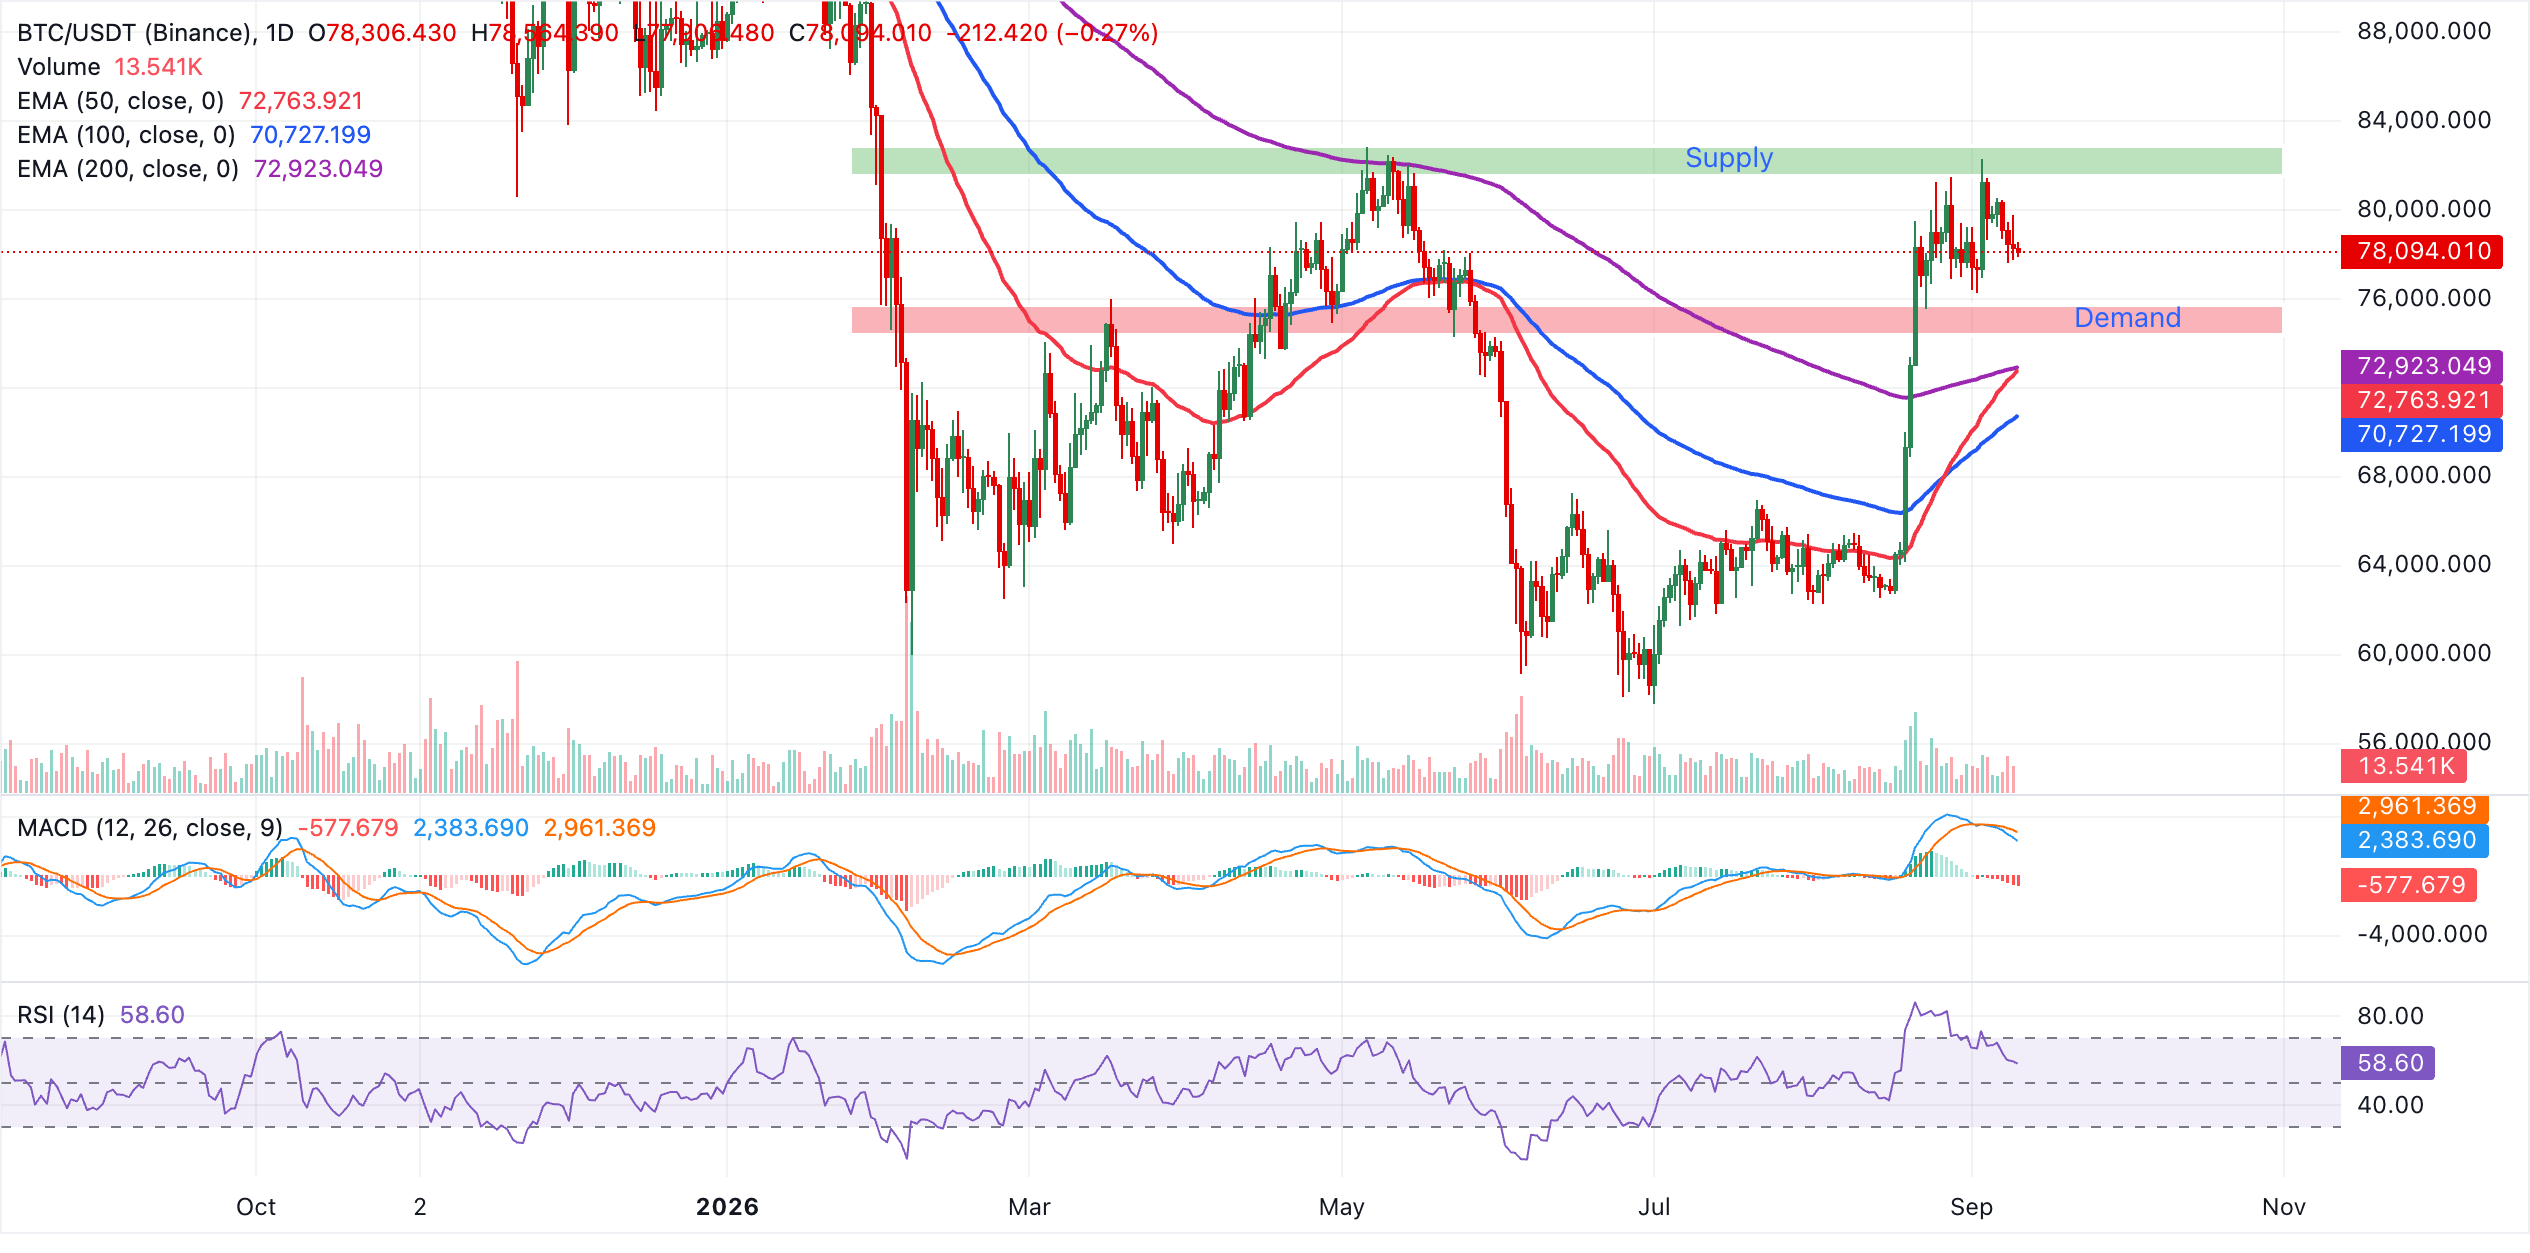
Immediate support is found around $78,094, with additional backup from the clustering of the 200-day EMA near $72,923 and the 50-day EMA just below $72,764, creating a solid demand area that could attract buyers should prices continue to dip.
Further down, the 100-day EMA near $70,727 acts as another critical support level that would need to be breached to signal a more substantial trend decline. With no distinct overhead resistance levels indicated, the upward trajectory of the pair will likely depend on the pace at which momentum can recover. Stabilization in MACD and a renewed rise in RSI toward overbought levels would strengthen the bullish argument for Bitcoin as it seeks to regain its upward momentum.
Altcoin Outlook: Ethereum Consolidates, XRP Dips
Ethereum continues to show a strong bullish bias, staying well above the 50-day, 100-day, and 200-day EMAs clustered between around $2,120 and $2,220, indicative of a solid medium-term uptrend.
The RSI at about 61 suggests ongoing positive momentum; however, the MACD remains below zero, indicating a bearish stance and suggesting that upward movement is slowing even as the overall structure appears supported.
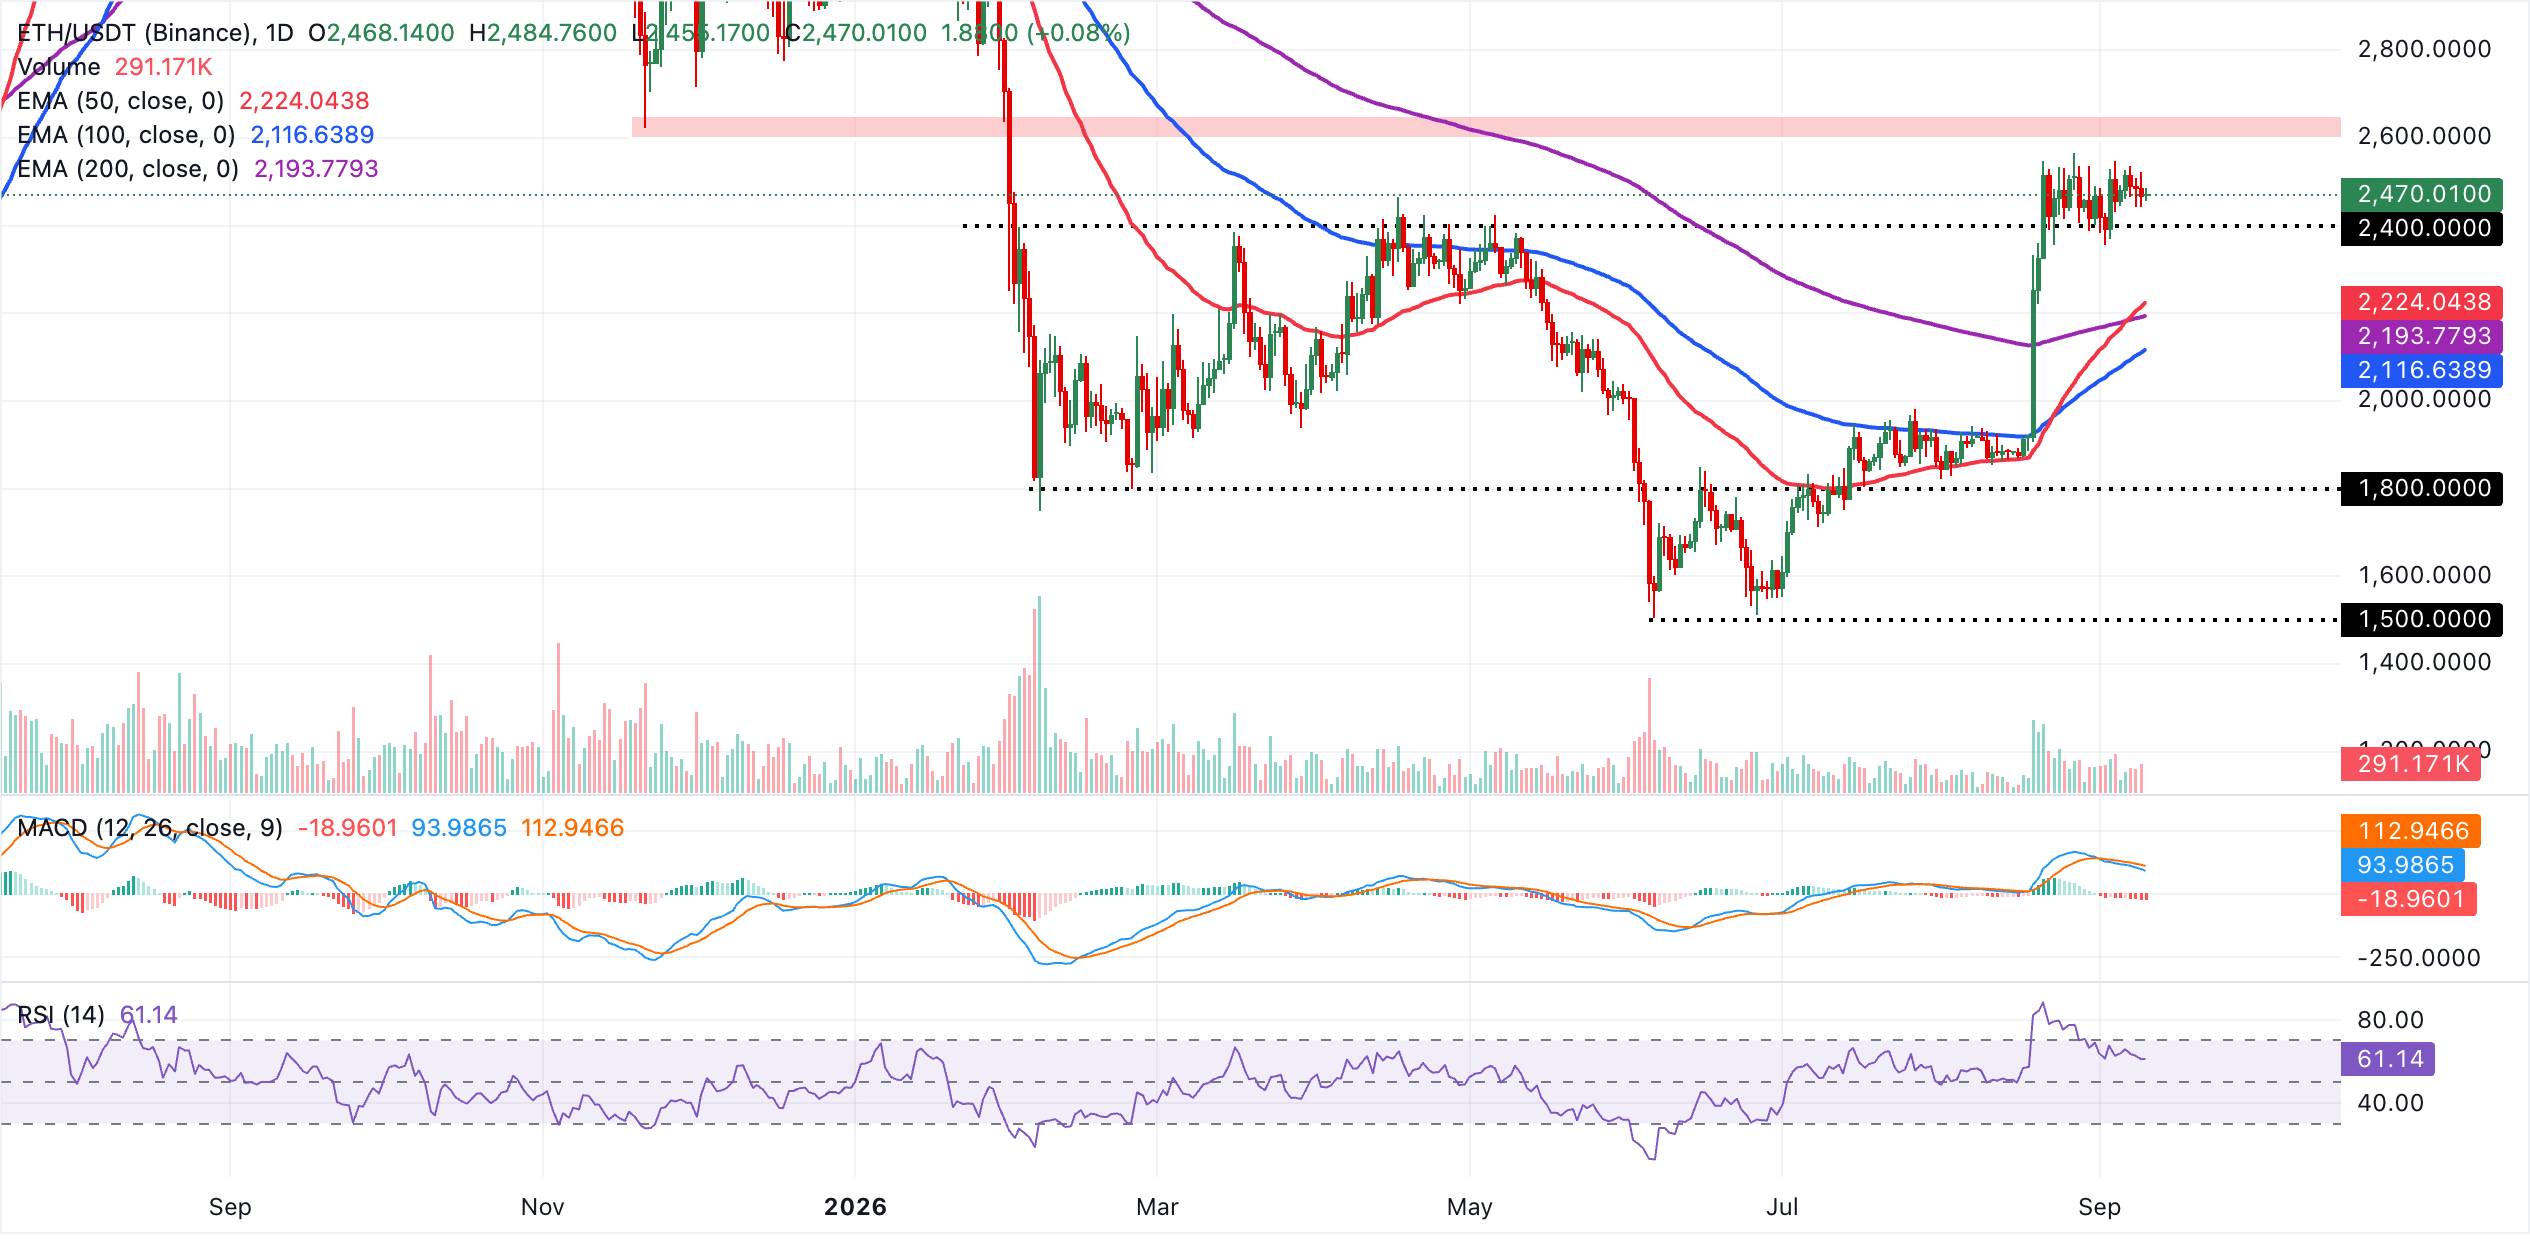
Immediate support is identified at the latest price pivot around $2,470, backed by the 50-day EMA at $2,224 and further supported by the 200-day EMA at $2,194 and the 100-day EMA at $2,117. As long as ETH remains above this EMA cluster, any pullbacks are likely viewed as corrections rather than a reversal of the trend. A sustained drop below the 200-day EMA would be necessary to seriously challenge the existing bullish framework.
Regarding XRP, the token maintains a favorable short-term outlook, trading above the 50-day, 100-day, and 200-day EMAs, with the 200-day EMA at $1.36 serving as the nearest dynamic support. The short-term EMA alignment remains favorable, suggesting that the broader uptrend is still in place, although the Parabolic SAR at $1.58 is capping the upside potential and indicating overhead resistance.
Momentum appears mixed as the RSI hovers around 56 in a neutral-to-positive range, while the MACD stays below zero, indicating that bullish pressure is easing rather than intensifying.
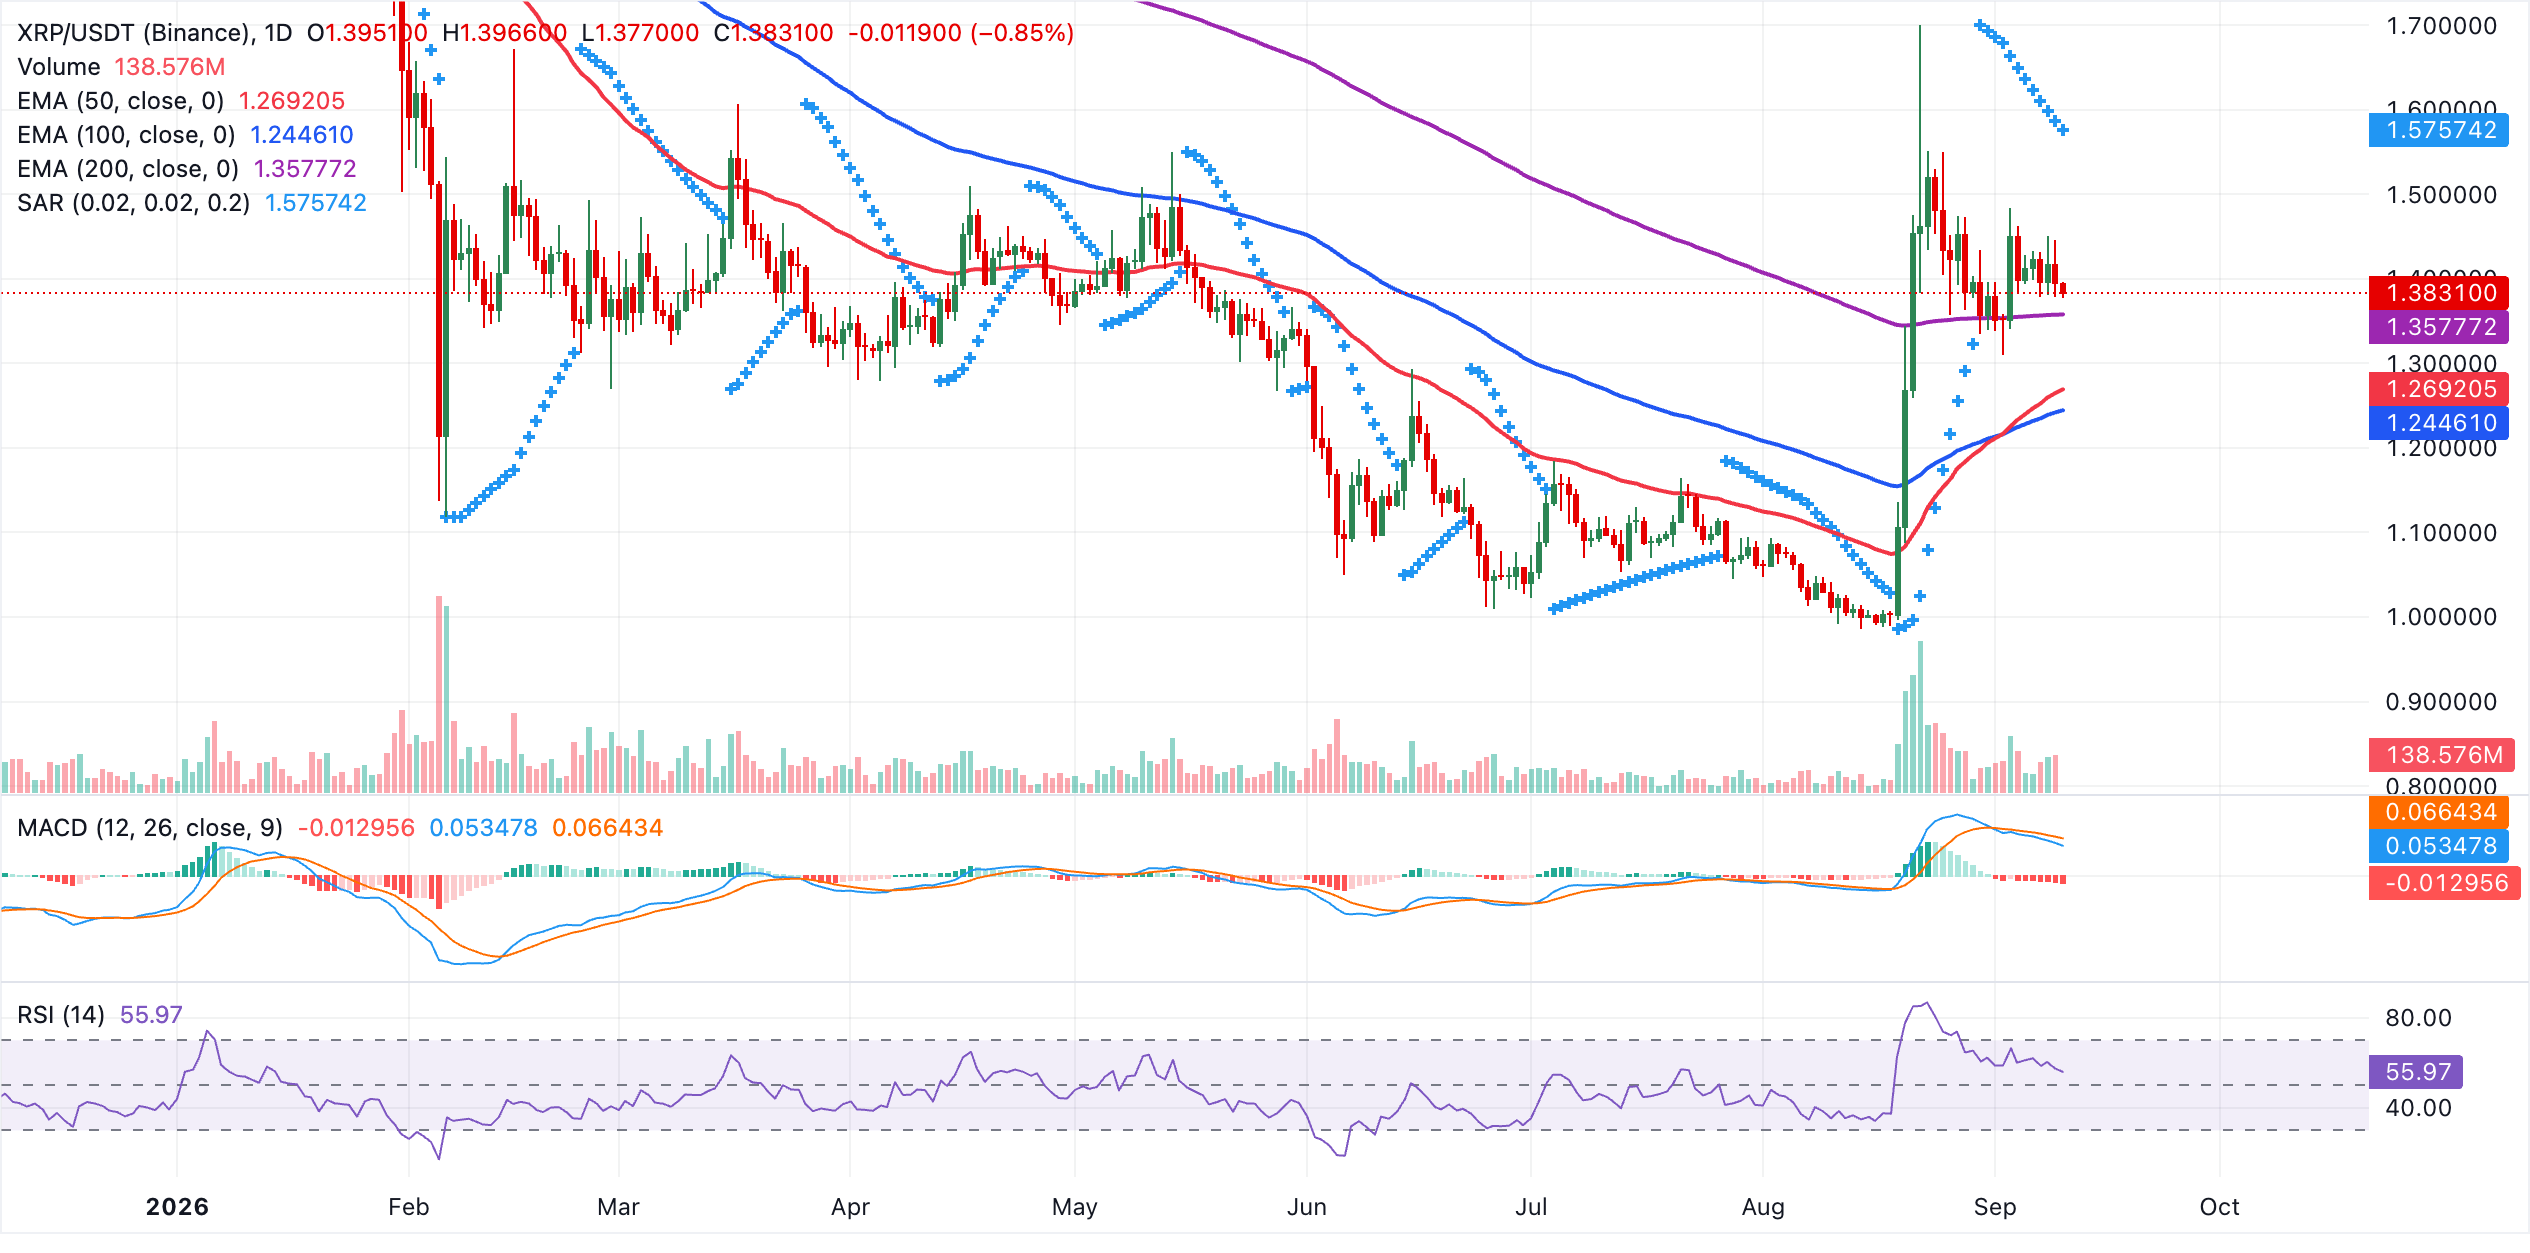
On the downside, immediate support is pinned at the 200-day EMA around $1.36. A close below this level would expose the 50-day EMA at $1.27, followed by the deeper support of the 100-day EMA near $1.24. On the upside, the next critical resistance is defined by the Parabolic SAR at $1.58, a sustained break above this threshold would renew bullish momentum and reinforce the upward trend.
(This technical analysis was developed with assistance from an AI tool. Know more.)
Frequently Asked Questions about Bitcoin, Altcoins, and Stablecoins
Bitcoin is the leading cryptocurrency by market cap and is designed to function as a form of money. This digital currency operates independently of any single individual, group, or entity, eliminating the requirement for third-party involvement in transactions.
Altcoins refer to all cryptocurrencies other than Bitcoin, although some consider Ethereum as a primary cryptocurrency due to its role in forking. If this is accepted, Litecoin can be considered the first altcoin, a derivative of Bitcoin and regarded as an “enhanced” version.
Stablecoins are cryptocurrencies aimed at maintaining a stable value, secured by a reserve of the underlying asset. Typically, a stablecoin’s value is pegged to a commodity or a financial instrument such as the US Dollar (USD), and its supply is managed by algorithms based on demand. The primary purpose of stablecoins is to offer a reliable medium for trading and investing in cryptocurrencies while enabling investors to preserve value amidst market volatility.
Bitcoin dominance refers to the percentage of Bitcoin’s market cap relative to the total market capitalization of all cryptocurrencies. This metric gives insight into investor interest in Bitcoin. High BTC dominance is often seen before and during bull markets when investors turn towards stable, high-cap cryptocurrencies like Bitcoin. Conversely, a decrease in BTC dominance generally suggests that investors are reallocating their assets and profits to altcoins in search of higher returns, leading to significant altcoin rallies.