

As of Friday, Chainlink (LINK) has experienced a slight price dip of around 2%, currently navigating near its 50-day Exponential Moving Average (EMA), which sits at approximately $22.15. Examination of on-chain data and derivatives market activity suggests a possible increased risk of further price declines. This is potentially linked to decreased engagement from both retail traders and significant investors, often called whales. Analyzing the technical analysis reveals a critical support zone that might influence LINK’s price movement within an established symmetrical triangle pattern.
Headwinds Influenced by Large Wallet Activity
Chainlink is encountering resistance, partly due to reduced interest from investors holding substantial amounts of the cryptocurrency. On-chain data indicates that these LINK whales are taking profits. Santiment data concerning Network Realized Profit/Loss, alongside transaction volumes exceeding $1 million, display multiple instances of profit-taking over the past couple of months. These instances seem correlated with trading behavior typically associated with whale activity.
A recent surge in profit realization, involving the movement of 84.98 million LINK tokens on Monday, coincided with 102 whale-level transactions. This suggests that larger investors are contributing to selling pressure in the market.
The profit-taking trend among major wallet holders started concurrent with a general increase in the percentage of LINK supply in profit, which initially happened following gains in July. As of Friday, around 88% of the total supply is showing profit, an increase from 84.75% observed on Monday. This change implies that selling pressure has eased noticeably after the initial wave of selling earlier in the week.
Chainlink on-chain data. Source: Santiment
Decline in Leveraged Positions by Traders
Retail demand for Chainlink also faces uncertainty, as the recent price decrease dampens the enthusiasm of traders using derivatives. Data from CoinGlass reveals a decrease of over 3% in LINK Open Interest (OI) within the last 24 hours, bringing it down to $1.32 billion.
Open Interest represents the aggregate value of all outstanding derivative contracts. A reduction in OI usually indicates traders are closing their positions, reflecting a more cautious market sentiment.
However, the OI-weighted funding rate for LINK remains elevated, above 0.0101%. This suggests that those holding long positions are still willing to pay premiums, indicating that a certain level of demand remains in the Chainlink derivatives market.
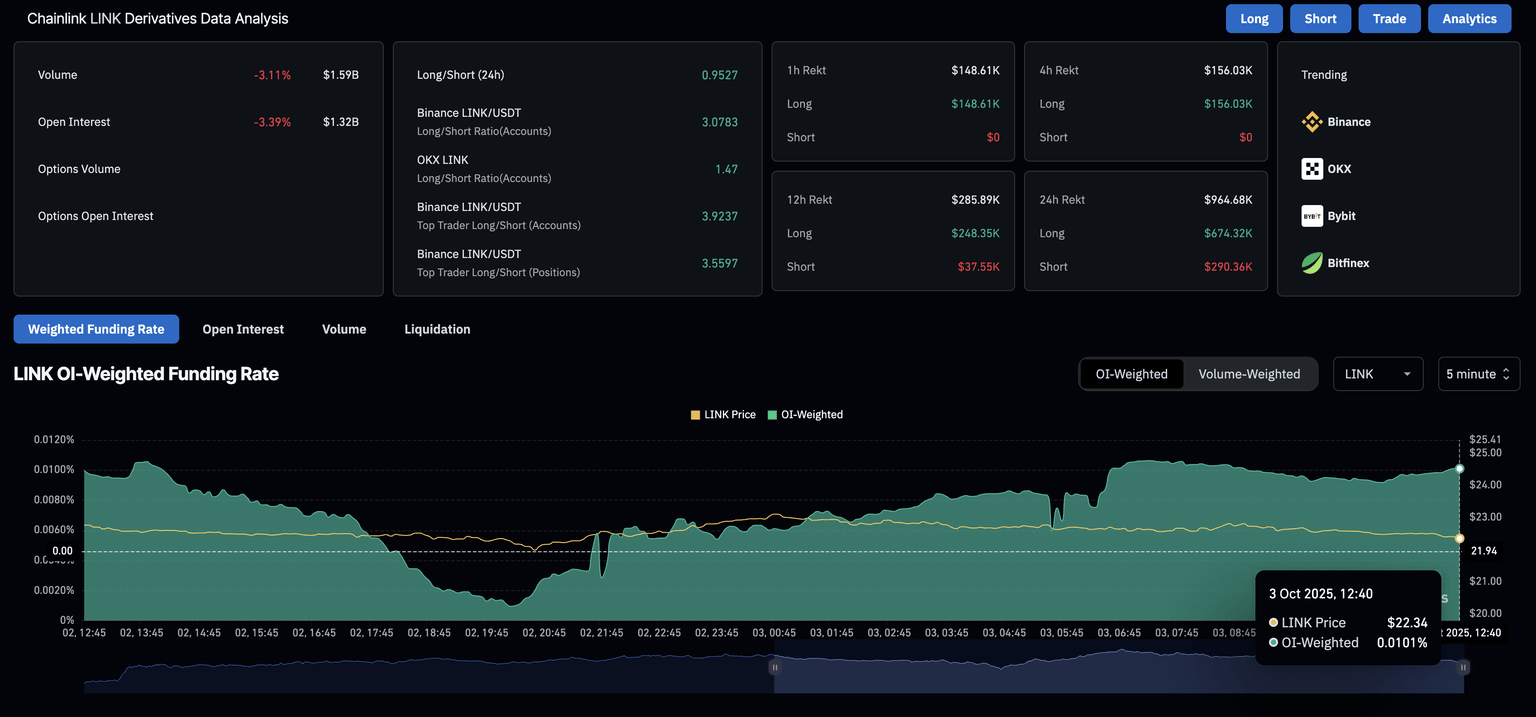
LINK derivatives data. Source: CoinGlass
In summary, the combination of decreasing Open Interest and sustained high funding rates suggests a market scenario where traders are either reducing their leveraged positions or closing existing long positions, despite an underlying bullish sentiment. This situation could lead to further consolidation or a price correction for Chainlink.
Chainlink Tests Support at 50-day EMA
As of Friday’s press time, Chainlink is trading down by approximately 2%, approaching its 50-day EMA around $22.15 after consecutive positive trading sessions. This movement introduces the possibility of an earlier-than-expected downturn within the larger symmetrical triangle pattern visible on the daily price chart.
A definitive drop below the 50-day EMA could lead to a retest of the triangle’s support trendline, located near the 100-day EMA at $20.68.
Momentum indicators present mixed signals on the daily chart. The Relative Strength Index (RSI) currently sits at 49, considered neutral, but shows a downward trend, suggesting a potential decrease in buying strength if the trend continues.
Concurrently, the Moving Average Convergence Divergence (MACD) remains relatively flat above its signal line, following a crossover on Thursday. This implies a lack of significant bullish momentum to support an upward trend.
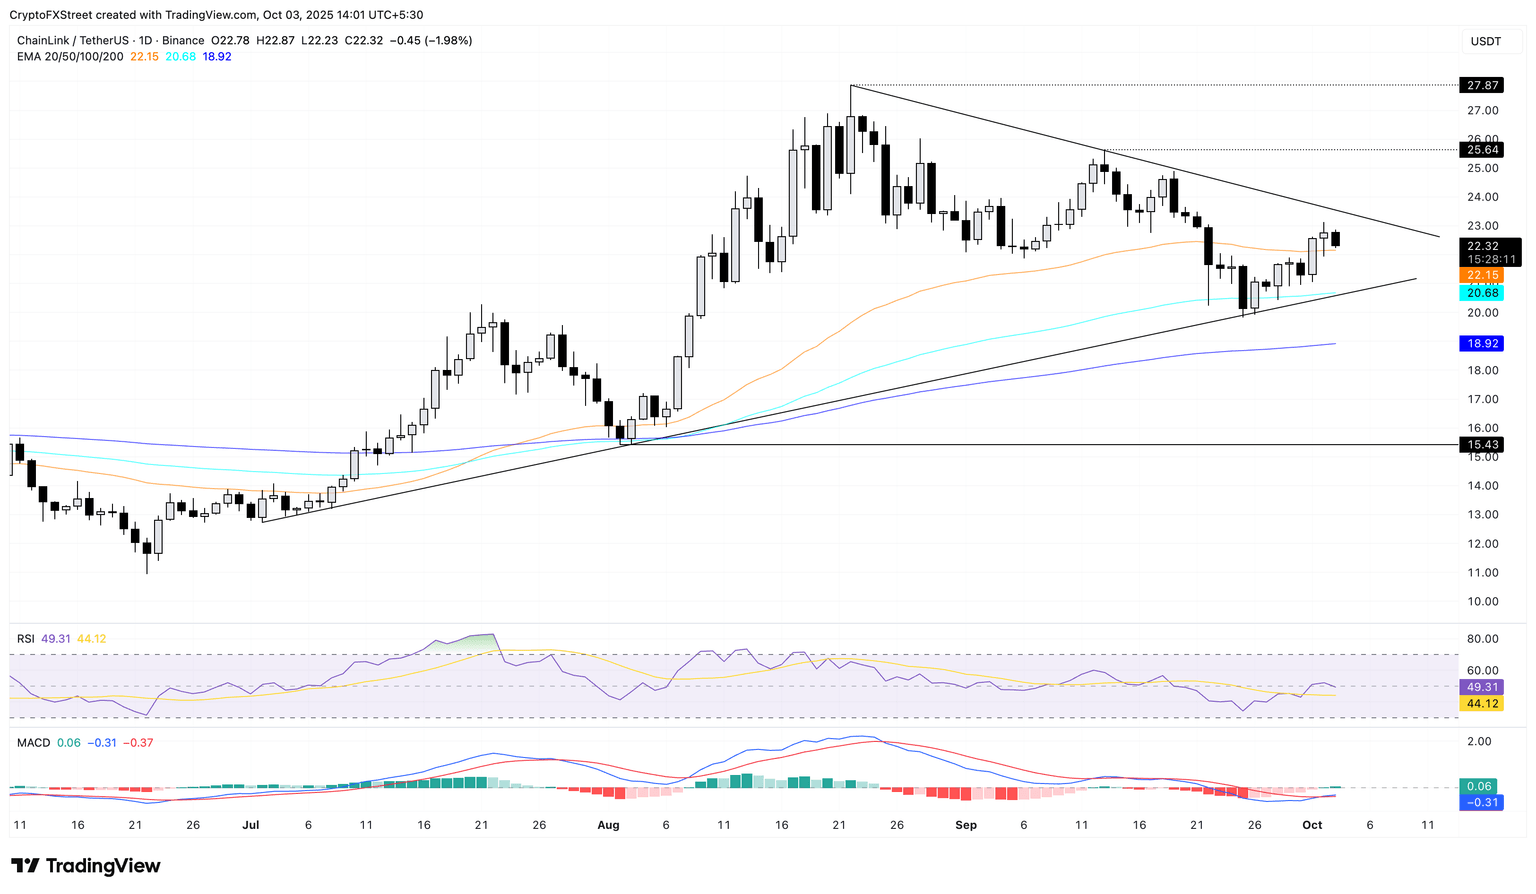
LINK/USDT daily price chart.
Should LINK rebound from its 50-day EMA, it could potentially test the triangle’s resistance trendline at $23.65. A subsequent breakout rally might encounter resistance around $25.64, which represents the high point from September 13.