

Key Observations
While Solana boasts impressive decentralized exchange (DEX) transaction volumes, user retention is a concern. Over 96% of wallet addresses are active for less than 24 hours. How does this impact the platform’s prospects for lasting integration?
Solana (SOL)
and
Ethereum (ETH)
dominate decentralized exchange (DEX) trading activity.
Together, these two blockchains account for about half of all DEX trading. Solana currently leads with about 25.36% of the total, narrowly ahead of Ethereum’s 23.3%. The close competition signifies near parity in available liquidity.
Solana’s on-chain performance highlights its key benefits: rapid transaction speeds, significantly lower transaction costs, and quick finality. But does this advantage translate to more secure, long-term growth?
High Activity, Low User Loyalty on Solana
Strong Solana on-chain throughput mirrors considerable DEX volumes.
The average transaction cost on Solana is approximately $0.043, while Ethereum averages around $0.43. This price difference means Solana can process ten times more value per dollar spent, improving efficiency for users who are involved in frequent decentralized trading, without overwhelming the network.
This statistic helps explain Solana’s high DEX activity, with over 750 million transaction addresses. However, 96.6% of these addresses, equivalent to roughly 720 million, are only active for less than a day, indicating a very high churn rate.
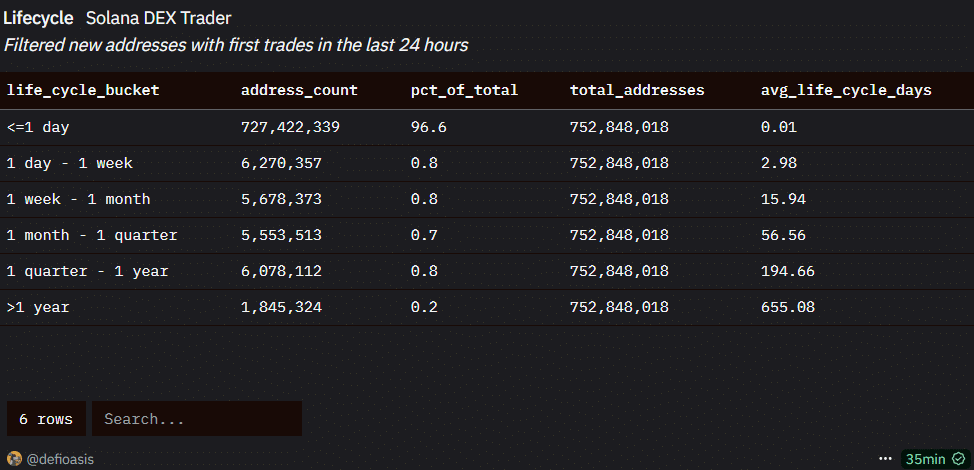
Source: X
This may imply that Solana’s key performance indicators are overstating true adoption rates.
Data indicates that just over 1.8 million addresses have remained active for more than a year, representing only 0.2% of the total addresses. This figure underscores that despite the network’s high throughput, long-term engagement remains limited.
Basically, more than 96% of Solana addresses are used briefly, most likely to quickly execute trades or exploit short-term liquidity opportunities. This trend is a critical factor for Solana’s long-term position in the cryptocurrency landscape.
Solana: Riding the Wave of Speculation?
The third quarter of the year proved significant for Solana.
From July to August, Solana recorded $241 billion in
DEX volume
, slightly surpassing Ethereum’s $234 billion. However, Solana’s price has not kept pace, lagging nearly 50% behind Ethereum’s 72% increase from its $2,500 level.
The divergence is also apparent in the SOL/ETH ratio. It experienced a 24.16% decline from its starting point of 0.06, marking its worst quarterly performance since 2022, reflecting Solana’s comparatively weaker performance.
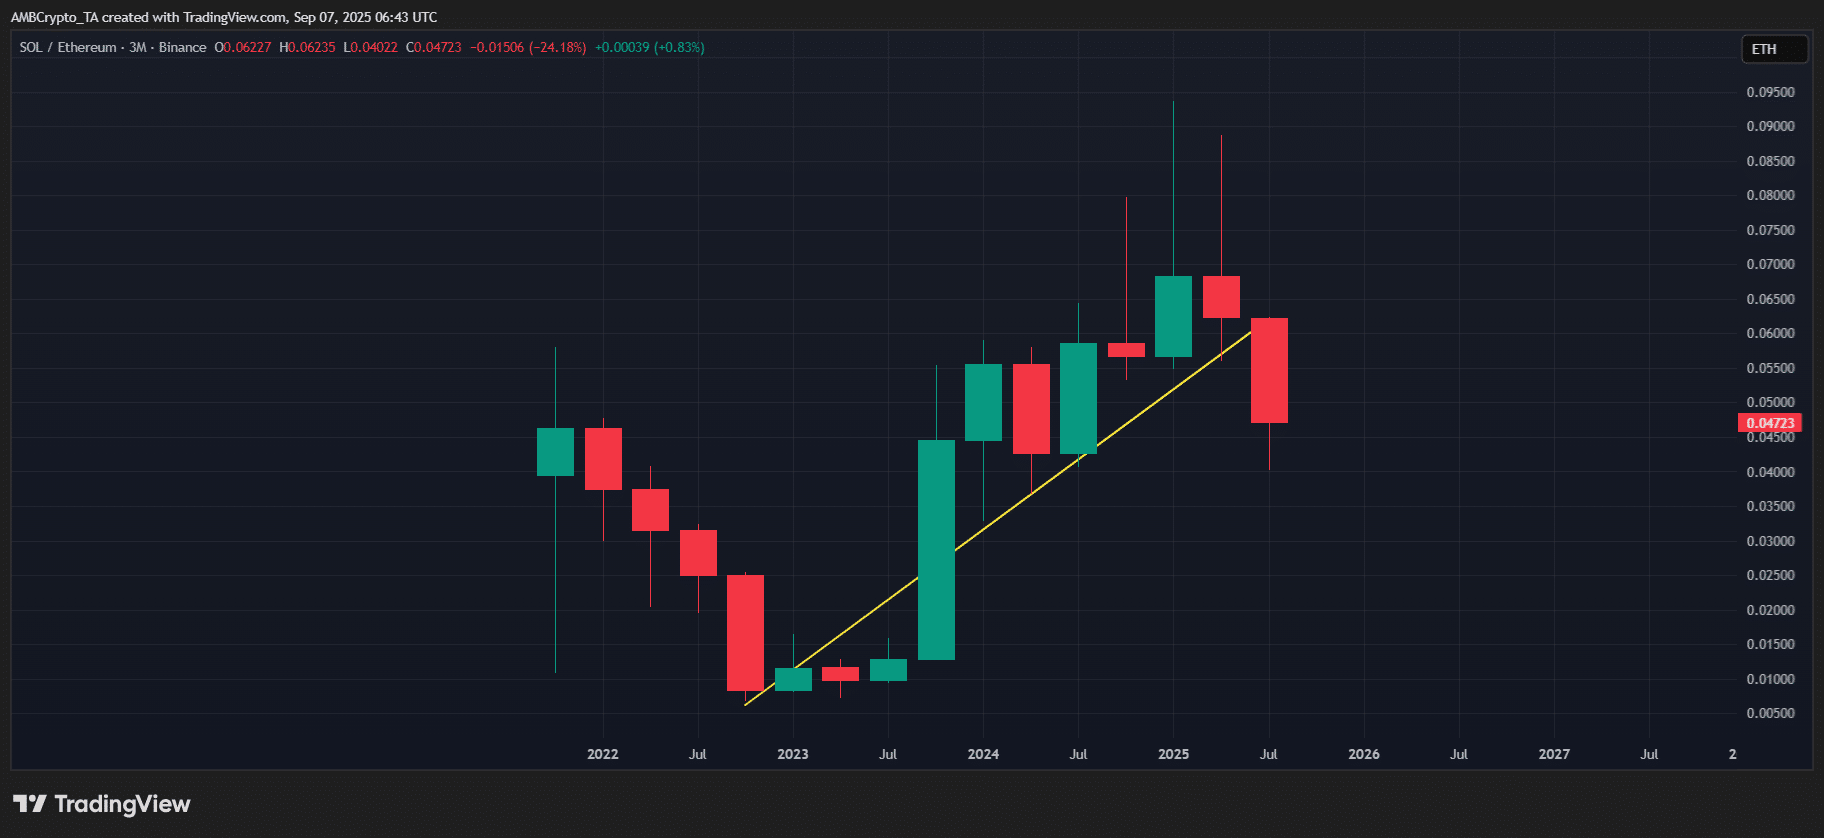
Source: TradingView (SOL/ETH)
To summarize, this decrease suggests that Solana’s fundamental strength may be overstated.
While high DEX throughput appears impressive
on-chain
, the short-lived nature of trading cycles indicates weak user retention and limited long-term adoption. This situation underscores an elevated level of market churn and caution among investors.
Consequently, SOL may continue to experience high volatility, with on-chain activity not accurately reflecting network growth. This discrepancy exposes investors to potential short-term fluctuations instead of steady, sustainable appreciation.