

Analysis using a large language model (LLM) suggests Ethereum (ETH) is currently consolidating around $4,375, experiencing a slight dip of 0.45%. This comes amid significant portfolio adjustments by large financial players, with substantial Bitcoin holdings reportedly being converted into Ethereum. Specifically, some observers claim large Bitcoin holders are selling approximately $435 million in BTC to acquire around $433 million worth of ETH.
In a related development, Ethereum co-founder Joe Lubin has expressed a bullish outlook, forecasting a potential 100x increase in value as traditional financial institutions increasingly integrate decentralized finance (DeFi) technologies.
The LLM’s analysis of Ethereum’s potential direction involves examining 23 different real-time technical indicators to form its projection of the digital asset’s likely future price movement.
Technical Analysis: Examining EMA Resistance
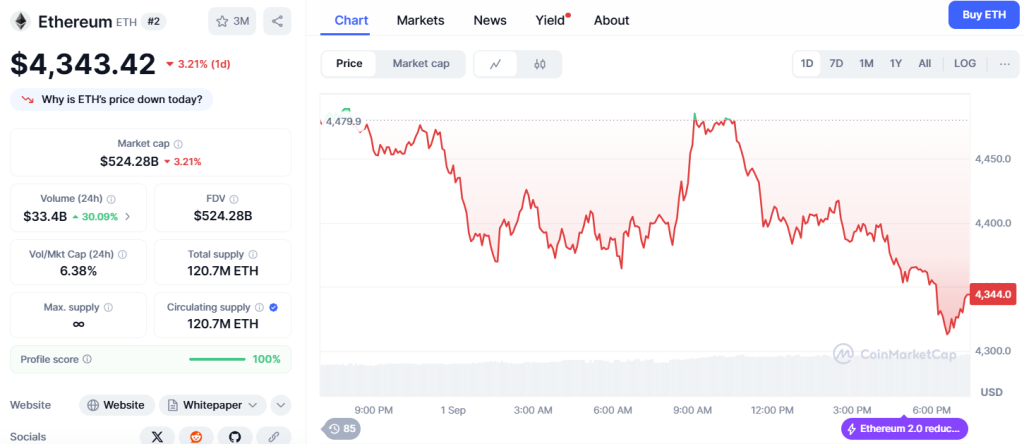
Ethereum’s present price, sitting at $4,375.47, indicates a -0.45% decrease from its opening price of $4,395.20. This suggests a period of narrow price fluctuation, with a high of $4,424.56 and a low of $4,365.19 observed within the current trading day.
This restricted price movement, a range of around 1.4%, points to potentially low volatility during a phase where institutions are building up their positions before challenging existing resistance levels.
The Relative Strength Index (RSI), registering at 43.38, is approaching levels that could indicate the asset is oversold, suggesting a potential price rebound might be on the horizon for those looking to take a contrarian stance.
Examining moving averages shows a mixed picture. Ethereum’s price is currently below its shorter-term Exponential Moving Averages (EMAs): 20-day at $4,460 (+1.9%), 50-day at $4,429 (+1.2%), and 100-day at $4,421 (+1.0%). However, the longer-term trend remains positive, as the price holds above the 200-day EMA, currently at $4,130 (-5.6%).
The Moving Average Convergence Divergence (MACD) shows a slightly optimistic picture at 2.64, sitting above the zero line, with the signal line at -19.26. However, the negative histogram value of -21.90 suggests a weakening of upward momentum.

This divergence in momentum during institutional accumulation can often be a precursor to significant price breakouts, as technical indicators adjust to reflect underlying market fundamentals.
Market Context: Institutions Shift Towards Ethereum
The current consolidation phase for Ethereum coincides with notable shifts in institutional investment, particularly the movement of funds from Bitcoin into Ethereum.
Reports indicate that a major market participant sold off $435 million worth of Bitcoin and then used those funds to purchase $433 million of Ethereum.
This trend extends beyond single large investors, signaling a broader wave of institutional validation for Ethereum.
Ethereum’s co-founder, Joe Lubin, has contributed to this optimistic outlook, predicting a potential 100x return for ETH as Wall Street increasingly embraces DeFi technologies. His forecast hinges on the premise that further development of the necessary infrastructure will pave the way for greater institutional involvement in the DeFi space.
Analysis of market data reveals a pattern of decreasing Ethereum reserves on major exchanges like Binance, contrasting with relatively stable Bitcoin reserves, suggesting a deliberate accumulation strategy.
Despite the current price point around $4,400, Ethereum is reportedly being withdrawn from exchanges, while Bitcoin supplies remain consistent, suggesting sustained institutional interest even at elevated prices.
Institutional Accumulation Trends
Recent market behavior demonstrates a systematic accumulation of Ethereum across various categories of institutional investors.
Reports highlight that a Bitcoin investor with $11 billion in holdings has significantly increased their Ethereum allocation to $4 billion, indicating a major shift in investment strategy towards Ethereum.
Observations of sophisticated trading activity show a confident stance, with one trader who generated $25 million in profits over 5 months closing short positions and establishing a long position in ETH, now holding a $29,177,000 long position.
Analysts also point to broader rotation patterns, noting that the United States led crypto inflows with $2.48 billion in August, with Ethereum surpassing Bitcoin in attracting those investments.
These capital flows lend weight to arguments for Ethereum’s fundamental strength, regardless of the technical hurdles. Furthermore, the dwindling reserves on exchanges demonstrate a consistent withdrawal pattern typically seen when institutions are transferring assets into custodial solutions.
Market Fundamentals: Solid Metrics Amid Price Stability
Ethereum maintains a substantial market capitalization of $525.72 billion, even with a 2.7% decrease during the current phase of stabilization.
This market cap adjustment is accompanied by an increase in trading volume to $32.98 billion (+41.9%), indicating institutions are actively repositioning their holdings while testing the waters at resistance levels.
The volume-to-market cap ratio of 6.26% reflects healthy trading activity that supports price resilience as institutions build up their positions.
Furthermore, Ethereum’s market dominance, representing 14.02% of the total cryptocurrency market, solidifies its position as the leading alternative cryptocurrency (altcoin) with a proven history of adoption by institutional investors.
The current price represents an 11.92% discount from its all-time high of $4,953 on August 24th, and boasts a remarkable return of 1,036,533% from its lows in 2015.
Data from LunarCrush suggests moderate social media activity, with Ethereum’s AltRank at 235 during this phase of institutional accumulation.
A Galaxy Score of 47 indicates mixed sentiment, as market participants consider the potential impact of large investors shifting assets and the bullish predictions from the co-founder.
Engagement metrics reveal a decrease in overall activity with 23.66 million total engagements (-14.52M), but an increase in mentions to 151.28K (+42.5K), suggesting that while fewer people are actively participating in discussions, Ethereum remains a prominent topic of conversation as these developments unfold.
Its social dominance remains high at 12.6%, maintaining its position as a leading altcoin with strong sentiment reported at a solid 80% positive.
Current discussions online center around the validation of Ethereum by institutions, and emphasize the potential for Ethereum to revisit patterns from previous cycles, but with increased involvement from Wall Street.
Technical analysts are noting similarities to setups from the past, with the increased institutional participation amplifying the potential for significant gains.
LLM’s Ethereum Analysis: Bridging Institutional Interest with Technical Performance
An LLM’s analysis indicates that Ethereum’s current market position is influenced by significant institutional activity and the need to overcome key technical resistance levels. A break beyond these levels would signal continued bullish momentum.
The shift of capital from Bitcoin to Ethereum, combined with Lubin’s projection of a 100x increase, creates a compelling background, while the presence of EMA resistance highlights the technical challenges that need to be overcome.
Immediate resistance is observed at the 100-day EMA around $4,421, followed by the 50-day EMA at $4,429 and the 20-day EMA at $4,460.

Breaking through these resistance levels would confirm that institutional accumulation is underway, potentially driving momentum toward targets of $4,700–$4,900 and beyond, based on prior points of resistance.
On the downside, initial support lies around today’s low of $4,365, with stronger support near the 200-day EMA at $4,130.
Ethereum Price Forecast for the Next Three Months: Impact of Institutional Activity
Institutional Breakout (55% Probability)
A successful move above the $4,421 EMA resistance, fueled by continued institutional asset rotation, could propel Ethereum towards $4,900–$5,200, which translates to a potential upside of 12–19% from its present price.

This outcome depends on the completion of institutional accumulation and subsequent confirmation of the technical breakout.
Extended Accumulation (30% Probability)
Continued activity from institutional investors may result in a period of consolidation between $4,200 and $4,500. This could allow for accumulation to be completed while giving technical indicators time to reset before the next significant directional move, aligning with Lubin’s optimistic predictions.

Testing Support Levels (15% Probability)
Should the price fall below the $4,305 support level, this could trigger selling pressure and drive prices towards $4,200–$4,130, representing a potential downside of 4–6%.
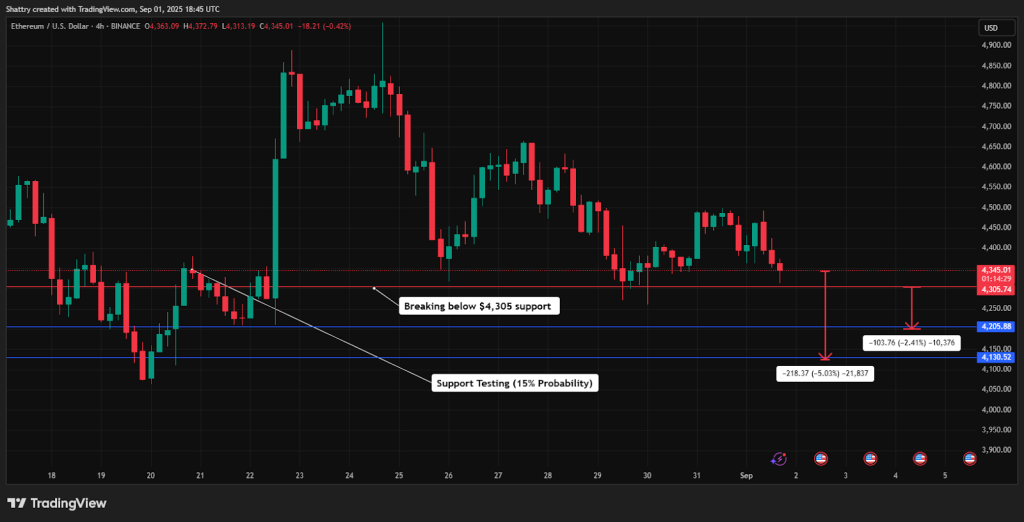
A recovery would depend on increased accumulation from institutions, a confirmed bottom by validating support and defense of the 200-day EMA.
LLM’s Ethereum Analysis: The Role of Infrastructure and Institutions
The LLM’s analysis of Ethereum underscores its position at a critical intersection between the validation of institutional investments and the requirements for a technical breakout.
The combination of capital flowing from BTC into ETH creates a significant backdrop that will predict the short-term direction of ETH.
Near-Term Price Target: $4,900-$5,200 Within the Next 90 Days
The immediate path ahead hinges on decisively surpassing the $4,421 resistance, which would validate the ongoing accumulation by institutions against the prevailing technical headwinds.
From this point, the continued rotation of capital could propel Ethereum towards the psychological resistance level of $4,900. Sustained adoption by larger players could then drive it towards breakout levels of $5,200 and potentially higher.
However, if Ethereum fails to overcome $4,421, it might indicate an extended period of consolidation within the $4,200–$4,130 range. This would present another opportunity for accumulation, with the next wave of institutional investment potentially driving ETH towards targets of $7,000 and beyond as DeFi infrastructure becomes more deeply integrated into Wall Street.
The post Ethereum: $4,900–$5,200 Target Possible Within 90 Days, Analysts Suggest appeared first on Cryptonews.