

Ethereum’s Price on Thin Ice: $4,000 Support Level Under Threat
The digital currency Ethereum (ETH) is currently navigating precarious territory, hovering just above the $4,000 threshold. A recent sharp dip saw its value momentarily plummet to $3,800, after which it staged a partial recovery. However, the strength of this rebound appears questionable. A significant decline in Bitcoin’s value, breaching the $110,000 mark, is exerting downward pressure across the entire cryptocurrency market, heightening concerns about a potential further descent towards the $3,500 level for Ethereum.
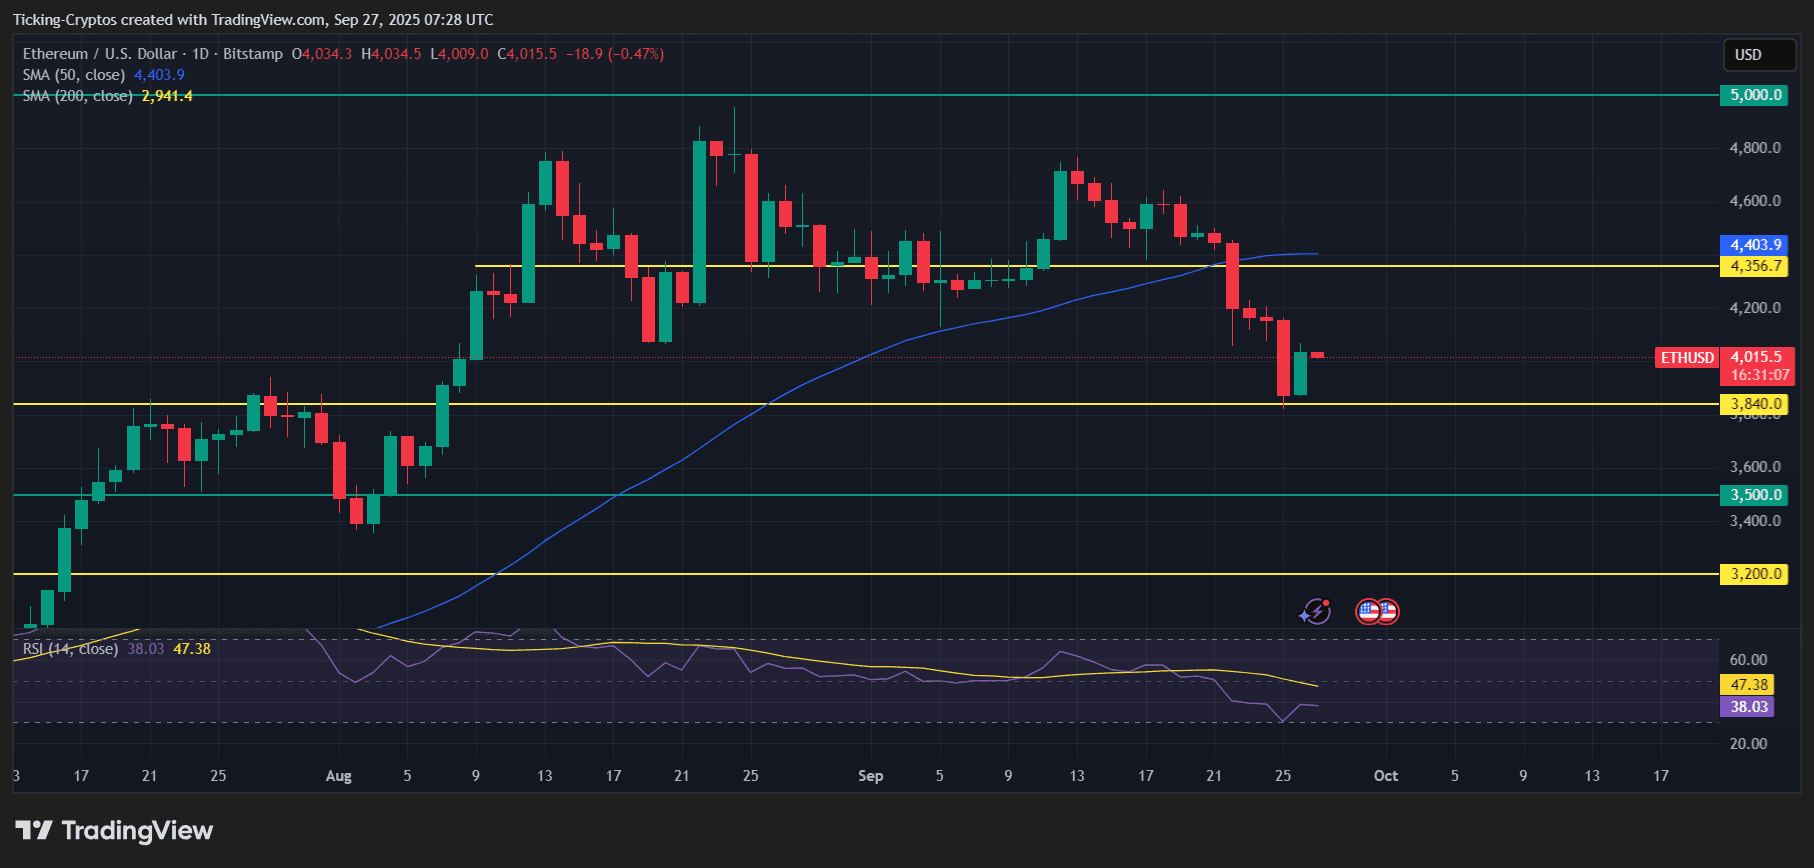
Ethereum’s USD price performance over the past week – TradingView
What’s Behind Ethereum’s Price Decline?
Several crucial factors contribute to the ongoing downturn in Ethereum’s value and the broader cryptocurrency market:
- Bitcoin’s Dip: The notable drop in Bitcoin’s value, falling below $110,000, has set off widespread selling across various altcoins. Ethereum, being the second-largest cryptocurrency, is mirroring Bitcoin’s trajectory.
- Broad Market Downturn: The entire crypto landscape is experiencing increased pressure as investors reduce risk in response to significant volatility and liquidity constraints.
- Geopolitical and Regulatory Factors: Global political instability and the lack of clear crypto regulatory frameworks are pushing investors away from riskier assets.
- Technical Vulnerabilities in Ethereum: Ethereum’s price chart indicates potential breakdowns, with critical support levels already facing tests.

ETH/USD Price Chart Analysis
Ethereum’s daily chart reveals a concerning technical picture:
- Key Support Zones: Ethereum momentarily dipped below the $3,840 support level, a level frequently tested in recent months. Sustained trading below this level could lead to a further decline towards $3,500, with potential risks extending to $3,200 if selling intensifies.
- Resistance Zones: Conversely, Ethereum faces immediate resistance between $4,350 and $4,400, near the 50-day moving average. For an optimistic outlook, bulls need to surpass this level to counteract further downward pressure.
- Moving Averages: The 50-day SMA ($4,403) now acts as a resistance point, while the 200-day SMA, considerably lower at $2,941, highlights the potential for a substantial decline in a prolonged downturn.
- RSI Indicator: With an RSI of 38, the momentum currently favors sellers. Further drops into oversold conditions could intensify selling activity.
ETH/USD 1-day chart – TradingView
Ethereum Price Forecast: A Fall to $3,500 on the Horizon?
Market observers suggest that Ethereum could potentially revisit the $3,500 mark if Bitcoin fails to find stability above $110,000. Given the close relationship between these assets, Ethereum is unlikely to diverge from Bitcoin’s trend in the near future. Although some traders view $3,500 as an attractive buying opportunity, concerns persist that a further decline could trigger widespread liquidations.
The Big Picture: Is This the Beginning of a Deeper Ethereum Decline?
Ethereum’s recent price movements are displaying concerning signals. The fragile recovery from $3,800 may prove temporary if Bitcoin continues its downward trend and broader market uncertainties persist. Unless Ethereum can maintain a position above $4,000 and successfully reclaim the $4,350–$4,400 resistance zone, the most likely trajectory points downwards.
Currently, Ethereum traders are anticipating increased volatility, with the $3,500 level representing a crucial threshold.