

After a turbulent week where it faced resistance near $4,800, Ethereum’s price is currently hovering around $4,561. This follows a strong rebound from the lows seen in June. Notably, ETH has broken free from a descending broadening wedge pattern observed on the weekly charts over a considerable period. Typically, this pattern suggests that a lengthy phase of market consolidation has ended, paving the way for a more substantial uptrend.
The overall mood among investors is mixed. Some analysts believe this dip in ETH’s price is just normal profit-taking after the impressive surge from $3,200. Others are concerned about significant amounts of ETH being deposited on exchanges, which could put downward pressure on the price. The key question now is whether Ethereum can find support above $4,500 and attempt to challenge the $4,800 resistance level again.
Ethereum Price Holds Steady as a Breakout Pattern Takes Shape
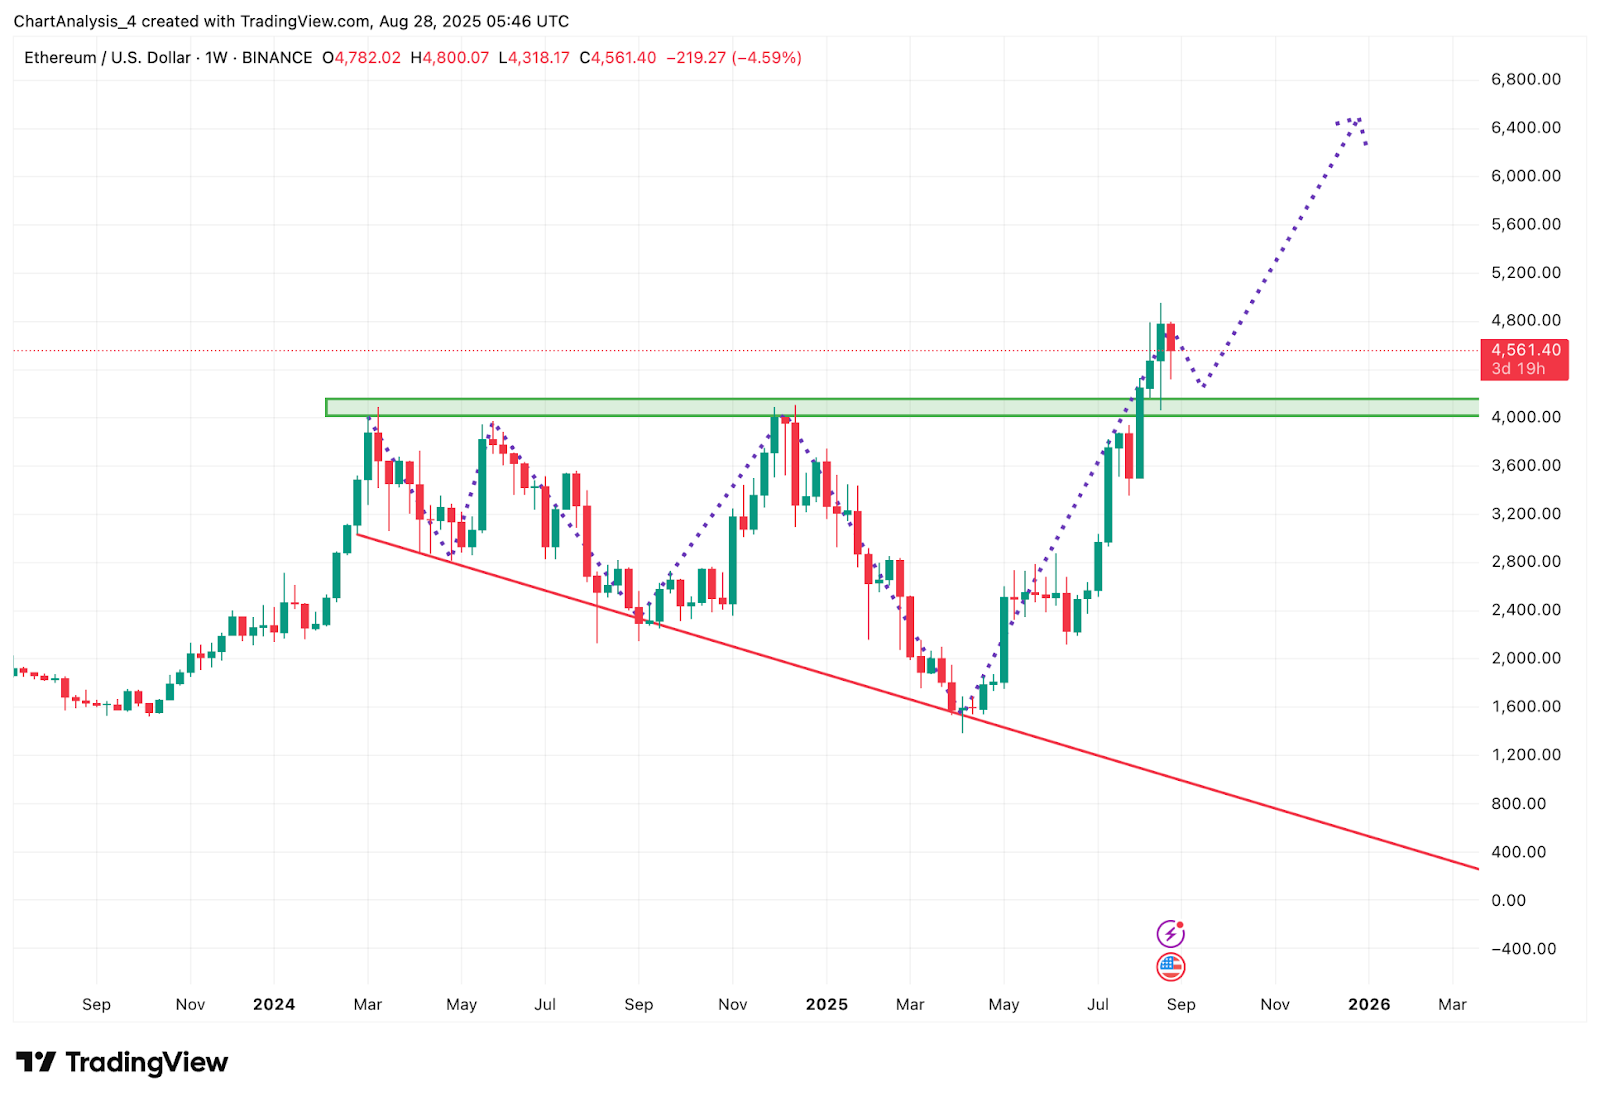
The weekly chart clearly demonstrates Ethereum’s escape from a descending broadening wedge. The price is now consolidating just above the previous breakout area, between approximately $4,200 and $4,300. Historically, as long as support levels are maintained, these types of formations frequently lead to strong continuation patterns.
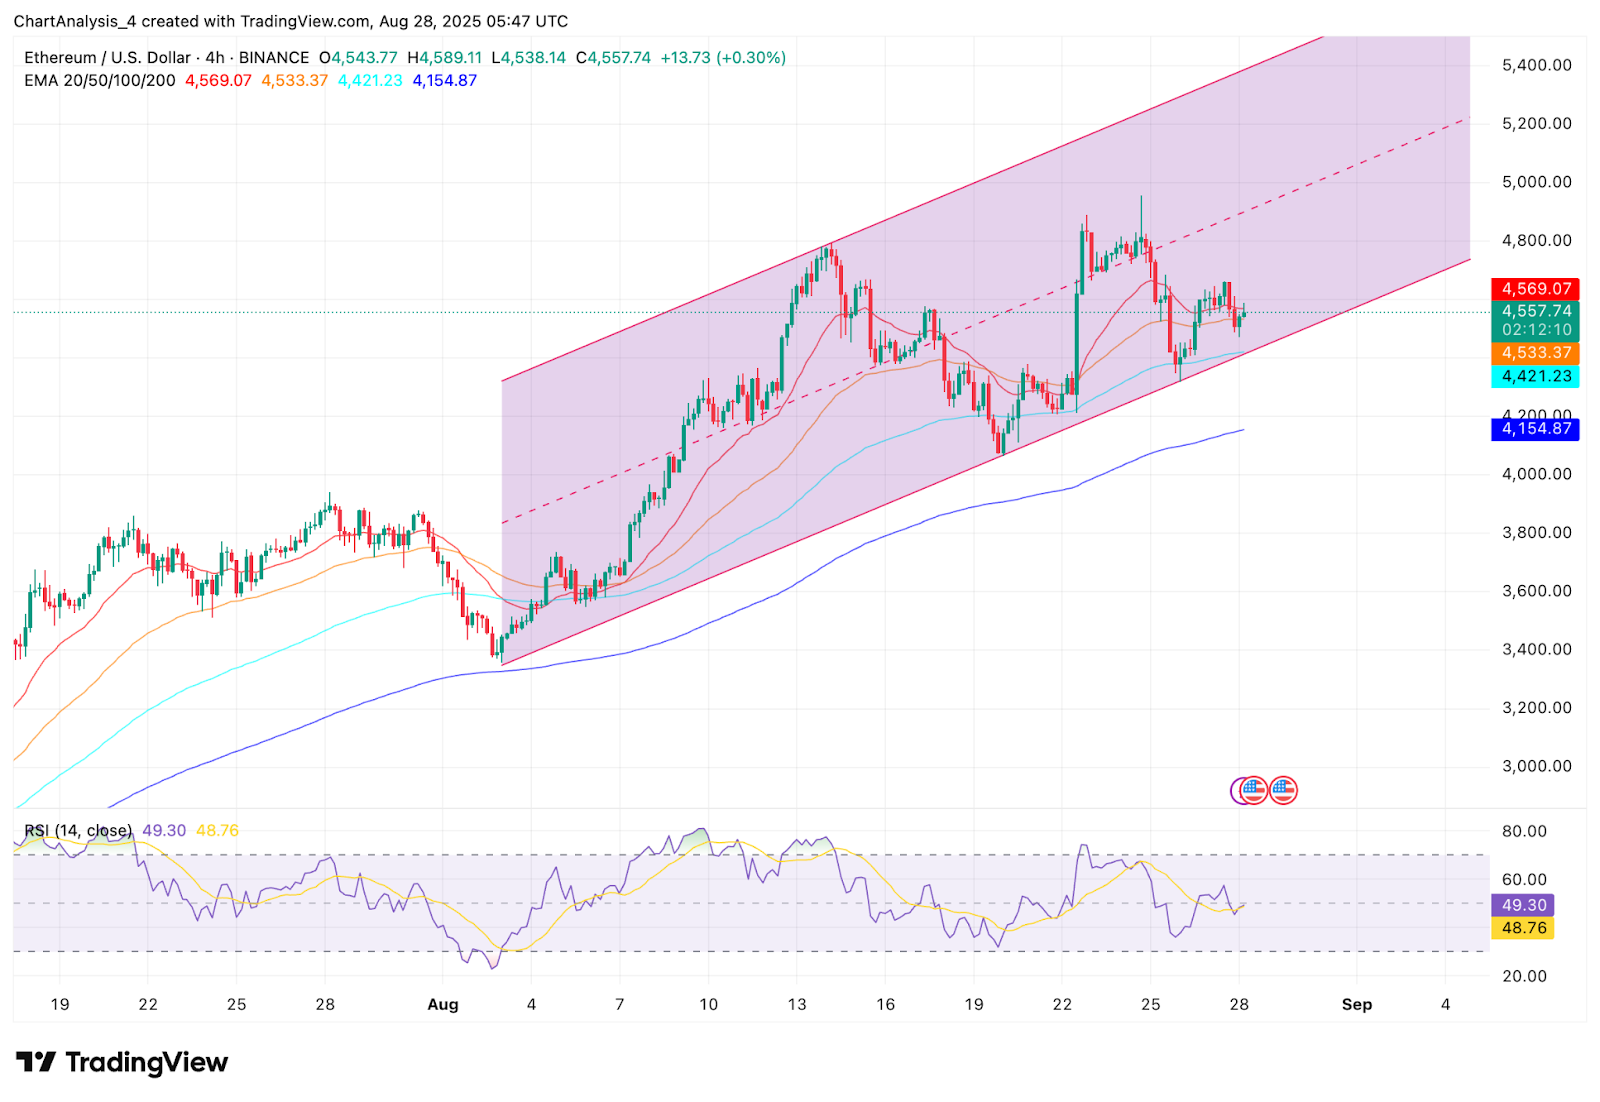
Looking at the 4-hour chart, ETH is currently trading within a rising parallel channel…
This analysis originated on Coin Edition. Read the full article: Ethereum Price Prediction: Can ETH Break $4,800 Resistance and Rally Toward $6,000?