
Ethereum Slips Below $2,000 Amid Bitcoin’s Decline
The cryptocurrency landscape is witnessing a noteworthy intraday downturn as of June 2, 2026. Ethereum ($ETH) has fallen below the key $2,000 psychological support level, reaching an intraday low of about $1,963. This significant price drop mirrors a broader market pullback initiated by Bitcoin ($BTC), which has dropped below the crucial $70,000 barrier for the first time in almost two months.
The downward pressure intensified during the early hours of trading in Europe, leading to automatic stop-loss triggers and the liquidation of derivative positions across major exchanges such as Bitstamp and Binance.
What’s Causing Today’s Crypto Market Drop?
The sudden downturn in Ethereum’s value is closely linked to the unfavorable price movements of Bitcoin. Over the last 24 hours, Bitcoin has faced two significant challenges that have dampened investor confidence:
- Unexpected Token Sale by Strategy: MicroStrategy (referred to in markets simply as Strategy) made public its first Bitcoin liquidation since late 2022, selling $2.5 million in $BTC to cover preferred shareholder dividends. While this amount may appear minor, it has unsettled market players due to a deviation from Michael Saylor’s previously steadfast “HODL” strategy.
- Significant ETF Withdrawals: Institutional data from Bloomberg indicates that US spot Bitcoin ETFs are currently experiencing a remarkable streak of 11 consecutive days of net outflows, with investors withdrawing close to $3.5 billion from these funds amidst increasing geopolitical tensions between the US and Iran.
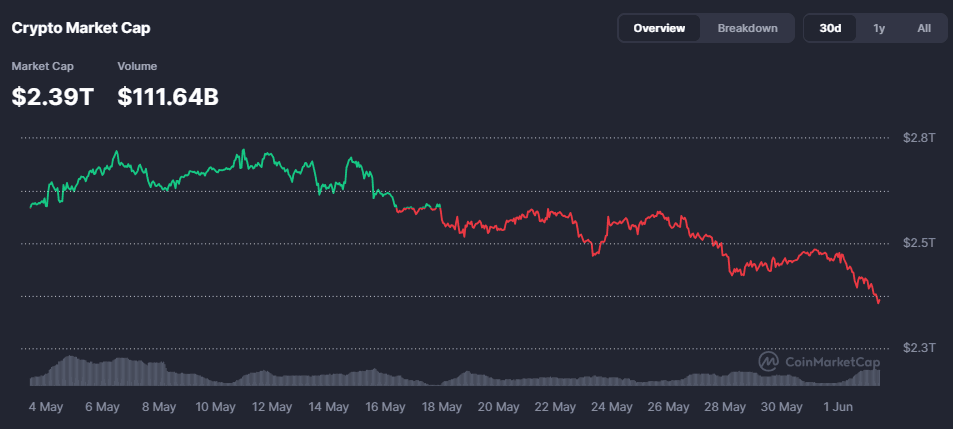
As capital flowed out of Bitcoin at a rapid pace, the overall altcoin market experienced a sharp decline. Given Ethereum’s close correlation with $BTC‘s market share, its value plummeting below $70,000 triggered an immediate technical breakdown for Ethereum.
Ethereum Technical Overview: $1,800 as a New Support Level
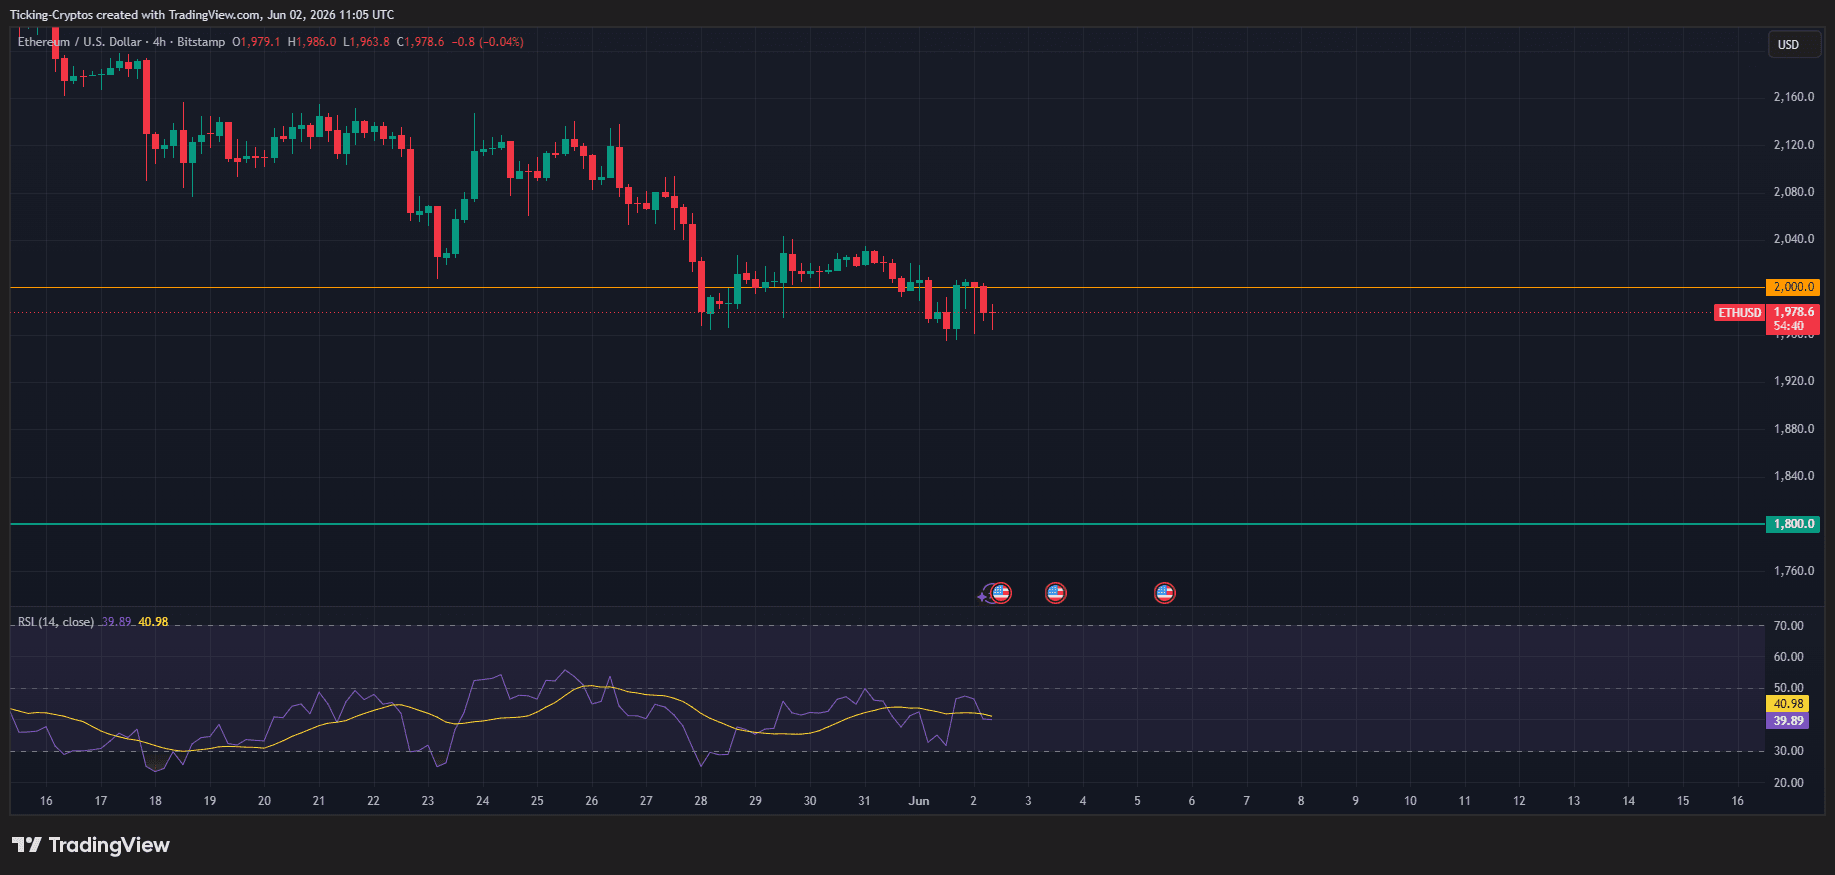
Analyzing the 4-hour $ETH/USD chart reveals a strongly bearish outlook for short-term investors.
Essential Technical Metrics to Monitor:
- The Critical $2,000 Level: The horizontal orange line denotes this essential psychological threshold. With the inability to hold above $2,000, this area has transitioned from a significant support level to a major resistance zone.
- Relative Strength Index (RSI): The 14-period RSI has dropped to 39.89, indicating that while the market is nearing oversold conditions, there remains room for further downside momentum before a more sustainable recovery can begin.
- The $1,800 Support Line: Should selling pressure increase, the main macro support that bears are targeting is the green horizontal line at $1,800.0. Traders are advised to closely watch daily and weekly closures; failing to defend $1,800 could open the door to a deeper correction towards the lows seen in late 2024.