

Several metrics tracking Ethereum (ETH) activity suggest the recent surge in price, a 35% increase over the last month, may be due for a short-term downturn. After recently approaching $4,000, some indicators are signaling that Ethereum might be overbought.
As the digital currency’s value nears this important level of resistance, data implies that increased selling activity could be on the horizon. This could potentially cause a temporary price decrease before the cryptocurrency attempts any further climbs.
Ethereum Shows Potential for Price Decrease
One key indicator suggesting a potential price decrease is the divergence between the price and the Daily Active Addresses (DAA). Essentially, this metric reveals whether Ethereum’s value is rising in conjunction with actual user participation on the network.
A positive reading of this metric typically suggests increased user activity, signaling a potential opportunity for the price to continue its upward trend. Conversely, a negative reading indicates decreased network activity, potentially hindering the price’s progress.
According to data from Santiment, Ethereum’s price-DAA divergence has plummeted to -64.17%. This significant drop implies a reduction in the number of unique addresses interacting with the Ethereum network. Consequently, given the previously mentioned conditions, Ethereum’s price may experience a downward correction.
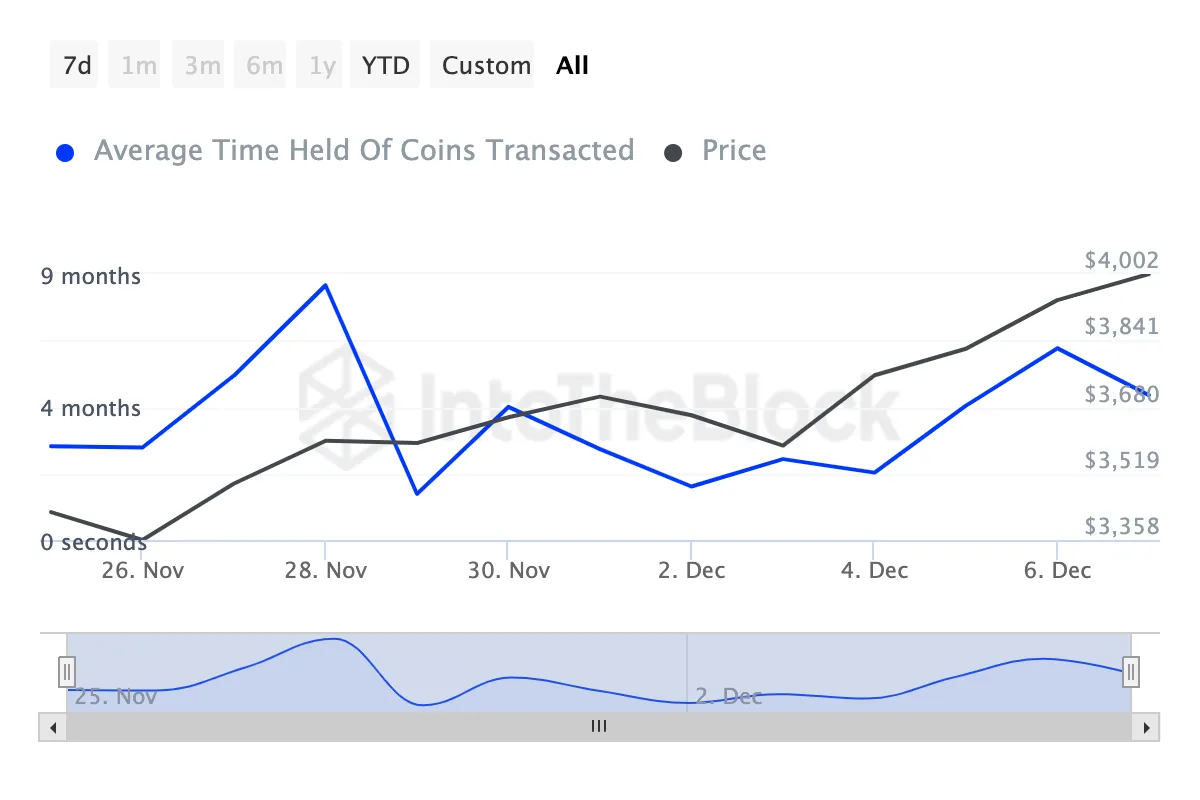
Furthermore, analysis of Ethereum’s Coin Holding Time supports this bearish outlook. Coin Holding Time measures the duration for which Ethereum tokens are held without being sold or transferred.
An increase in this metric suggests that holders are generally choosing not to sell. A decrease, however, implies the opposite.
Data from IntoTheBlock reveals that Ethereum’s Coin Holding Time has been decreasing since December 6th, indicating potential selling pressure. If this trend persists, Ethereum’s price may fall below the $3,900 level.
ETH Price Prediction: Could it Dip Back Below $3,800?
Looking at the 4-hour price chart, Ethereum encountered resistance near $4,073, leading to a retracement towards $3,985. Additionally, the Cumulative Volume Delta (CVD) has shifted into negative territory.
The CVD is a technical analysis tool that provides insight into the buying and selling forces at play. It allows traders to evaluate the overall difference between buying and selling volumes during a specific period.
A positive CVD suggests dominant buying pressure, while a negative CVD points to increasing selling pressure, which is currently the case for Ethereum.
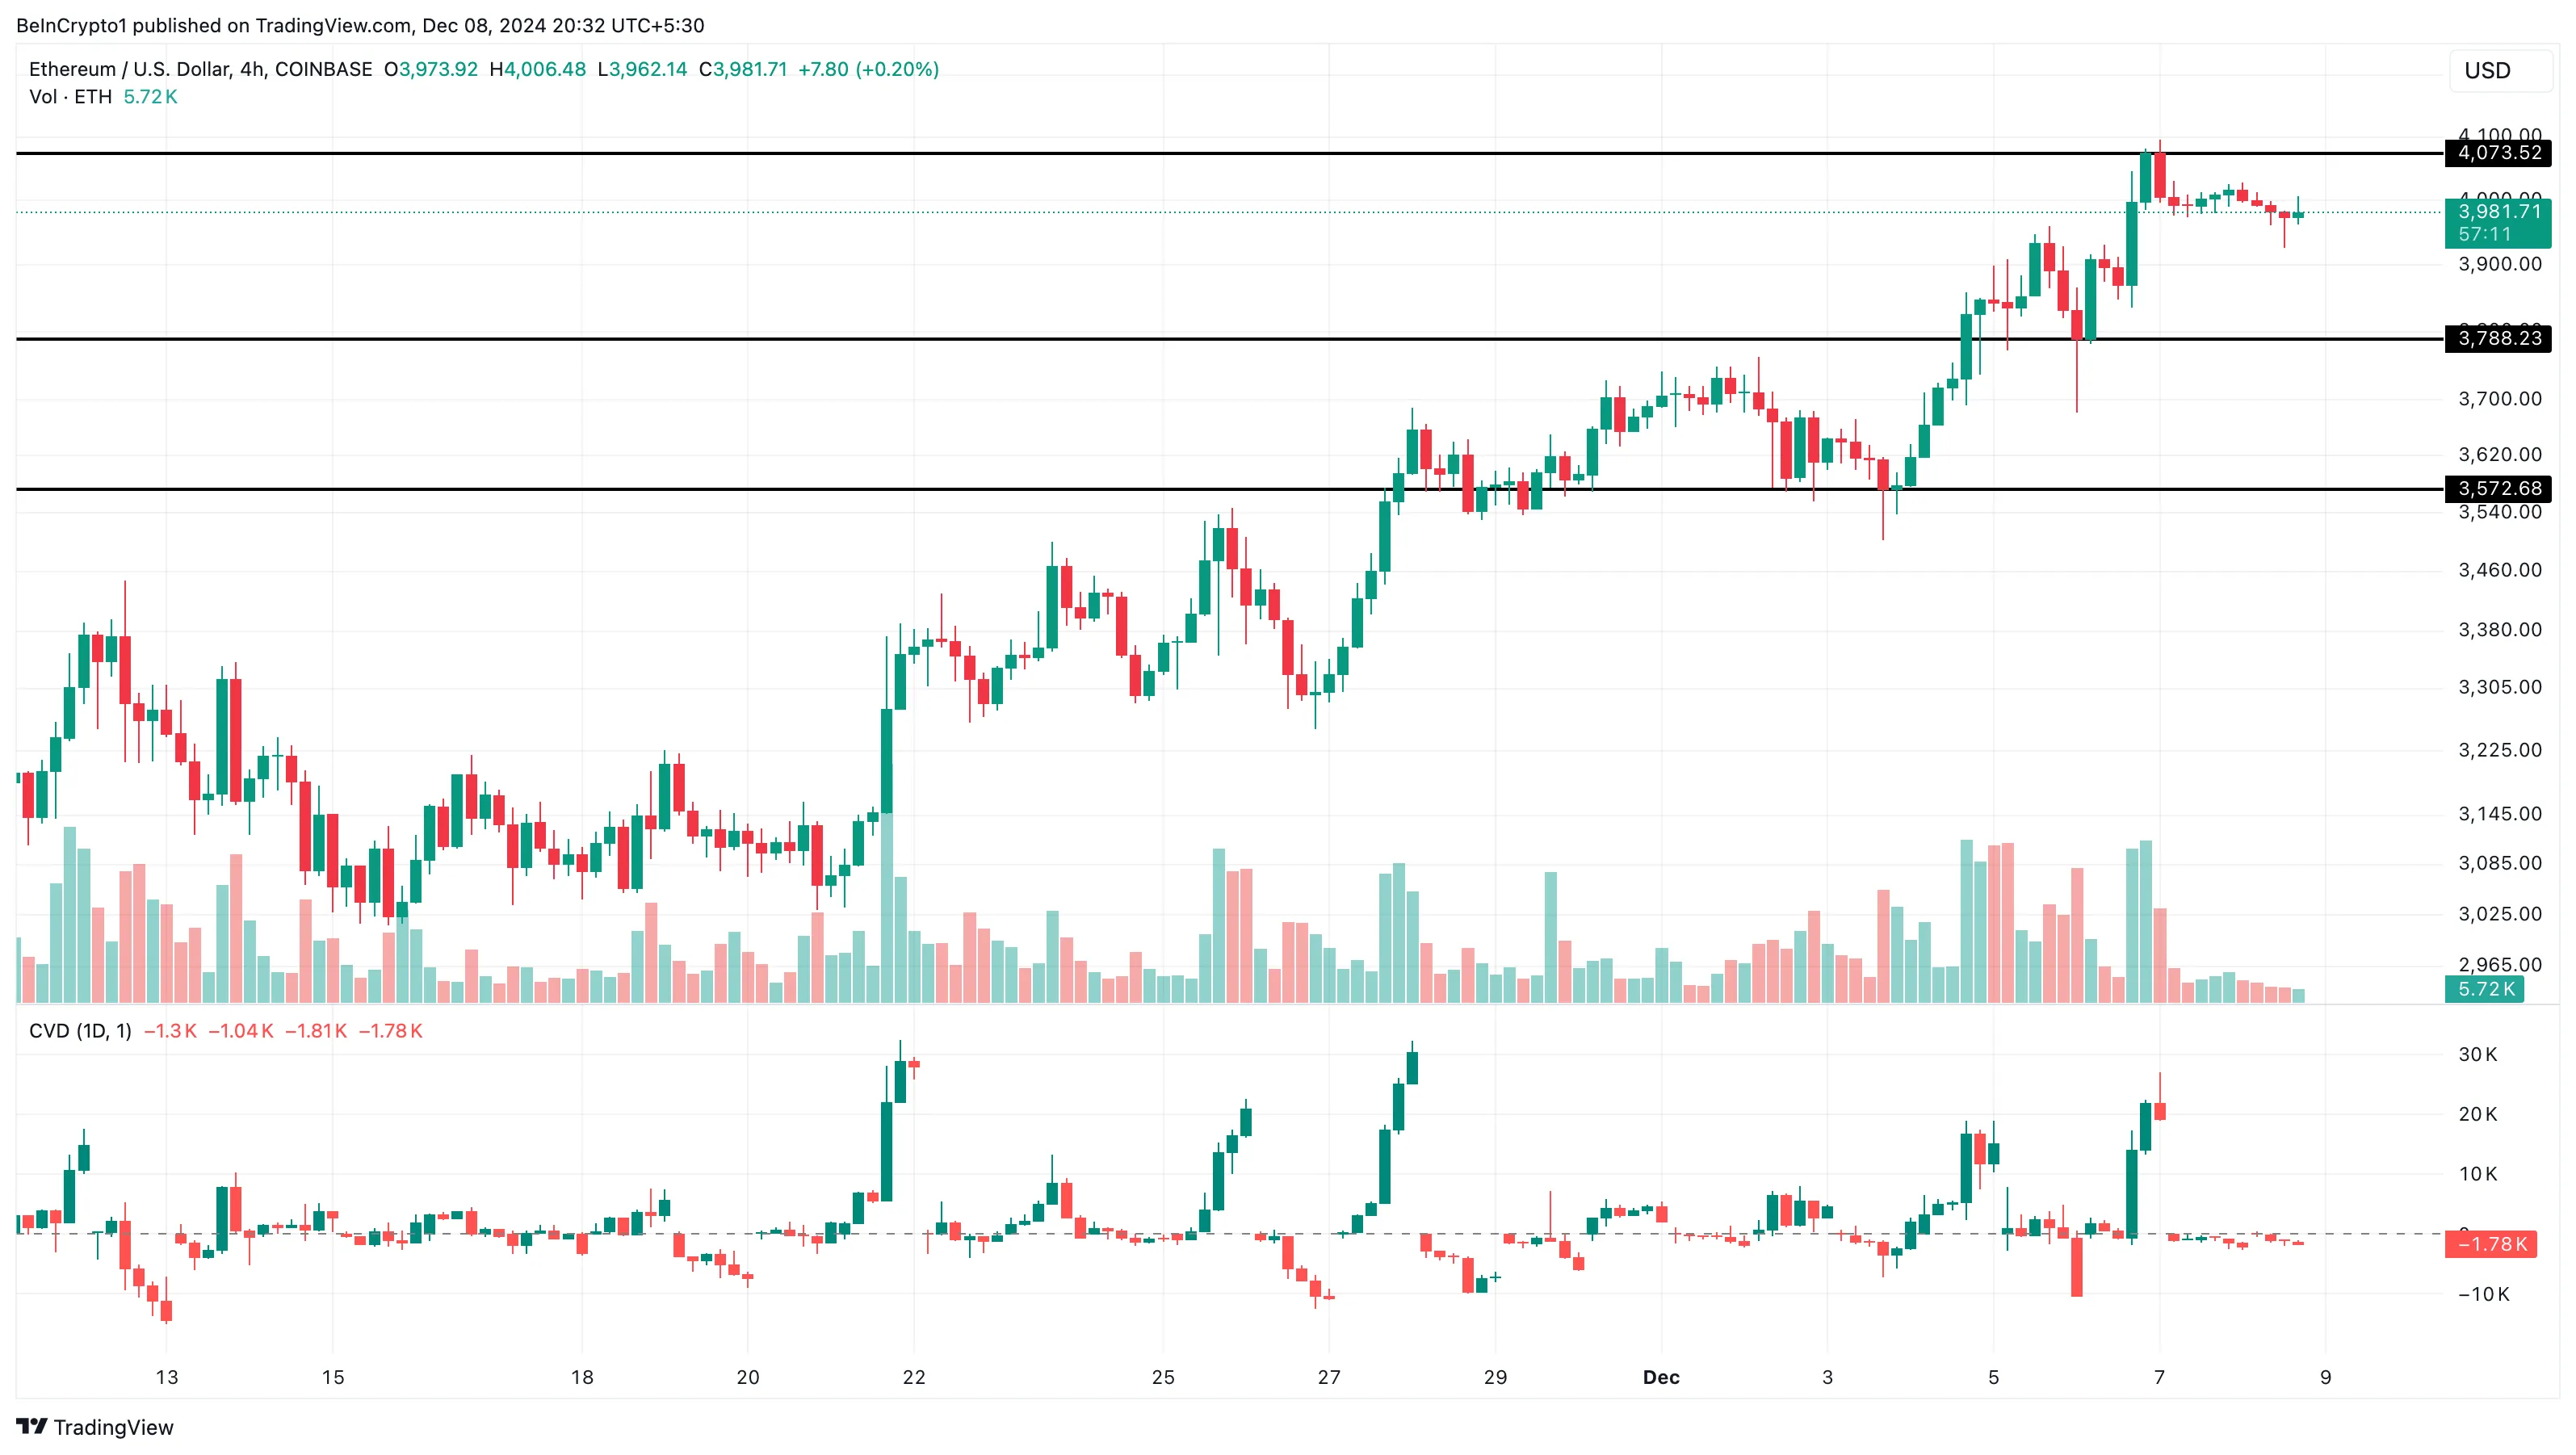
If this selling pressure persists, Ethereum’s price could potentially decrease to around $3,788. In a more pessimistic scenario, it might even decline to $3,572. However, a reversal of the current trend could prevent this decline, potentially pushing the cryptocurrency towards $4,500.
Disclaimer
Aligned with the Trust Project standards, this analysis of Ethereum’s price is intended solely for informational purposes and should not be interpreted as financial or investment advice. BeInCrypto is dedicated to providing accurate and unbiased reporting; however, market conditions can change unexpectedly. It is essential to conduct thorough research and consult with a qualified professional before making any financial decisions. Please be aware that our Terms and Conditions, Privacy Policy, and Disclaimers have been updated.