

Data from CEXIO indicates a shift in trader activity, with ETH now accounting for 32% of spot exchange trading volume as capital moves away from BTC.
A recent report by the CEXIO crypto exchange highlights that Ethereum (ETH) has outpaced Bitcoin (BTC) in spot market trading volume on major centralized exchanges (CEXs). Ethereum’s share reached over 32% this month, marking its highest level since August 2017.
The report, released on August 20th, specifies that Ethereum’s dominance is even more pronounced on particular platforms. CEXIO, for example, saw Ether representing 39% of weekly spot trades, an increase from 28% the previous month. The report suggests that this increase stemmed from smaller transactions (below $3,000), pointing to more activity from retail investors.
According to the report, “Despite price volatility, Ether has surpassed Bitcoin as the most actively traded cryptocurrency in the spot market, indicating a significant shift in trader focus.” It also notes that “Ether’s volume dominance has steadily grown each week, increasing its lead over Bitcoin and other digital assets.”
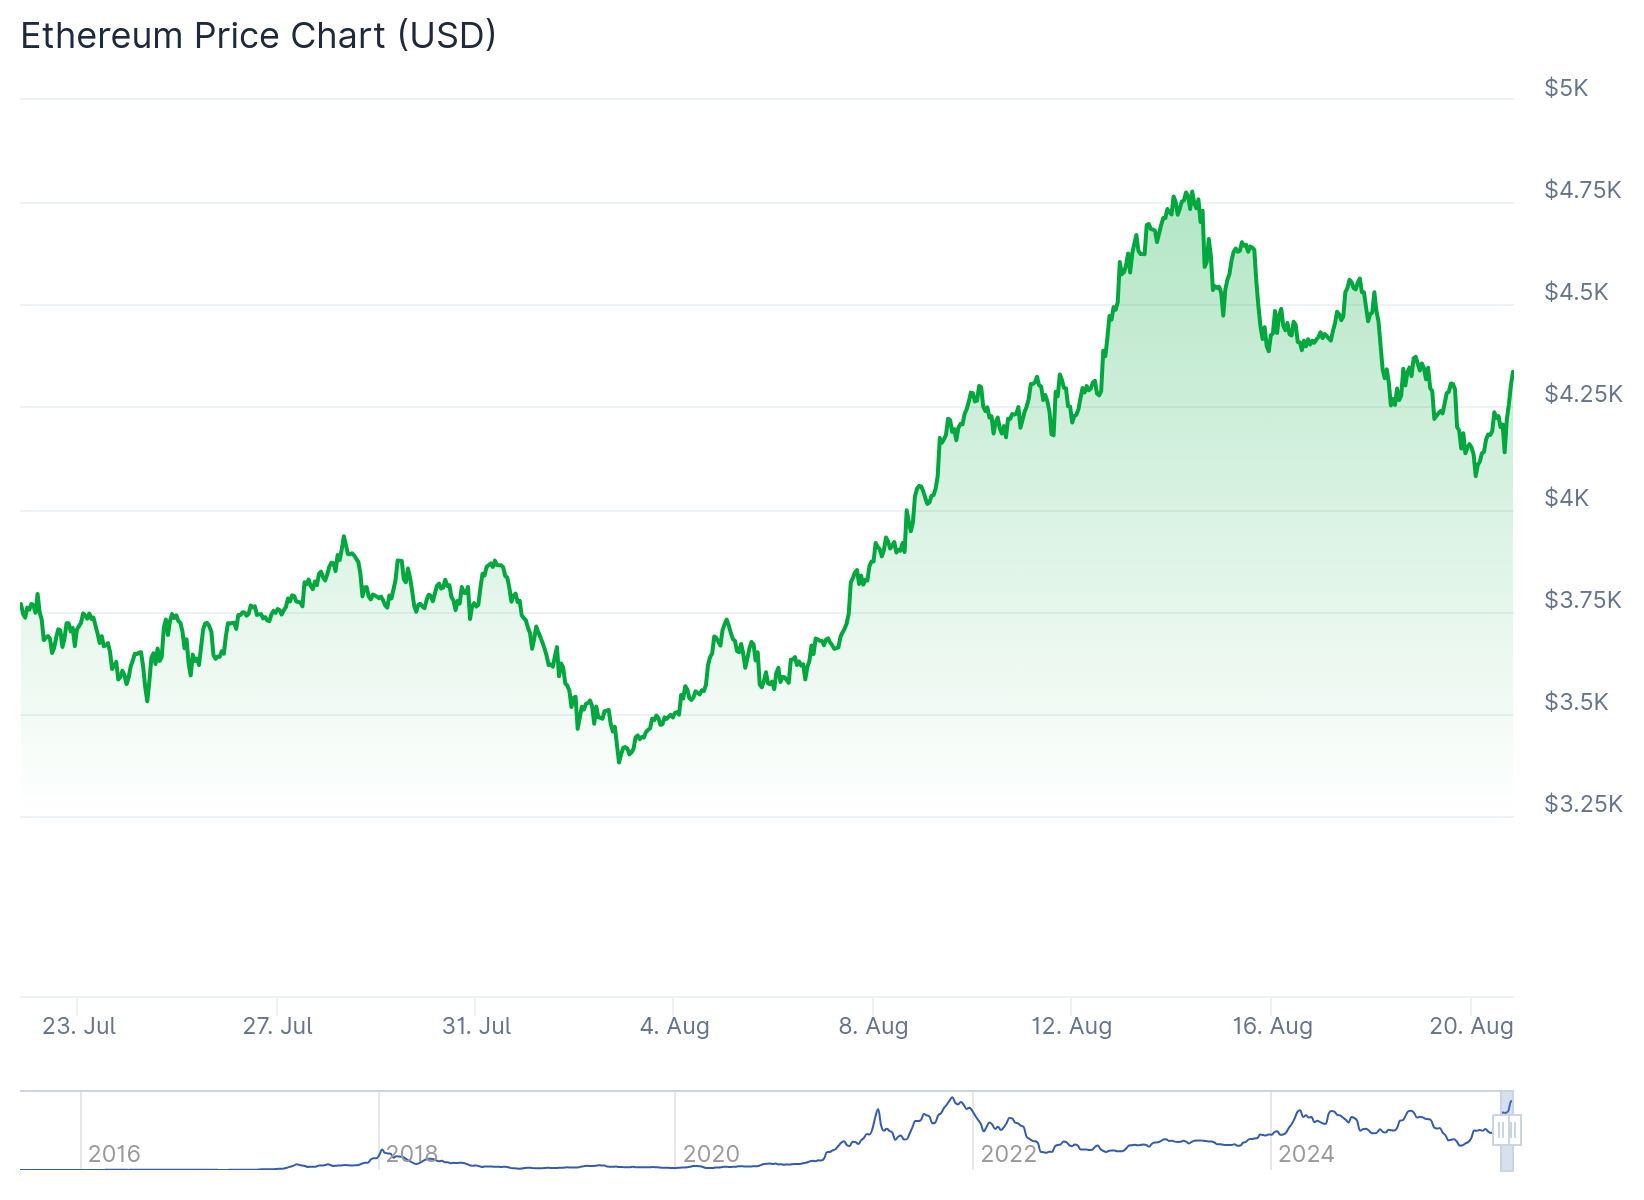
Recent weeks have seen a strong uptrend for ETH. Currently, it trades near $4,300, showing a 4% gain today, 18.5% over the last two weeks, and a 12% increase over the past month, according to price data. Meanwhile, BTC is trading at approximately $113,900, showing no change today or over the past two weeks but is up nearly 93% over the last year.
Capital has increasingly flowed into ETH during August, as its net position changes have climbed by 23%, reports CEXIO. Conversely, Bitcoin’s net positions have decreased by approximately 43%.
The report elaborates, “Consequently, Ethereum now leads in capital rotation, suggesting that traders are moving funds into ETH at the expense of Bitcoin.”
However, the report offers a word of caution, suggesting that while this shift could benefit Ether in the short-term, it might indicate a late stage in the market cycle, which could lead to a deeper correction in the medium term.
The report draws parallels with previous cycles, noting that Ethereum has historically attracted a larger share of capital inflows than Bitcoin during the final months of bull runs, potentially signaling an upcoming market downturn.
ETF Inflows and Outflows
Last week, spot ETH exchange-traded funds (ETFs) experienced net inflows of approximately $3.5 billion, exceeding the previous weekly high of $2.1 billion recorded in mid-July. As previously reported, ETH ETFs also established a new daily inflow record last week, attracting roughly $1.02 billion on Monday, August 11th.
Comparatively, spot BTC ETFs had a less impressive week, with net inflows totaling around $793 million. These figures suggest a growing interest in Ethereum from Wall Street.
So far this week, both ETH and BTC ETFs are experiencing net outflows. Data from SoSoValue reveals that BTC ETFs have seen approximately $659 million in outflows, while ETH ETFs have recorded around $686 million in outflows.