

Essential Points
- Following its listing on Robinhood on July 25th, the price of HBAR experienced an 8% increase. This upward trend has been evident throughout July and is projected to continue, with a potential price target of $0.39.
The Hedera (HBAR) cryptocurrency saw positive price movement after Robinhood announced they would list HBAR for trading on their platform. Robinhood is a widely used platform that supports the trading of numerous prominent digital assets.
The availability of Hedera’s token on Robinhood is expected to broaden its appeal to a wider audience.
The announcement of the Robinhood listing occurred on July 25th, triggering an 8.19% price surge for HBAR. Notably, buyers were actively testing the $0.285-$0.3 resistance area.
This price range has served as a major area of resistance throughout 2025.
AMBCrypto investigated the underlying reasons for this and explored whether the recent development positions the altcoin to potentially rally towards its record high of $0.569.
Identifying HBAR’s Next Support Level
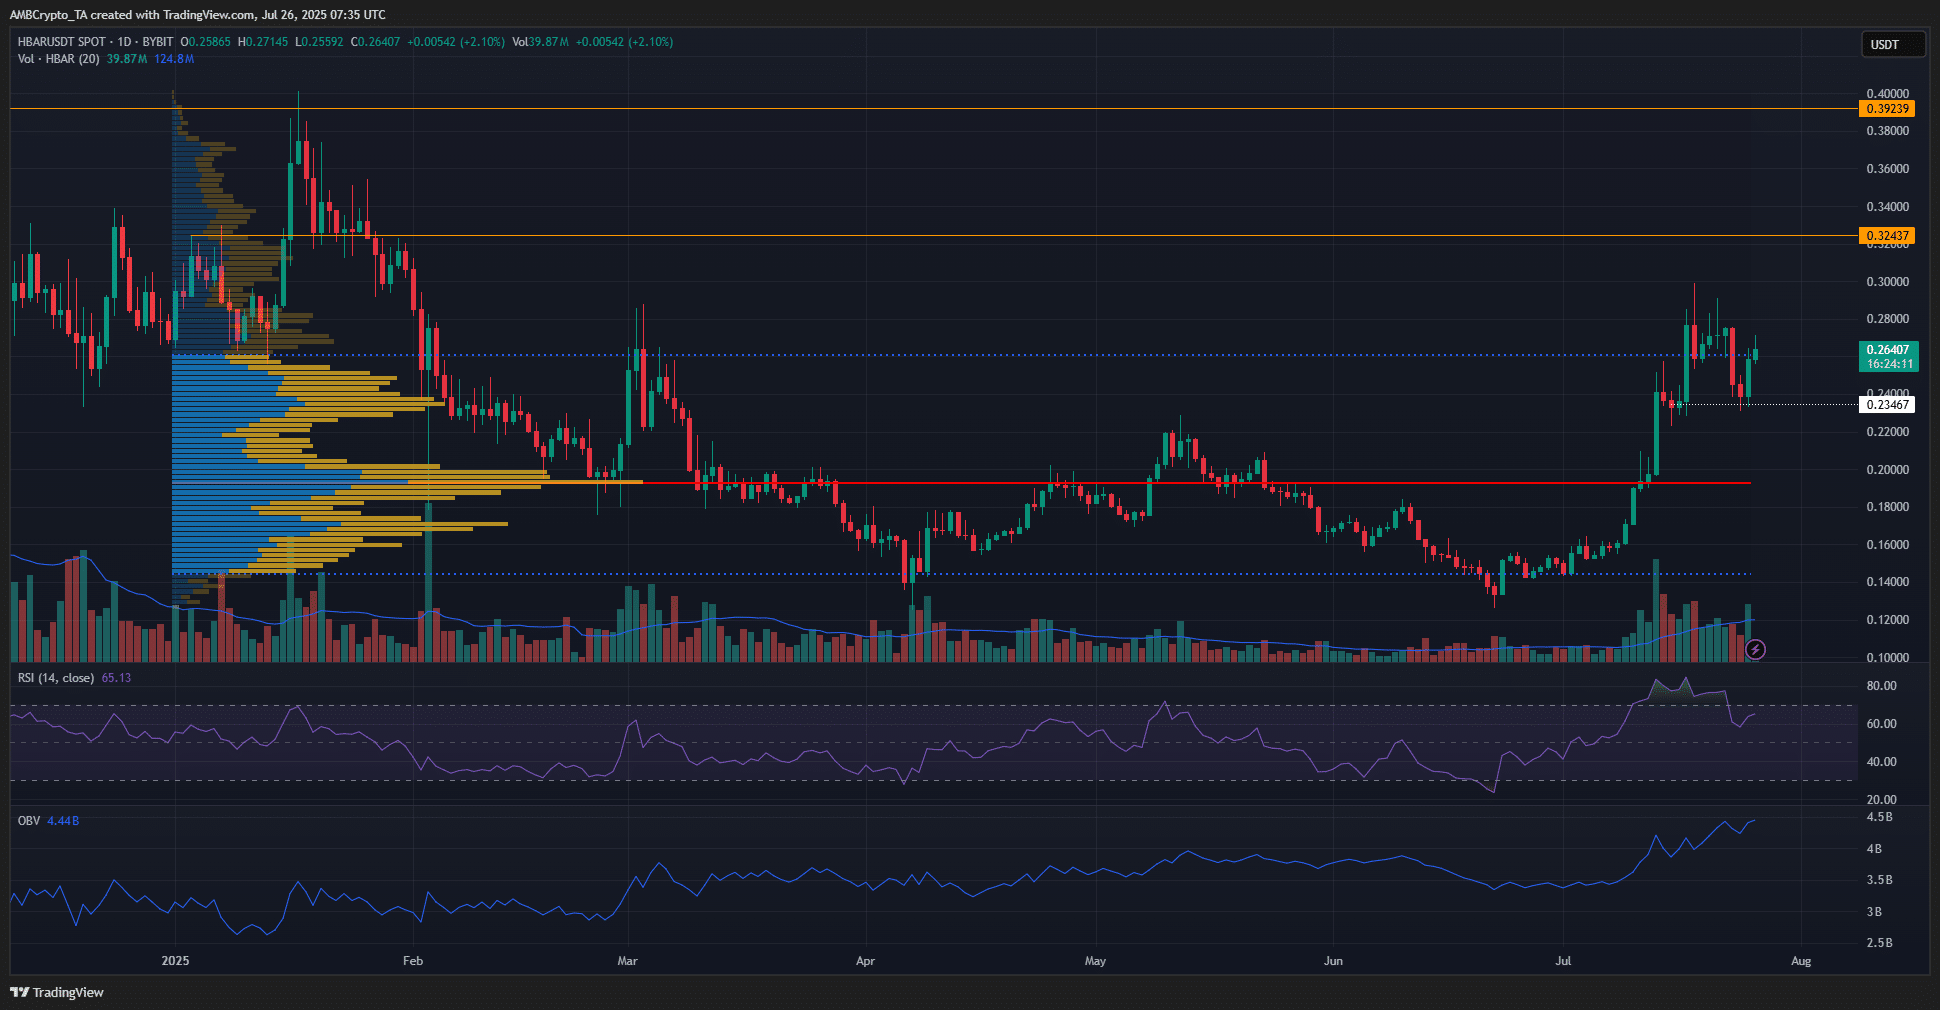
Source: HBAR/USDT on TradingView
The provided daily chart illustrates the Fixed Range Volume Profile for HBAR’s price movements in 2025.
The Point of Control, situated at $0.192, shifted to a support level in early July. The Value Area High (indicated by the dotted blue line) was at $0.261, with HBAR trading slightly above this level at the time of writing.
The significant gains observed in July have established a bullish market structure. Even the pullback from $0.3 did not result in a lower low, as the price remained above the $0.234 support level.
Momentum Indicators Suggest Further Gains
During the aforementioned pullback, the Relative Strength Index (RSI) decreased from overbought territory to a healthy bullish value of 65.
This indicates that HBAR’s price has room for further upward movement.
Concurrently, the On Balance Volume (OBV) is steadily increasing, which implies consistent accumulation and buying pressure throughout the rally.
Overall, the indicators suggest that HBAR is likely to experience additional gains in the coming weeks.
A price decline below $0.223 would signal potential challenges for buyers in the short term. Conversely, a rally surpassing the $0.28-$0.3 range would set the next targets at $0.324 and $0.392.
Disclaimer: This analysis is intended for informational purposes only and should not be considered as financial, investment, or trading advice. The views expressed are solely those of the author.