

The value of Solana surged almost 7% from its low on August 7, successfully breaking through a declining trend that had persisted for five weeks, thanks to updated supply proposals and renewed interest from institutional investors.
Summary
- Solana’s price increased from $72.49 to $77.36, exiting a five-week downtrend.
- The Supertrend indicator flipped bullish at $75.02, reinforcing the breakout pattern.
- Liquidation points are clustered at $78 and $80, potentially boosting gains if buying momentum continues.
- Daily momentum indicators are mixed, with $74–$75 serving as the key level for breakout invalidation.
Solana’s Price Surpasses Five-Week Downtrend
As reported by crypto.news, Solana (SOL) traded at approximately $76.93 on August 10, reflecting a near 7% rise since its low of $72.49 on August 7. This uptrend allowed SOL to breach the upper limit of a declining channel that had constrained its pricing since early July.
Analyzing the 4-hour chart, SOL initially regained $74.30 and subsequently broke out of the channel near $75, reaching an intraday peak of $77.36, where it faced initial resistance.
Overall trading volume increased during this breakout, while the bull-bear power indicator rose to 1.23, suggesting that buyers currently hold a short-term advantage over sellers.
The Supertrend indicator has now shifted to bullish below the market, providing dynamic support at $75.02. Staying above this threshold will maintain a bullish 4-hour outlook and could convert the previous channel resistance into support.
Crypto analyst Dami-Defi highlighted this structural change in a post on X on August 10.
“SOL has officially escaped a five-week declining trend,” the analyst noted.
However, the breakout has yet to confirm a more extensive trend reversal, with SOL still significantly under its May peak near $97 and its January high exceeding $145.
Factors Boosting the SOL Recovery
The price surge aligns with increasing validator support for two proposals aimed at curbing Solana’s future supply growth.
Proposal SIMD-0550 would elevate the annual disinflation rate from 15% to 30%, accelerating the network’s path to its terminal inflation rate. Meanwhile, SIMD-0553 seeks to implement resource-based transaction fees, potentially raising daily SOL burns from about 650 tokens to between 7,500 and 9,000.
The formal approval process for these proposals is set to conclude by August 18 and requires validators’ agreement, meaning that the anticipated supply impacts aren’t guaranteed. According to Solana’s governance forum, SIMD-0550 would effectively double the rate of inflation reduction.
Recent institutional moves have also heightened demand. BlackRock recently launched its Daily Reinvestment Stablecoin Reserve Vehicle, capable of recording ownership across multiple public blockchains, including Solana. This product holds cash, short-term U.S. Treasury securities, and repurchase agreements rather than SOL itself.
Western Union is enhancing its utilization of the Solana network, having issued its USDPT stablecoin on Solana through federally regulated Anchorage Digital Bank. A corresponding Stablecard product has been introduced in 37 markets, with Western Union officially launching USDPT on Solana in May.
While these developments don’t necessitate substantial SOL purchases from institutions, they reinforce Solana’s case as a platform for regulated investments and dollar-denominated transactions.
SOL Eyes $78 Liquidity, Approaching $80
According to the three-day liquidation heatmap, the nearest concentration of leveraged positions falls in the $77.80 to $78.20 range, aligning with the next horizontal resistance indicated on the 4-hour chart.
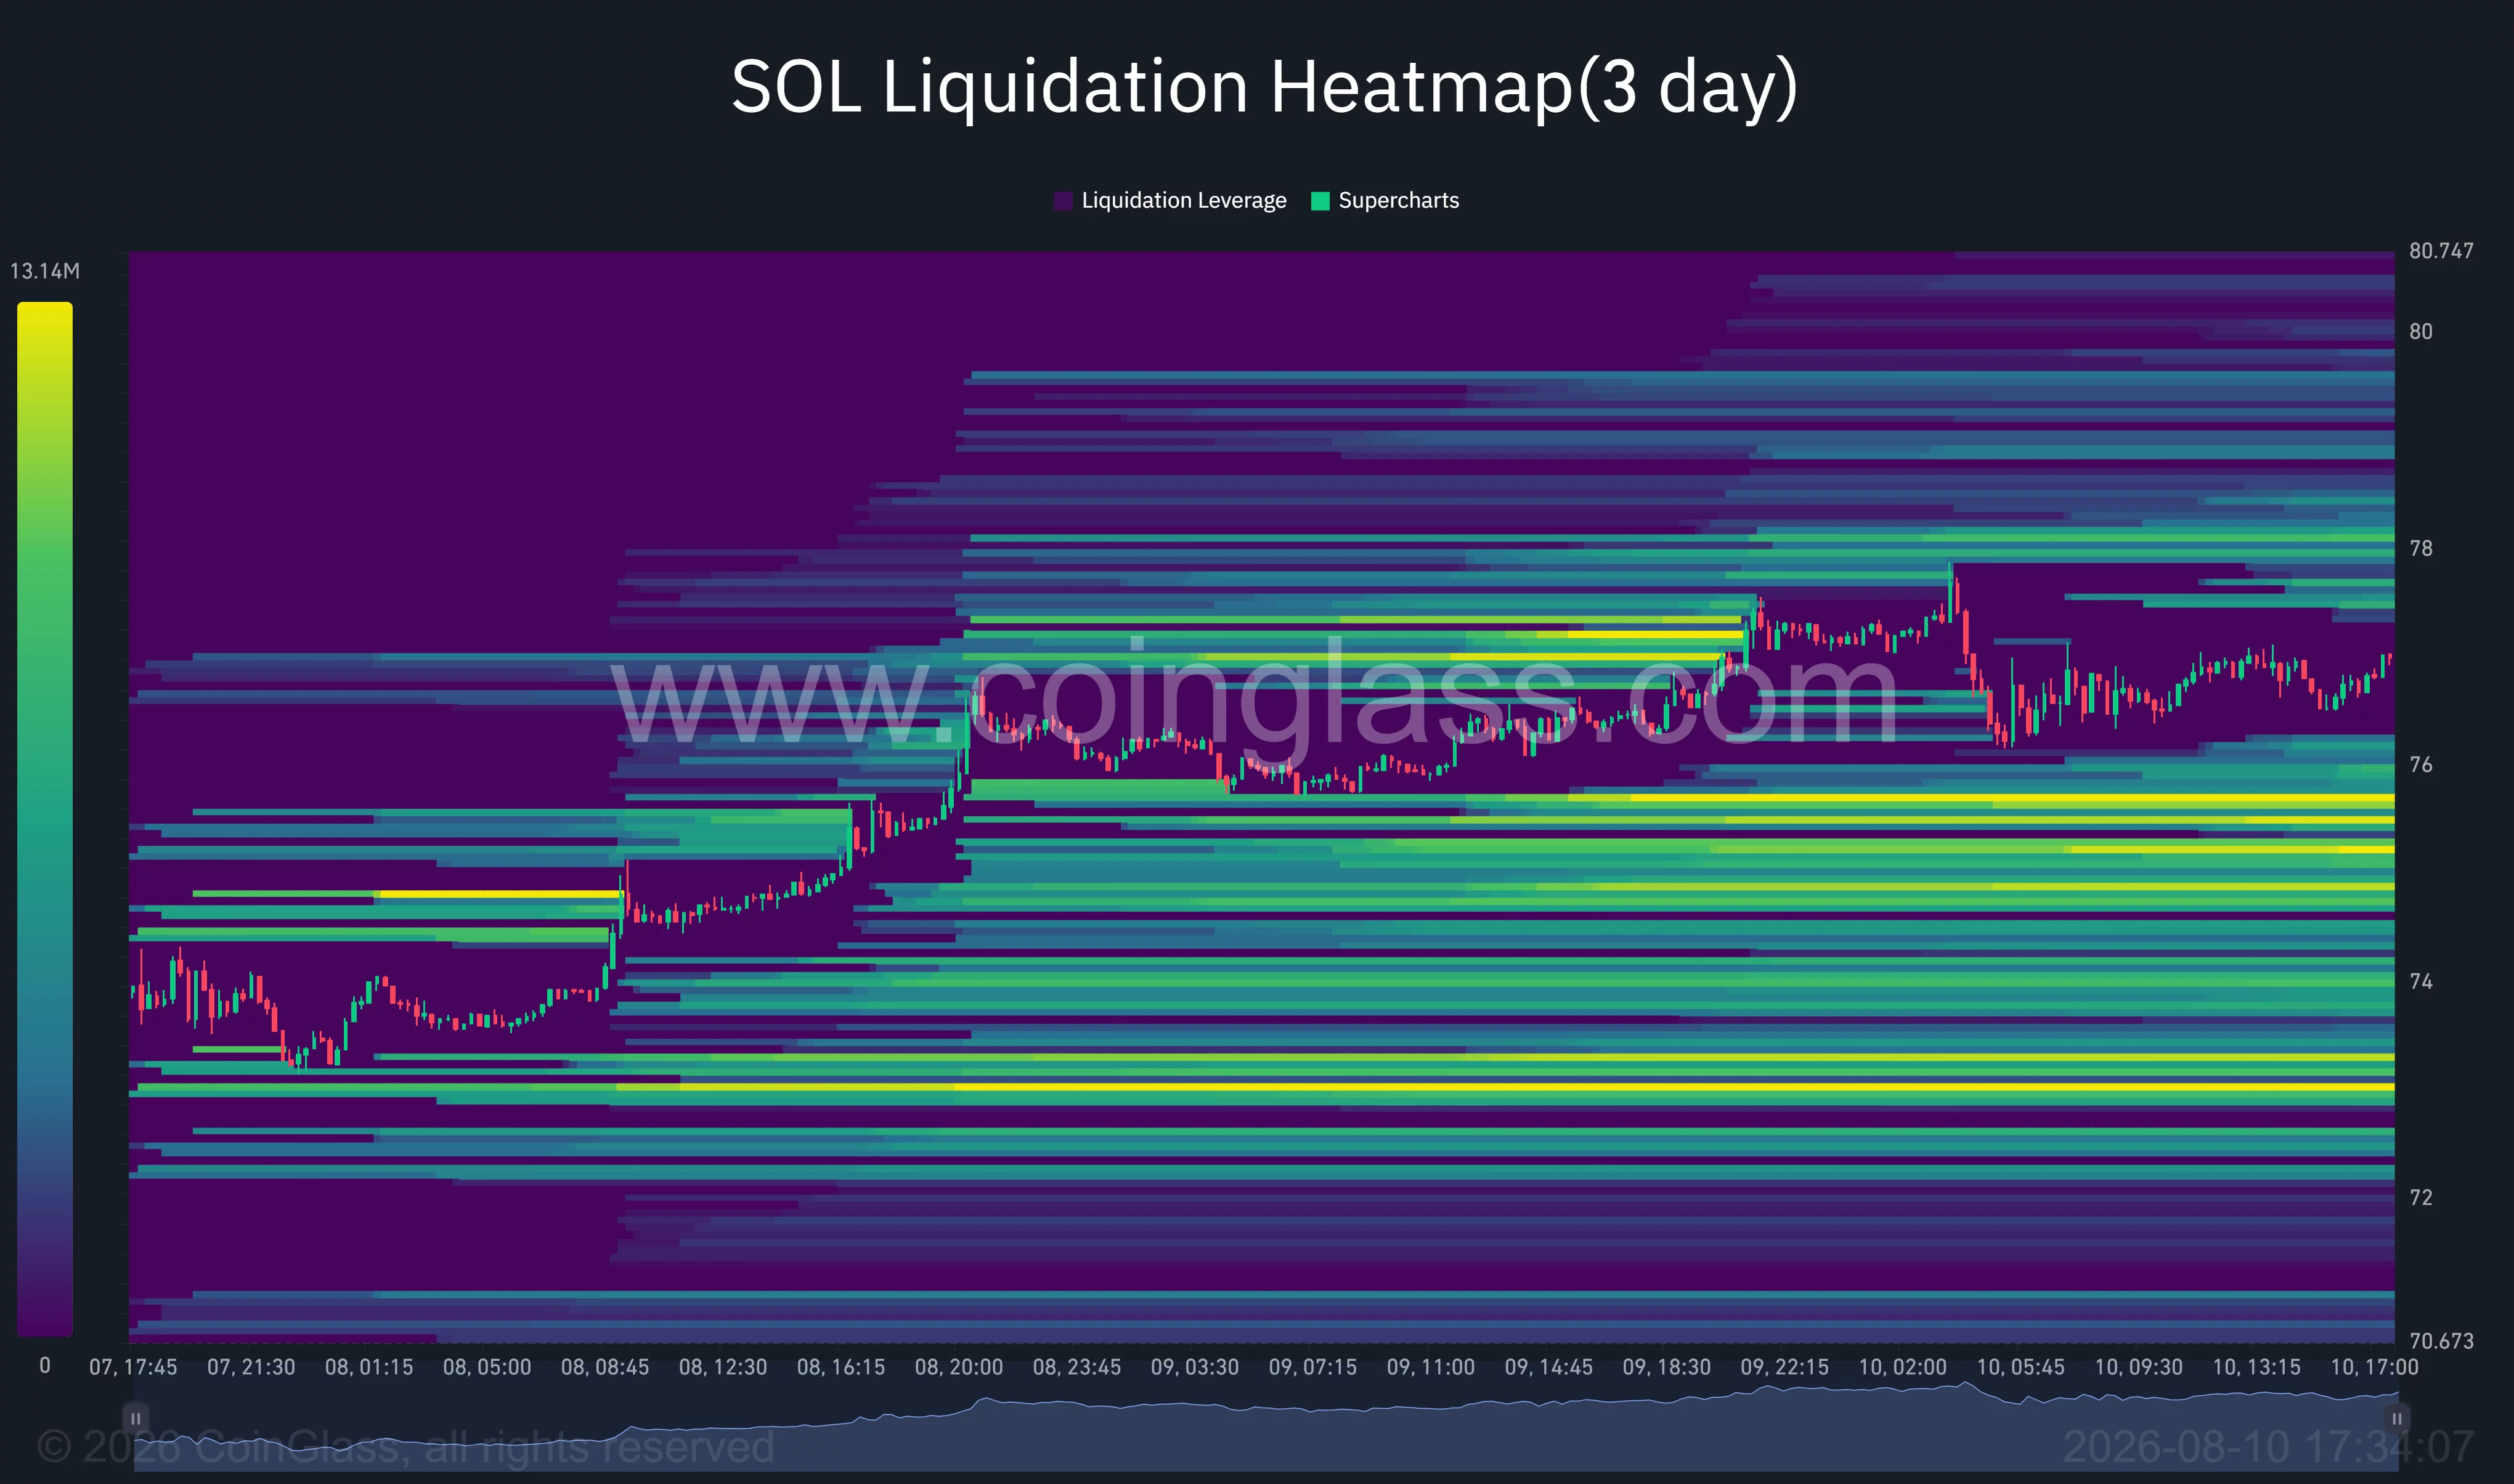
A move past $78 could spark another wave of short liquidations, paving the way towards $80. Resistance levels from the previous channel and earlier July swings suggest that larger resistance lies between $82 and $84.
Dami-Defi’s analysis presents a target of around $83 if SOL can successfully retest the broken trendline.
Michaël van de Poppe has a more ambitious long-term forecast, stating in an August 10 market update that SOL has set a higher low against Bitcoin, potentially recovering towards the $100 to $120 range.
For that target to materialize, SOL must overcome several resistance levels that are not evident in the current short-term breakout. The initial tests remain at $78, $80, and $83.
Daily Chart of Solana Awaiting Confirmation
While SOL’s daily chart shows signs of recovery, it has yet to produce a fully confirmed bullish reversal.
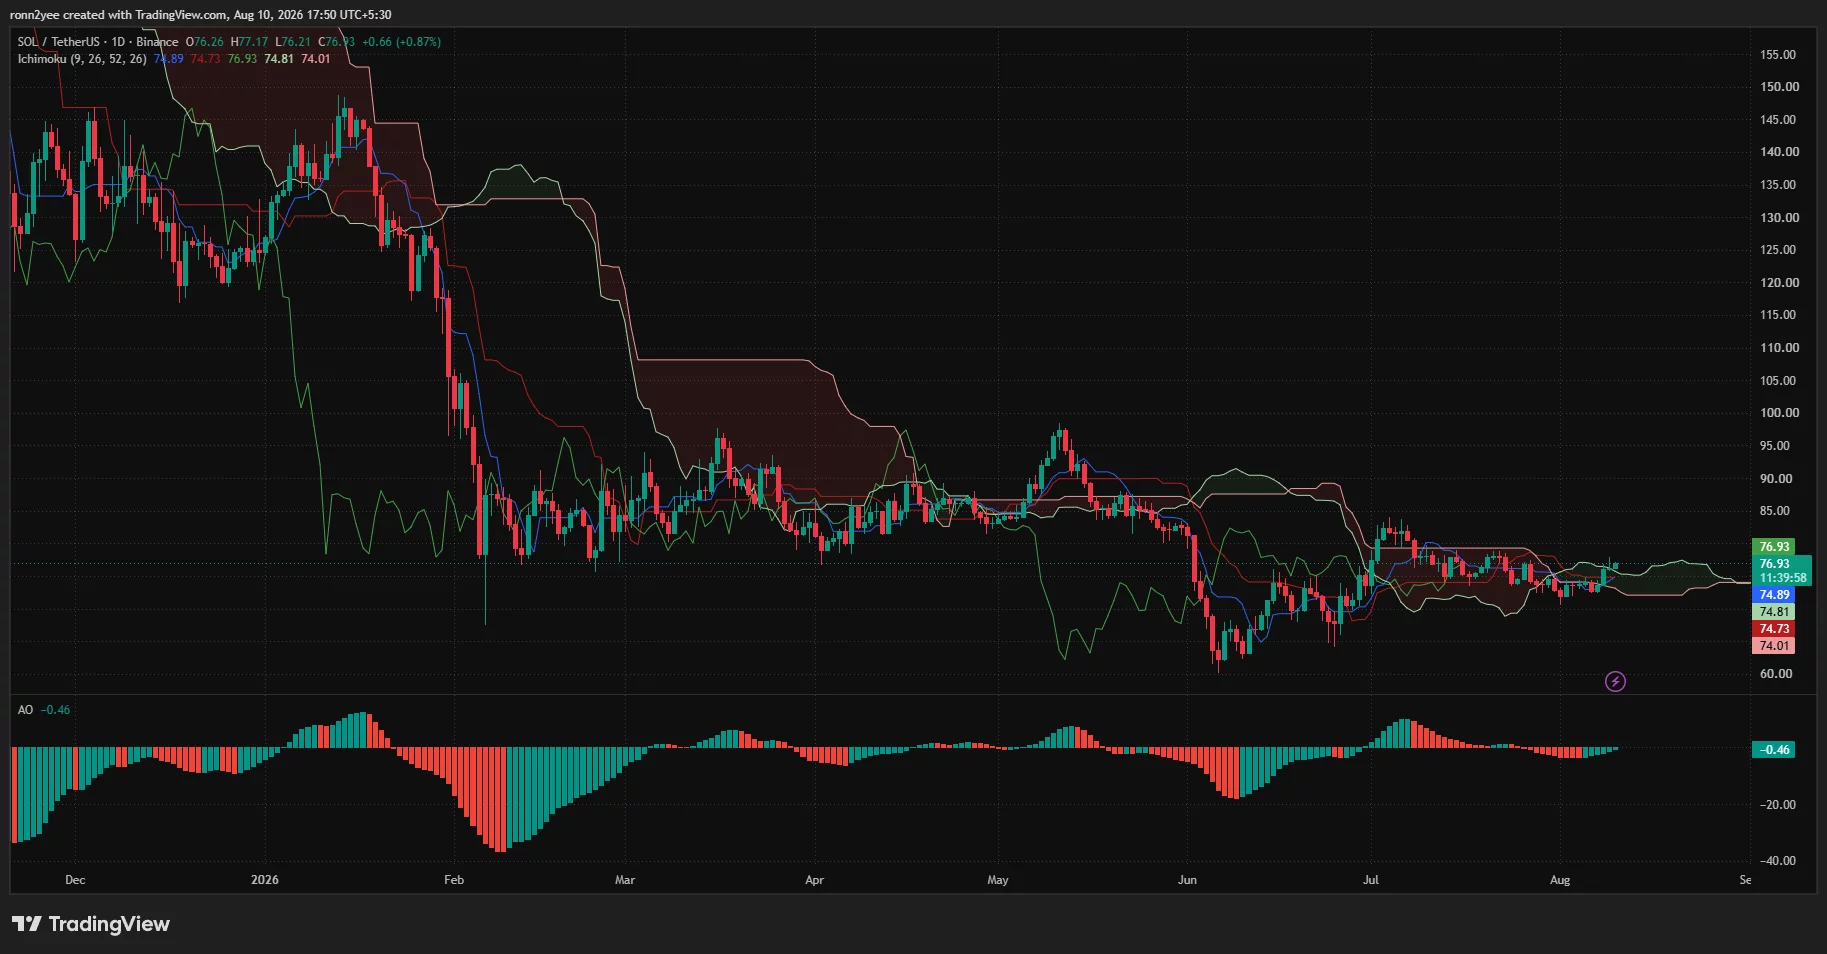
The price has risen above the Ichimoku conversion line at $74.89 and the baseline at $74.73, while SOL is attempting to break through the upper edge of the cloud near $76.93, making this area crucial for daily closure.
A consistent close above the cloud could solidify prospects for a move towards the $80–$84 range. However, a rejection around $77 may lead SOL back to test the Ichimoku cluster between $74.73 and $74.89.
The Awesome Oscillator indicates slightly negative momentum at -0.46, but with contracting red bars, it suggests that bearish pressure is subsiding, yet not fully reversed.
Liquidation data complements the downside risk levels, revealing significant long-liquidation concentrations around $75.70, $75.10, and $72.80. If SOL drops below $75, forced selling may push the price down towards $73 before buyers can reclaim control.
U.S. Developments Continue to Impact SOL
Solana’s institutional appeal increasingly aligns with regulated U.S. financial frameworks. BlackRock’s fund structure utilizes tokenized ownership based on Treasury-backed assets, while Western Union’s USDPT is issued through a federally chartered crypto bank.
A future catalyst for the network is the anticipated Alpenglow rollout, aiming to enhance transaction finality from approximately 12.8 seconds to between 100 and 150 milliseconds, with phased implementation anticipated between August and October, contingent on successful testing.
At present, SOL’s 4-hour breakout favors buyers as long as the price remains above $75. A daily close above $78 would provide stronger backing and shift attention towards $80–$84. However, falling below $74 could jeopardize the breakout and reopen paths toward $72.80.
Disclosure: This article does not constitute investment advice. The content and information presented on this page are solely for educational purposes.