

Litecoin’s value has surged past $74 by overcoming resistance around the $64–$65 mark, and a golden cross on the daily chart has added fuel for traders to see if it can break through $75.
Summary
- On September 24, Litecoin hit approximately $74.77 after starting the day around $61.85.
- The 50-day moving average has crossed above the 200-day average, hovering close to $51.
- The recent 4-hour analysis identifies immediate resistance at $75, with an additional level at $78.13.
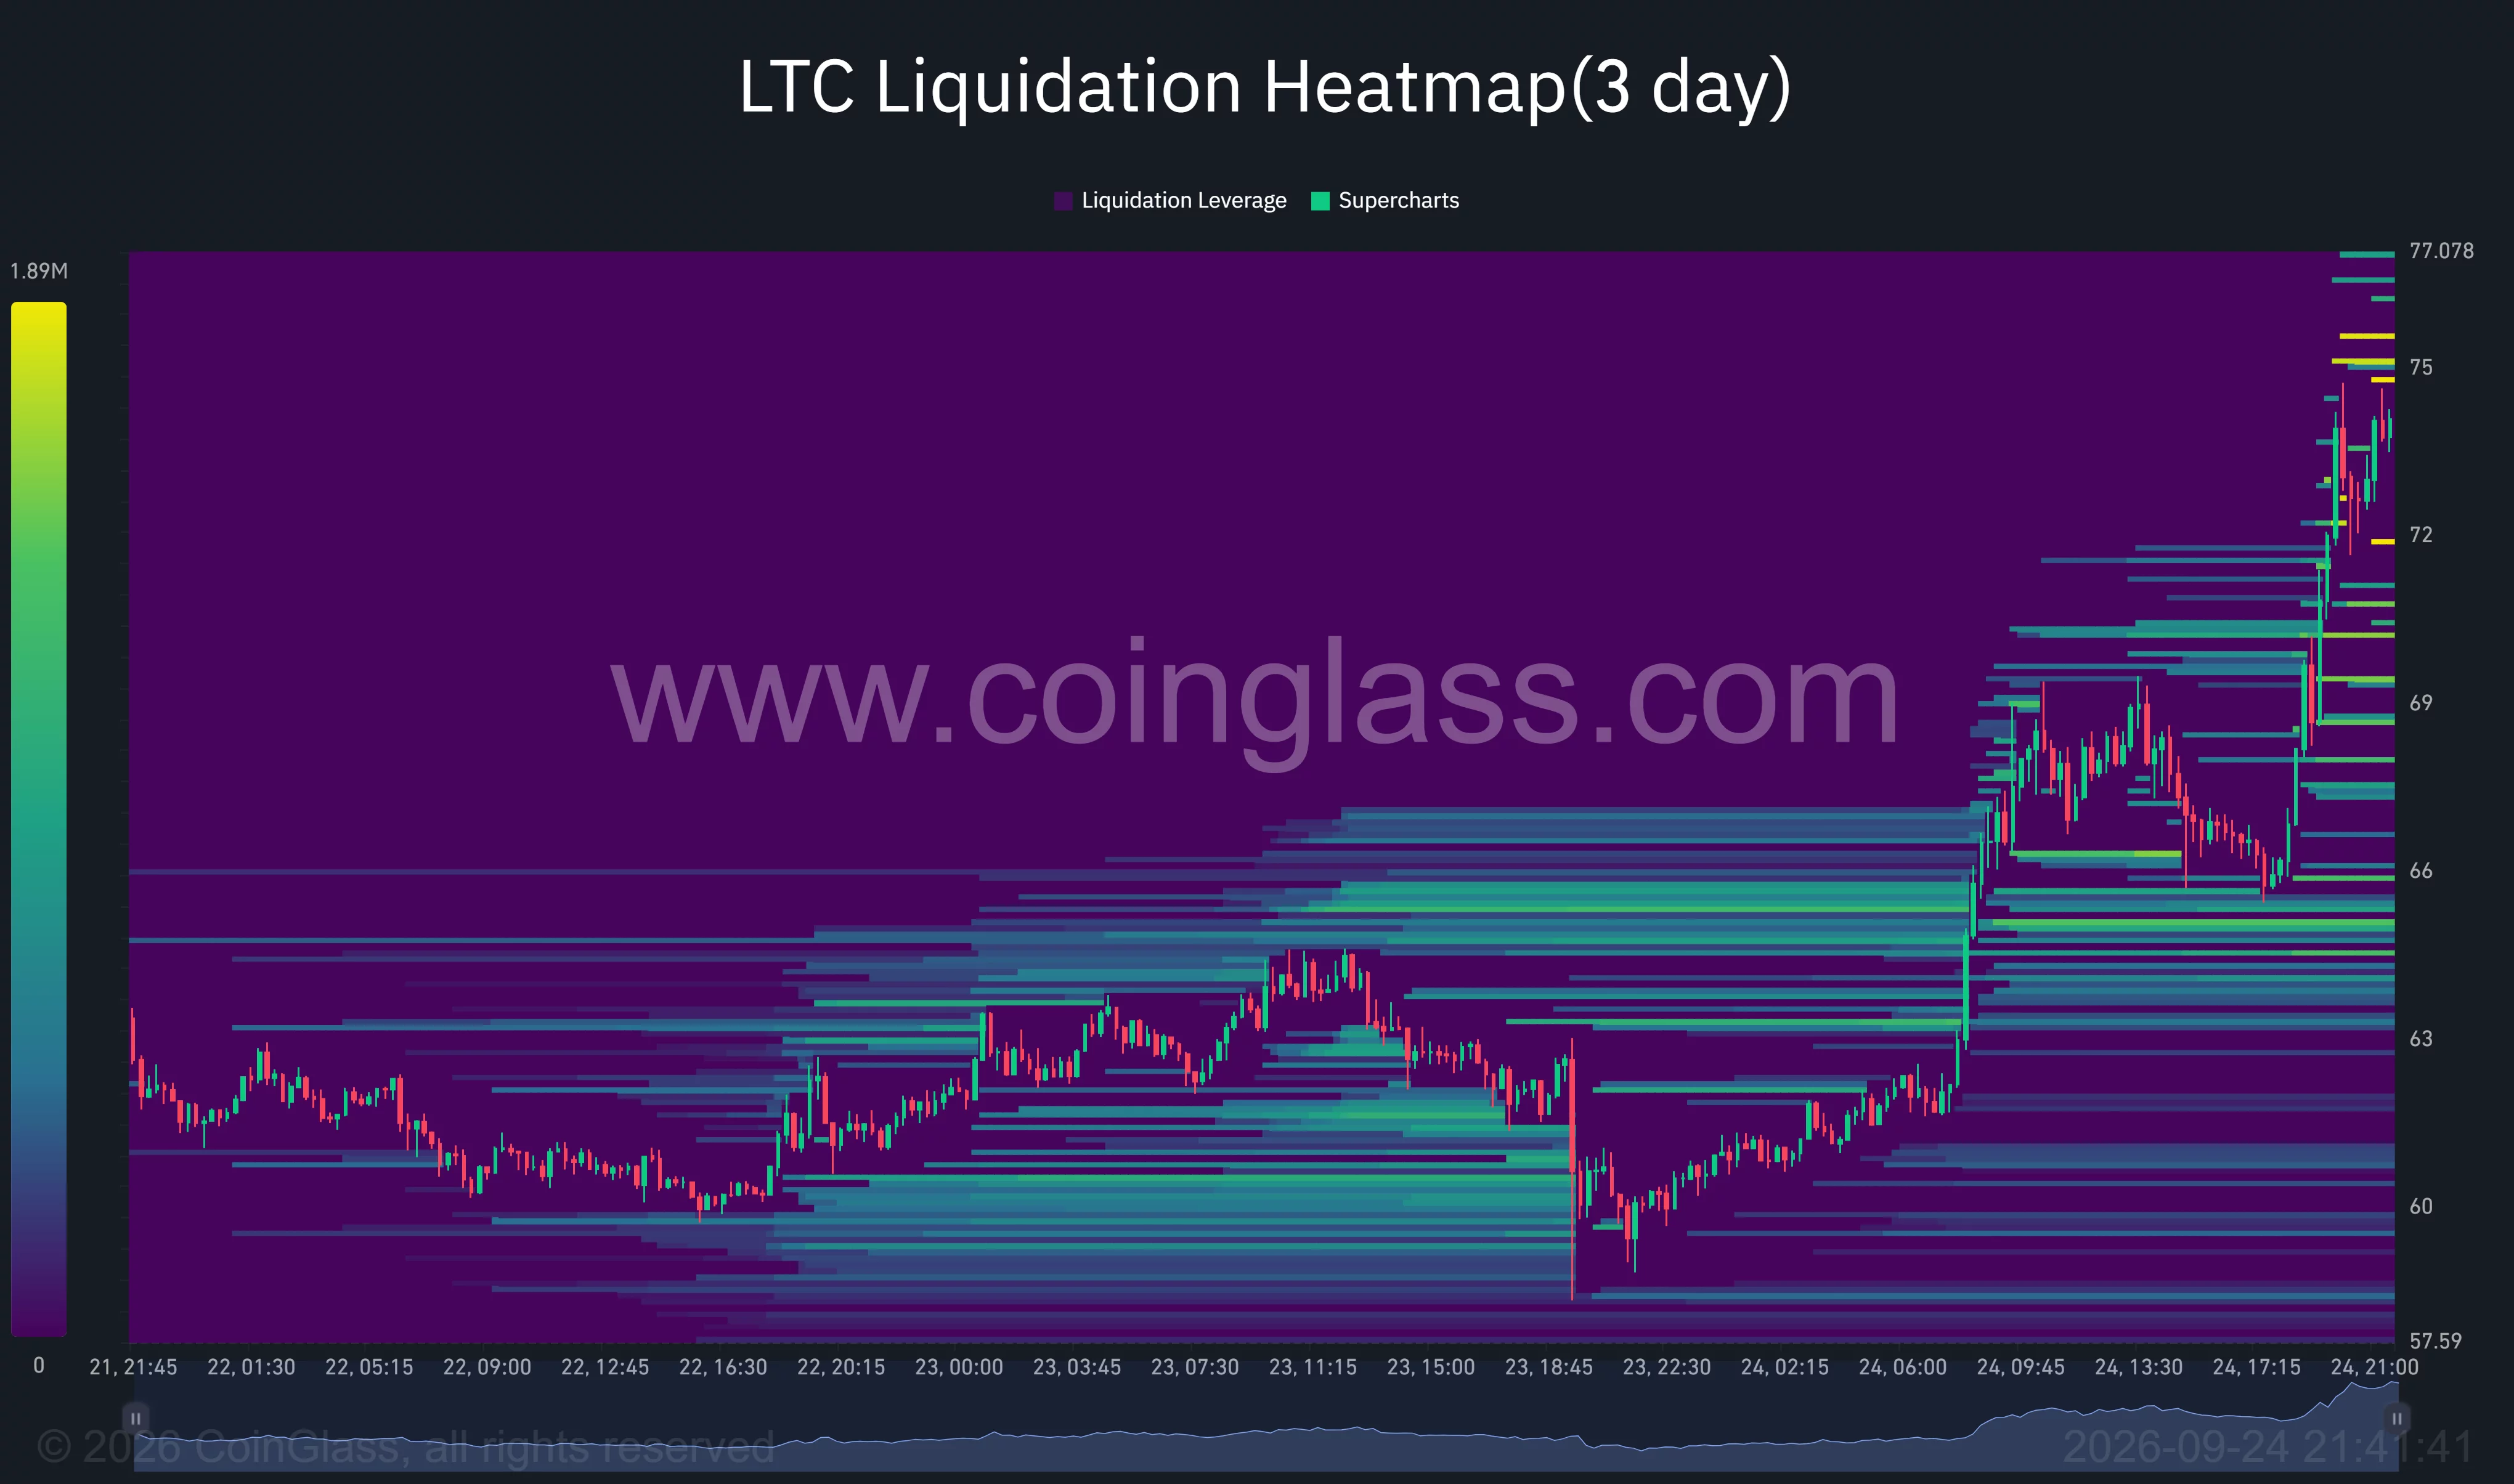
- According to CoinGlass’s three-day heatmap, potential liquidation levels are clustered near $75–$77.
When the daily LTC/USDT chart was taken, Litecoin traded around $74.20, reflecting a nearly 20% increase from its daily opening price. It reached a temporary peak of $74.77, marking a recovery from mid-September lows and breaking past the previously challenging $64–$65 resistance zone.
The daily chart reveals the 50-day moving average at roughly $51.33, positioned above the 200-day average of around $50.67. This crossover is termed a golden cross. With both averages being significantly lower than the current price, the immediate focus is on whether buyers can maintain the breakout above $70 and push past $75.
Recent data from the Litecoin Foundation has highlighted the activity around this price movement. On September 23, over 17 million LTC, valued at more than $1 billion, was transacted across the network within a single day. This metric monitors blockchain transactions rather than exchange trades, so it does not clarify how much of the price increase stemmed from actual market demand.
Litecoin Approaches $75 Resistance Post-Strong 4-Hour Momentum
The 4-hour chart illustrates Litecoin’s quick ascent through several price thresholds. After remaining under $65 earlier in the day, it broke through the $65.63 resistance, climbed above $68.75, and crossed $71.88.
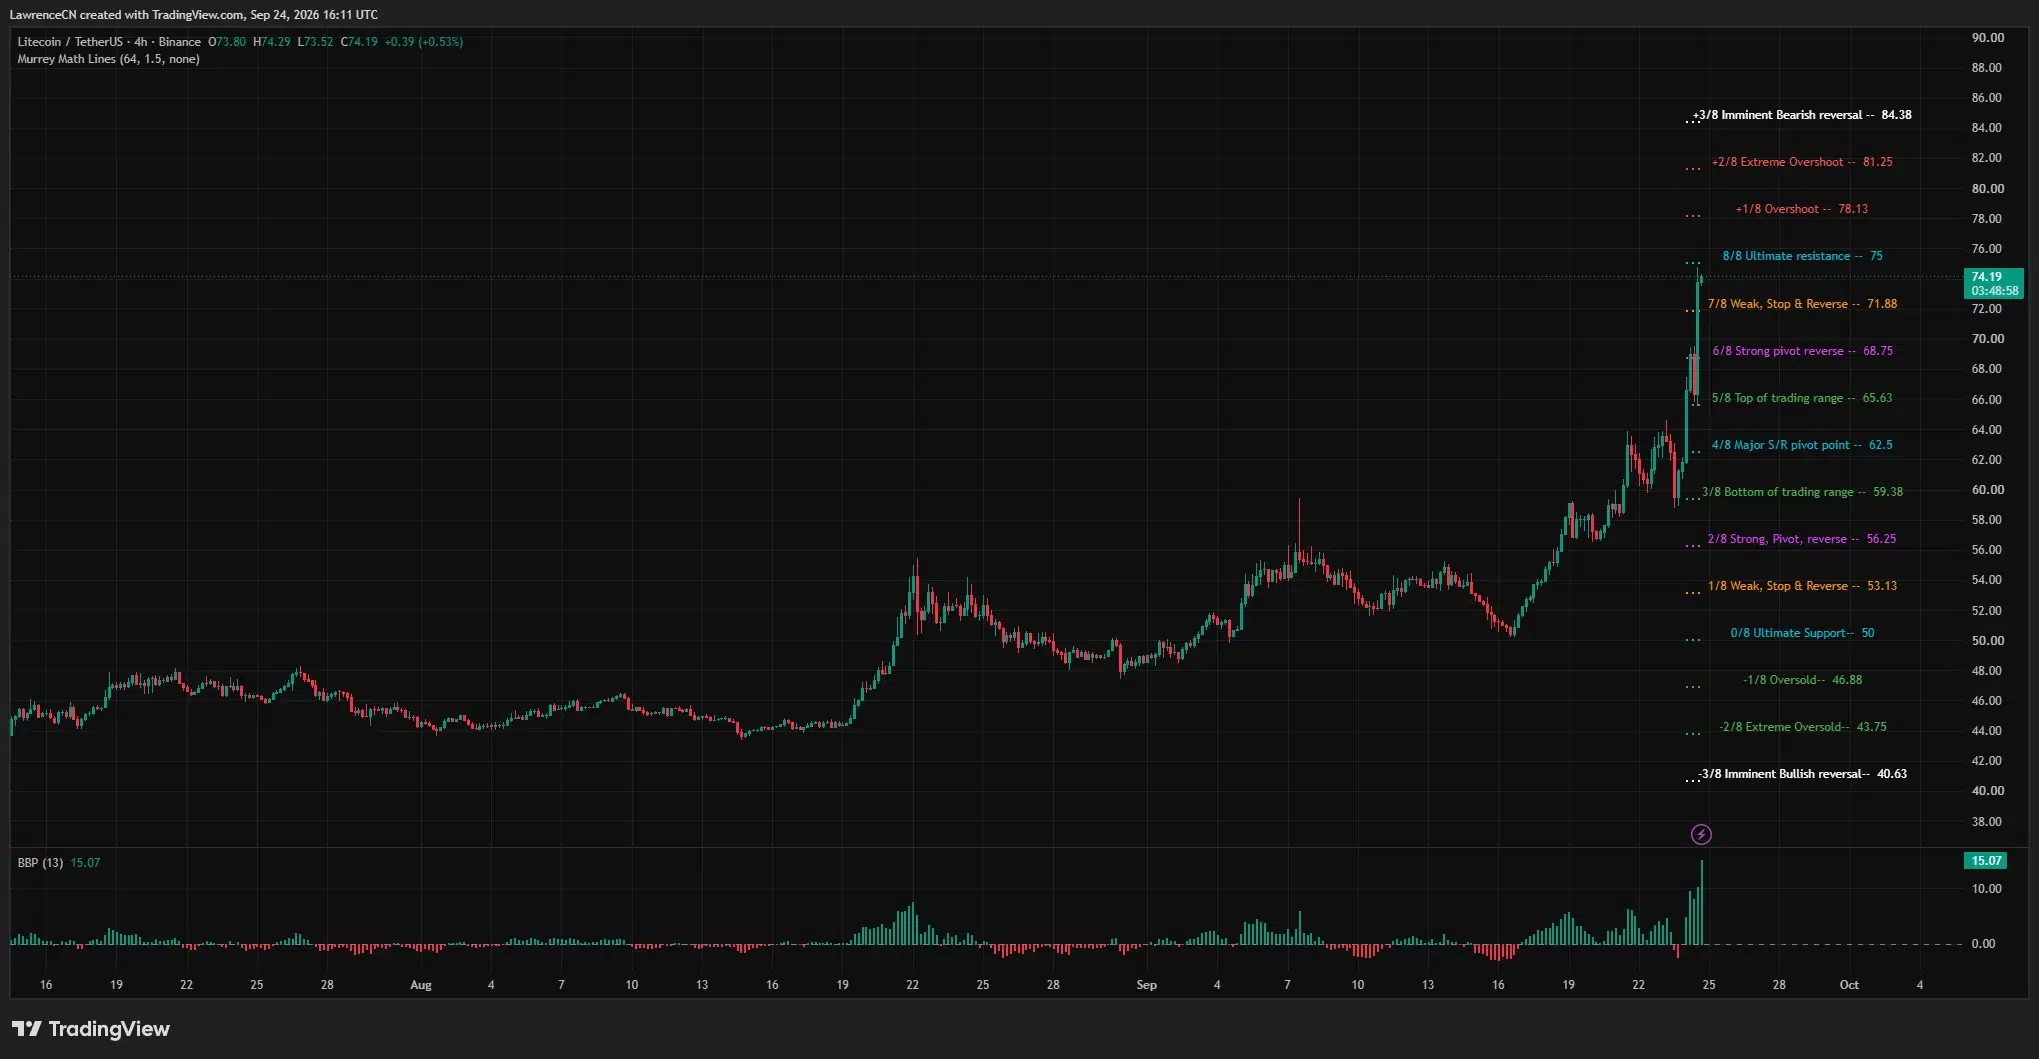
The most recent 4-hour candle reached around $74.29 and was near $74.19 during the chart’s capture, inching closer to the $75 resistance indicated by the chart’s Murrey Math levels. A sustained move above $75 could set sights on the $78.13 level.
The speed of this increase is crucial for this test. The 4-hour BBP momentum reading rose to 15.07 as Litecoin neared $75, indicating a sharp upward move past recent levels. Strong momentum during a breakout can prolong the upward trend, but buyers must continue to defend the recently surpassed price levels.
The daily AO indicator has also increased to 8.47, one of its highest readings in months. This rise supports the upward momentum reflected in the price candles, while the golden cross indicates a gradual shift in the daily trend. However, these signals do not confirm that the $75 level has been successfully breached.
CoinGlass’s three-day liquidation heatmap indicates potential liquidation bands near $75 and further up to $77. If Litecoin ascends into these ranges, short positions might experience pressure to close. These bands signify possible liquidation levels rather than actual liquidations that have already taken place.
Previous trading illustrated how swiftly short covering can impact Litecoin’s price. A rapid increase from approximately $61.92 to $66.36 early on September 24 coincided with reported short liquidations across major exchanges. Data from CoinGlass also indicated that Litecoin futures open interest exceeded $500 million, suggesting many positions were active as the rally developed. Open interest alone cannot determine whether traders expect an increase or decrease in price.
What If LTC Fails to Maintain the Breakout?
If Litecoin declines before establishing a secure position above $75, the 4-hour chart highlights $71.88 as the first critical level beneath the current value. A fall below this could redirect focus to the $68.75 pivot, followed by the former resistance boundary at $65.63.
The heatmap indicates potential liquidation pressures below the current price, with bands around $69–$71 and $64–$66. A drop into these areas could introduce increased volatility. However, their presence does not necessitate a return to these levels.
The $64–$65 area is particularly significant since it previously limited advances before the surge on September 24. If Litecoin holds above it during a retracement, it would indicate continued buyer support for the breakout. Conversely, a drop below this threshold would revert Litecoin back into its former trading range, despite the crossed daily moving averages.
Coinbase’s U.S. lending platform offers Litecoin as collateral for USDC loans through Morpho on Base for eligible customers, excluding those in New York. While this option is available, it doesn’t link directly to the purchasing activity on September 24, leaving the $75 test and surrounding levels as the main indicators for the immediate rally.
Disclosure: This article is purely for informational purposes and should not be construed as investment advice. The content provided herein is intended for educational use only.