

The price of $Ethereum remains stable at the $2,500 level; however, its movement lacks the strong conviction exhibited by $Bitcoin recently. Currently, $ETH is trading at $2,517.8, showing a slight increase from the previous close of $2,507.6. It reached a peak of $2,546.2 during the day but then retraced quickly. As of now, the candle for the last three hours reflects a 0.35% decline.
The recent failed spike encapsulates the situation and marks the fourth occurrence of this nature within a two-week span.
Factors Behind Ethereum’s Price Stability Above $2,500
Ethereum appears to be benefiting from a similar momentum that propelled Bitcoin on Thursday. Remarks from Fed Governor Christopher Waller led traders to anticipate a hold in rates at the coming September meeting, causing the dollar to weaken and yields to decrease, which in turn boosted liquid-sensitive assets. $ETH rallied from around $2,400 back above the $2,500 mark.
Additionally, there is a genuine structural demand behind the scenes. Over the course of August, Ether surged by 32.5%, with spot ETF inflows totaling $1.852 billion in just one month, alongside a decrease in exchange reserves. Record ETF inflows, coupled with a slight reduction in open interest, indicate that spot purchases—not speculative derivatives—are driving this recovery, making it a more stable situation than typical crypto rallies.
The solid demand combined with lower leverage presents a healthier basis compared to most cryptocurrency surges, explaining why buying activity persists around the $2,400 mark without a dramatic fall.
Insights from the $ETH Chart on the $2,550 Resistance
This is where the outlook for bulls becomes tricky.
Today’s peak hit $2,546.2, which isn’t arbitrary. This resistance aligns closely with the 50-week moving average at $2,542, as emphasized by analyst Ted Pillows, who noted Ethereum’s repeated failures to break past $2,550. Sellers have consistently thwarted numerous attempts to rise above this threshold.
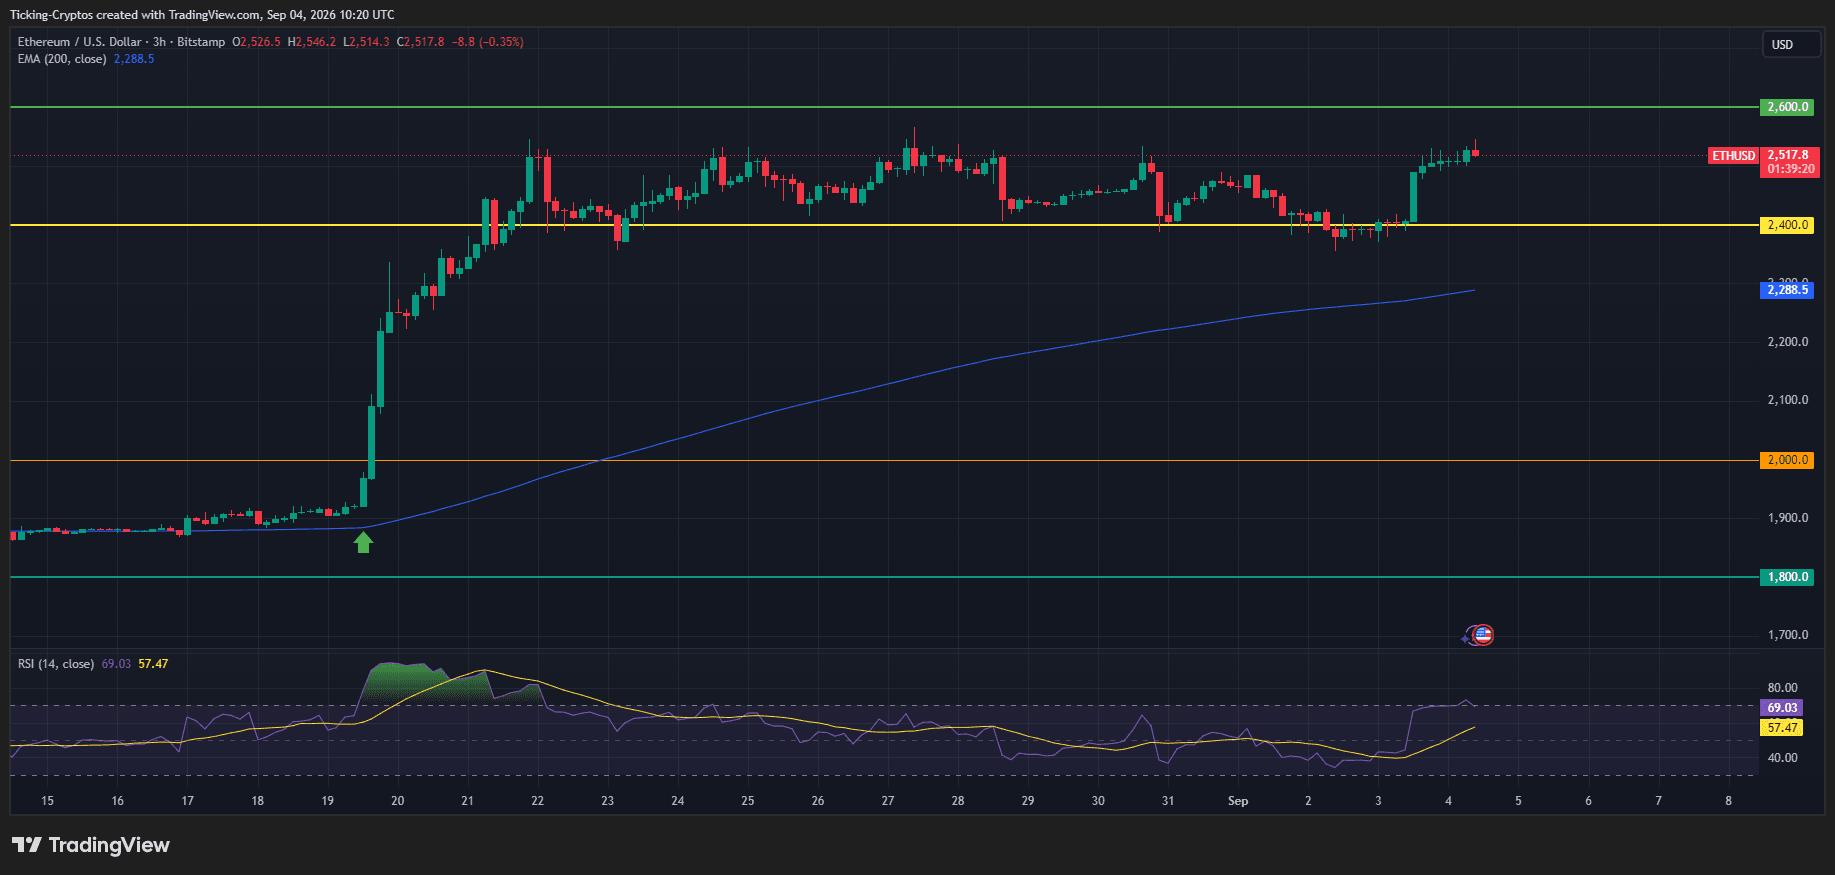
Thus, $ETH didn’t fall short at a significant psychological point today; it failed at a weekly moving average that has constrained this market for a year. Analyzing the 3-hour chart reveals a clear pattern: since August 21, Ethereum has fluctuated within a range of roughly $2,380 to $2,580, with the upper edge tightening with each approach.
The overall structure remains robust:
- The 200 EMA is positioned at $2,288.5 and is on a pronounced upward trajectory. $ETH is trading about 10% above this mark.
- The $2,400 level has repeatedly been supported, including during Wednesday’s downturn.
- The mid-August support around $1,880 to $1,900 has become a distant memory following the rapid price adjustment on August 19 and 20.
This August adjustment broke the descending trendline that limited previous rallies since the August 2025 peak at $4,958, a line that held for nearly a year, resulting in a weekly candle reflecting gains exceeding 31%.
The trend is strong, yet the ceiling remains pressing. This signifies potential for growth rather than indicating a faulty structure.
Is Ethereum’s RSI in Overbought Territory?
Not exactly, which might be the most constructive aspect of the current chart.
The RSI(14) stands at 69.03, compared to its moving average of 57.47. It’s teetering on the edge of the overbought zone without crossing it yet. In contrast, Bitcoin recently surged beyond 72 while its signal line stayed in the mid-40s.
This distinction is essential. Bitcoin’s recent movement was a sharp one-day correction, leaving the indicator overstretched and susceptible. Meanwhile, Ethereum’s rise has been more gradual, achieving this position over multiple sessions, aided by a rising RSI average. This embodies a more sustainable upward trajectory as opposed to a sudden spike.
The caveat is that with an RSI of 69, there’s minimal room left before momentum sellers may emerge, which is precisely what occurred at $2,546 this morning.
Why Is Ethereum Outperforming Bitcoin in This Cycle?
One aspect warrants closer scrutiny. Ethereum has established a higher cycle peak, while Bitcoin has not, indicating stronger relative momentum.
Bitcoin is still trading below its own cycle high and spent yesterday regaining a level it had previously reached in August. In contrast, Ether has built a structure that Bitcoin has yet to replicate. For a market that viewed $ETH as the weaker asset throughout 2026, this signals a substantial shift.
The sustainability of this trend will hinge on the developments in the upcoming hours.
Key Ethereum Price Levels to Watch Moving Forward
Potential Upside:
- $2,546 to $2,550, the high of today and the 50-week moving average, crucial before any further progress.
- $2,600, the next horizontal resistance on the chart, marking the peak of the recent range.
- Beyond that, analysts have identified $2,800 as the target if the prevailing pattern breaks upward.
Potential Downside:
- $2,500, the psychological barrier $ETH is currently upholding.
- $2,438, this level will determine if the breakout from August remains intact.
- $2,400, the horizontal support that has absorbed every dip since late August.
- $2,288.5, the 200 EMA, marking where the recovery structure may genuinely falter.
What Could Shift the Current Stalemate Today?
The August jobs report, scheduled for release at 12:30 GMT, is anticipated to show an increase of 58,000 jobs after a surprising drop of 23,000 in July, with the unemployment rate expected to stay at 4.1%.
This report should be interpreted carefully, as conventional logic seems to be reversed at present. In 2024 and 2025, weak payroll figures would trigger rate cuts and market rallies. Yet, in September 2026, a robust report would suggest a hawkish outcome, while a softer one would reduce hike risks.
In essence, weak labor market news could be beneficial for Ethereum. A soft report would back Waller’s argument for maintaining rates, keeping the dollar under pressure, and providing $ETH with the necessary liquidity to finally break through $2,550. Conversely, a strong report would reignite hike considerations, potentially driving the market in the opposite direction.
Earlier this week, the ADP report showed private payrolls grew by just 38,000 in August, under the 47,000 estimate by economists, marking the lowest growth in seven months. Although ADP is known for its unreliability, it leans towards a softer perspective.
Looking ahead, the Glamsterdam upgrade has been postponed to Q4 2026, with the Sepolia testnet fork proposed for the latter part of September. This could serve as a catalyst later this month, but not for today.