

Key Takeaways:
-
Bitcoin’s potential ascent could target $115,000 and subsequently $120,000, but sustained selling pressure from major holders might curtail upward momentum in the short term.
-
Certain alternative cryptocurrencies are demonstrating strength and appear poised to overcome key resistance barriers.
The cryptocurrency Bitcoin (BTC) began the week showing promise, as buyers attempted to hold prices above the $112,500 mark. However, sellers are expected to present a strong challenge.
Market observers will be closely monitoring the activities of large Bitcoin holders in the coming days. Data from CryptoQuant indicates that substantial holders, often called “whales,” have liquidated 114,920 BTC over the last month. This marks the most significant sell-off by this group since July of 2022. Some analysts are suggesting that continued sales from whales could restrict Bitcoin’s upward trajectory in the near future.
On the downside, the $100,000 price level remains a key point of interest for traders. A well-known trader named ZYN noted on social platform X that Bitcoin reached its lowest point at the 0.382 Fibonacci retracement level during the third quarter of 2024 and second quarter of 2025, and a similar pattern could potentially occur again. ZYN anticipates a worst-case scenario involving a 10% decline to around $100,000, followed by a robust 50% surge exceeding $150,000.
Another factor potentially impacting Bitcoin’s near-term performance is a reported decrease in purchasing activity from companies holding Bitcoin as a treasury asset. MicroStrategy, led by Michael Saylor and recognized as the largest Bitcoin holder, reportedly acquired approximately 7,714 BTC in August. This is notably less than the 31,466 BTC purchased in July.
Collectively, other treasury companies purchased 14,800 BTC during August. This figure is substantially lower than their peak acquisition of 66,000 BTC in June.
The question now is whether Bitcoin can successfully overcome its resistance levels. Also, will select alternative cryptocurrencies be able to initiate a new upward movement? To explore these potential scenarios, we will analyze the price charts of the top 10 cryptocurrencies.
S&P 500 Index Price Analysis
The S&P 500 Index (SPX) reached a new intraday peak on Friday, however, that higher price point incentivized profit-taking actions.
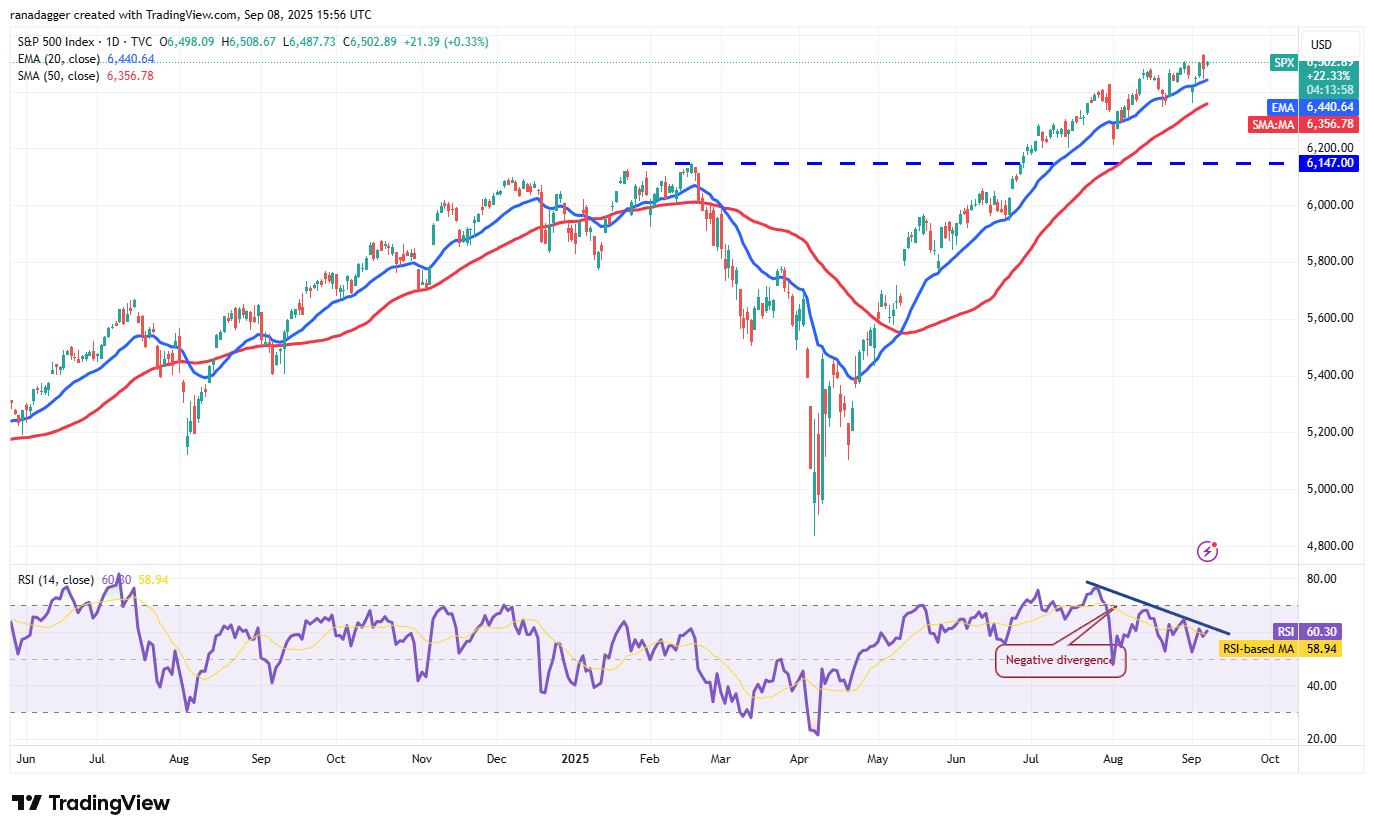
A bearish divergence observed on the relative strength index (RSI) indicates the upward momentum might be waning. If sellers manage to push prices below the 50-day simple moving average (6,356), a more significant correction toward the breakout level of 6,147 may commence.
Conversely, if prices rebound from the moving averages, it would suggest that optimistic market sentiment is persisting. In this case, buyers might attempt to trigger another leg of the rally, targeting 6,700.
US Dollar Index Price Analysis
Buyers struggled to maintain the US Dollar Index (DXY) above the moving averages, suggesting selling activity during rallies.
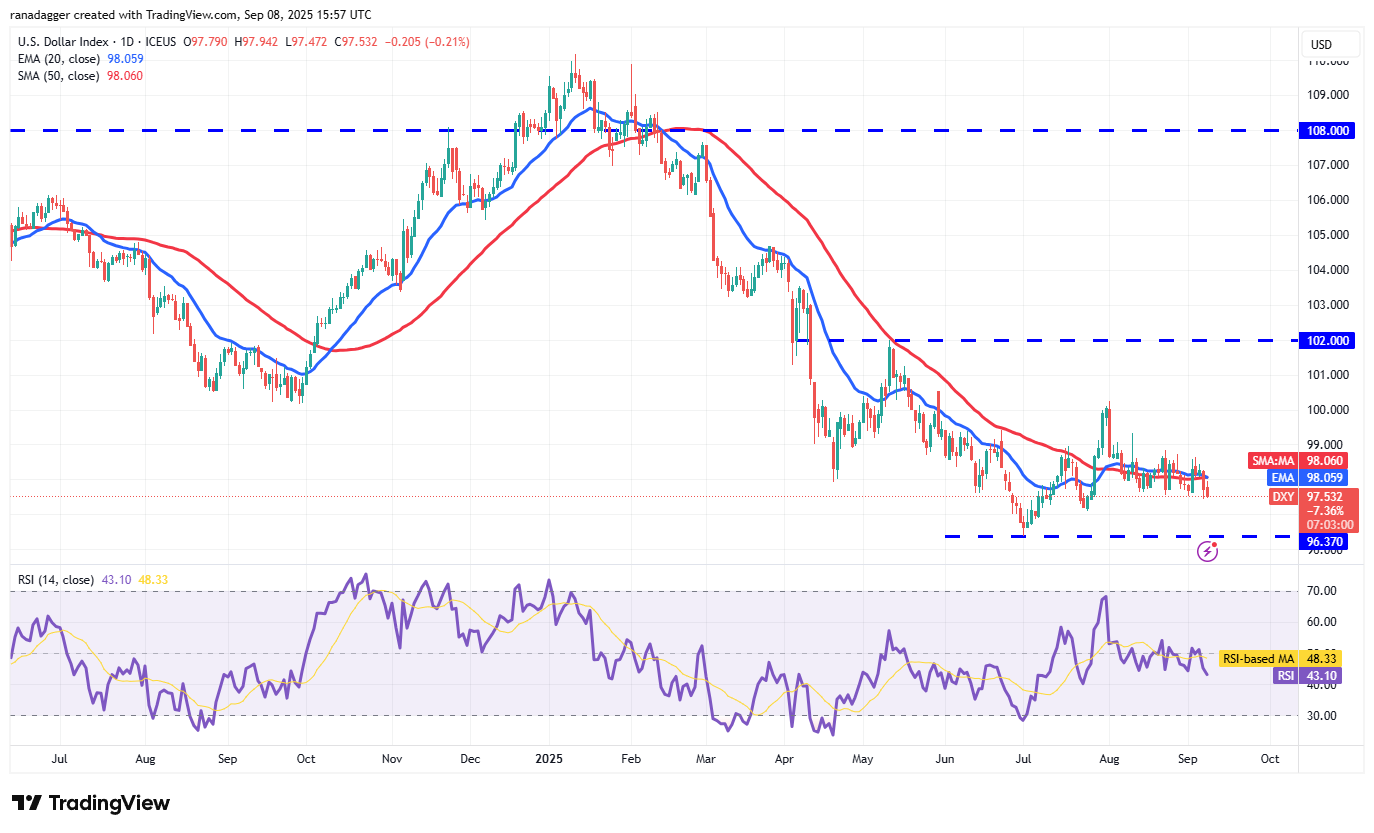
Sellers may attempt to reinforce their position by driving the price down to 97.10, followed by the critical support at 96.37. Buyers are anticipated to aggressively defend the 96.37 level, as a drop below this point could potentially send the index plummeting toward 95.
To prevent further declines, buyers will need to elevate the price above 99. If successful, the index might rally to 100.50 and potentially to the stiff resistance at 102.
Bitcoin Price Analysis
Bitcoin moved above the 20-day exponential moving average ($111,902) on Monday, indicating that bullish traders are staging a comeback.
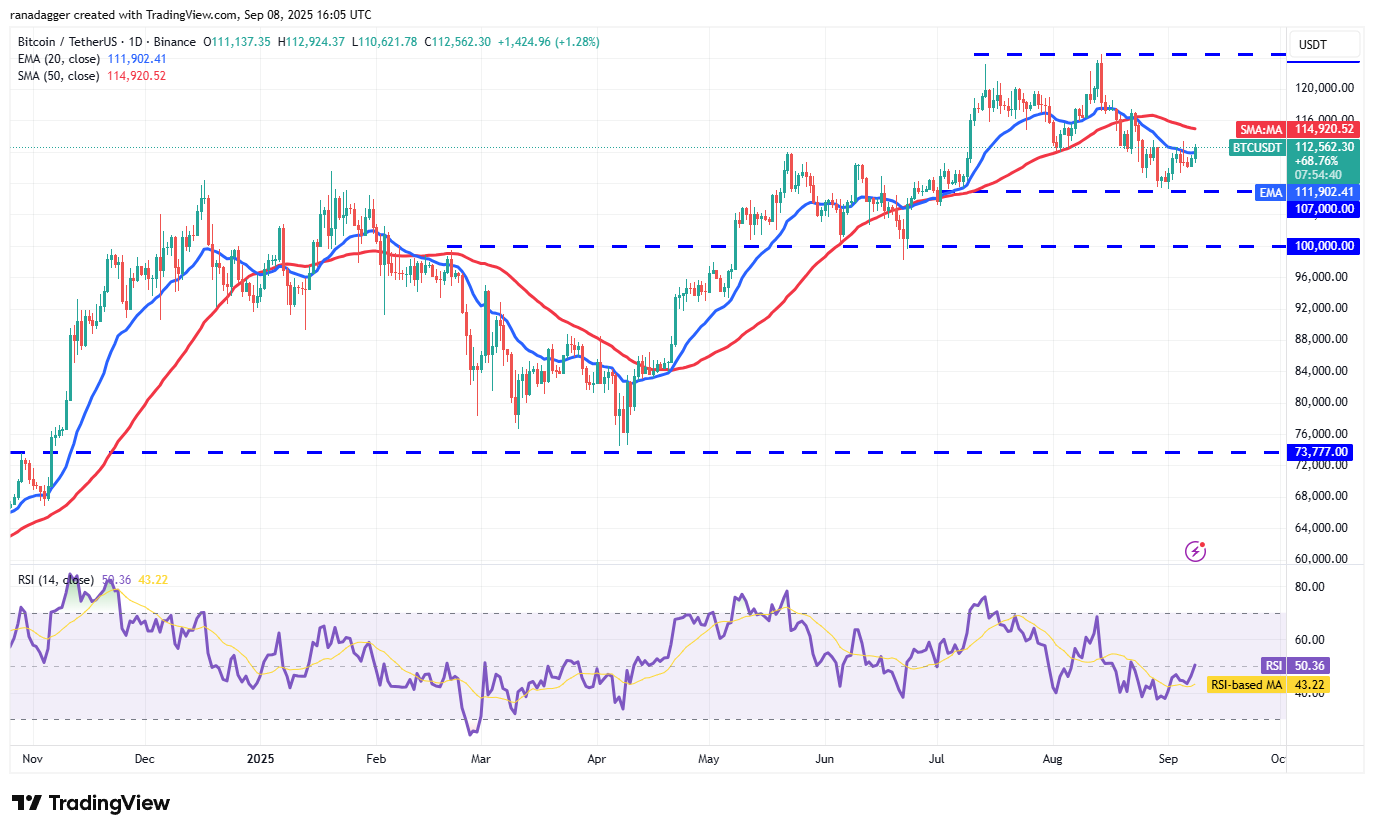
The BTC/USDT pair may potentially rally towards the 50-day SMA ($114,920), where sellers are expected to offer resistance. However, should buyers propel Bitcoin’s price beyond the 50-day SMA, the pair might enter a period of consolidation, fluctuating between $107,000 and $124,474.
Alternatively, a sharp price reversal from either the current level or the 50-day SMA would signal that sellers are regaining control. This scenario increases the likelihood of a break below the $107,000 support, potentially leading to a fall towards $100,000.
Ether Price Analysis
Ether (ETH) has recently been trading around the 20-day EMA ($4,351), reflecting uncertainty among buyers and sellers.
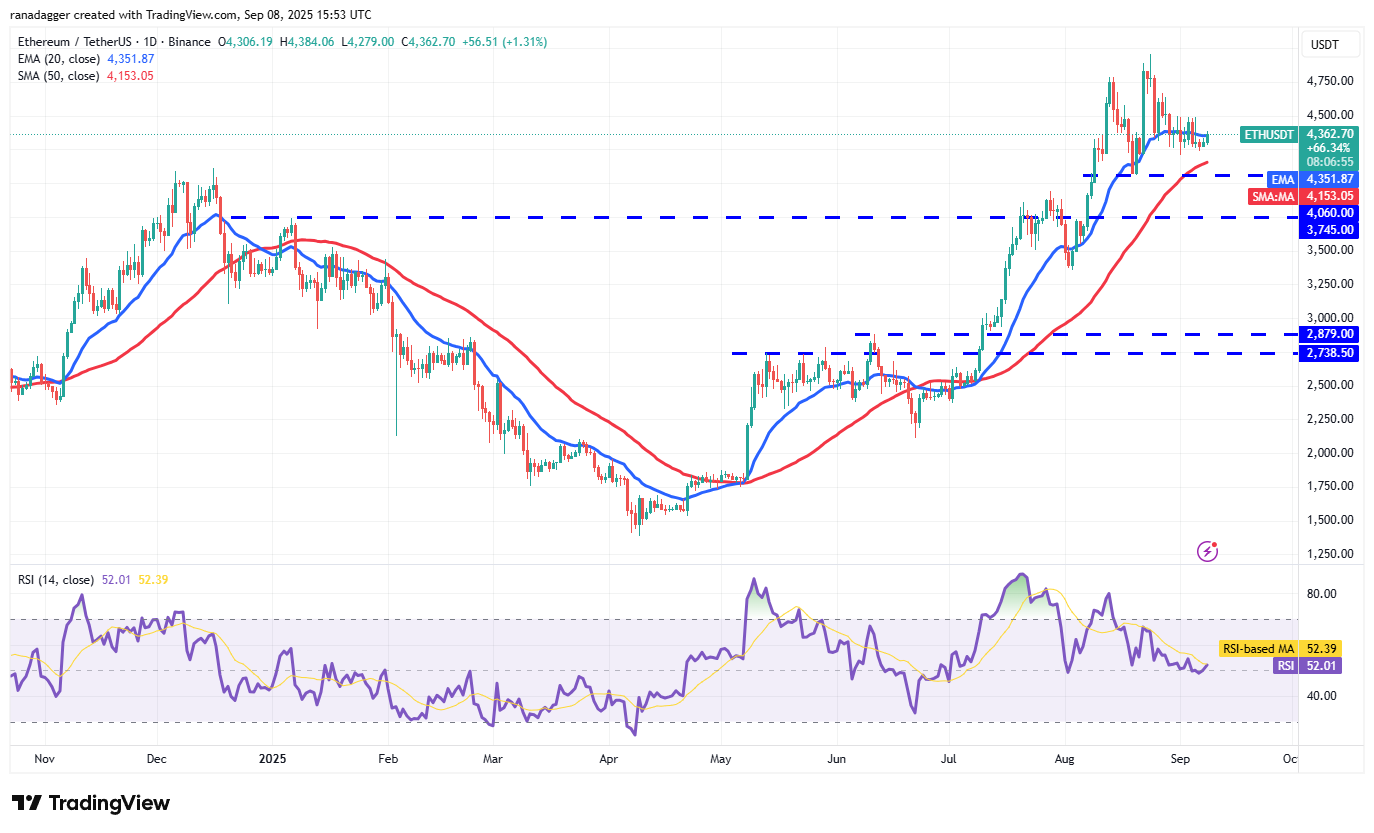
The $4,060 level serves as a critical support. A break and close below $4,060 could spur profit-taking among short-term bullish traders, potentially driving the ETH/USDT pair down to $3,745 and then to $3,350.
Conversely, a break and close above $4,500 would suggest a resurgence of buying pressure. Ether’s price might then retest the $4,956 resistance. A sustained move above $4,956 could pave the way for a rally toward $5,500.
XRP Price Analysis
XRP (XRP) surpassed the 20-day EMA ($2.90) on Monday and is now approaching the downtrend line.
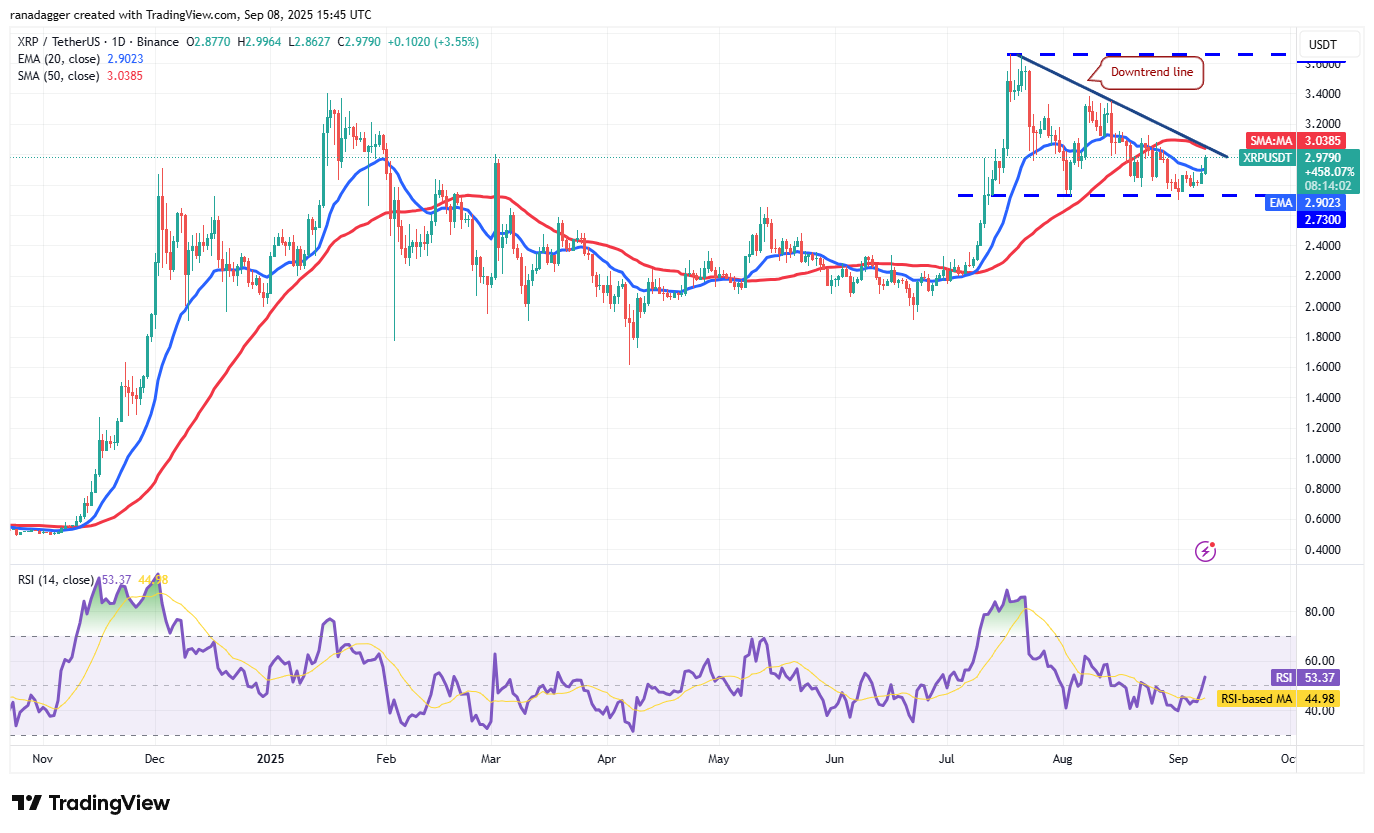
Sellers are anticipated to aggressively defend the downtrend line, since exceeding that level would invalidate the bearish descending triangle pattern. Should this occur, aggressive sellers could be caught out, pushing XRP prices towards $3.40.
Alternatively, if the price sharply reverses from the downtrend line, it would suggest the XRP/USDT pair may remain within the triangle for longer. Selling pressure could intensify should the $2.73 support level be breached.
BNB Price Analysis
BNB (BNB) rebounded from the $840 support on Friday and subsequently surpassed the $861 resistance on Sunday.
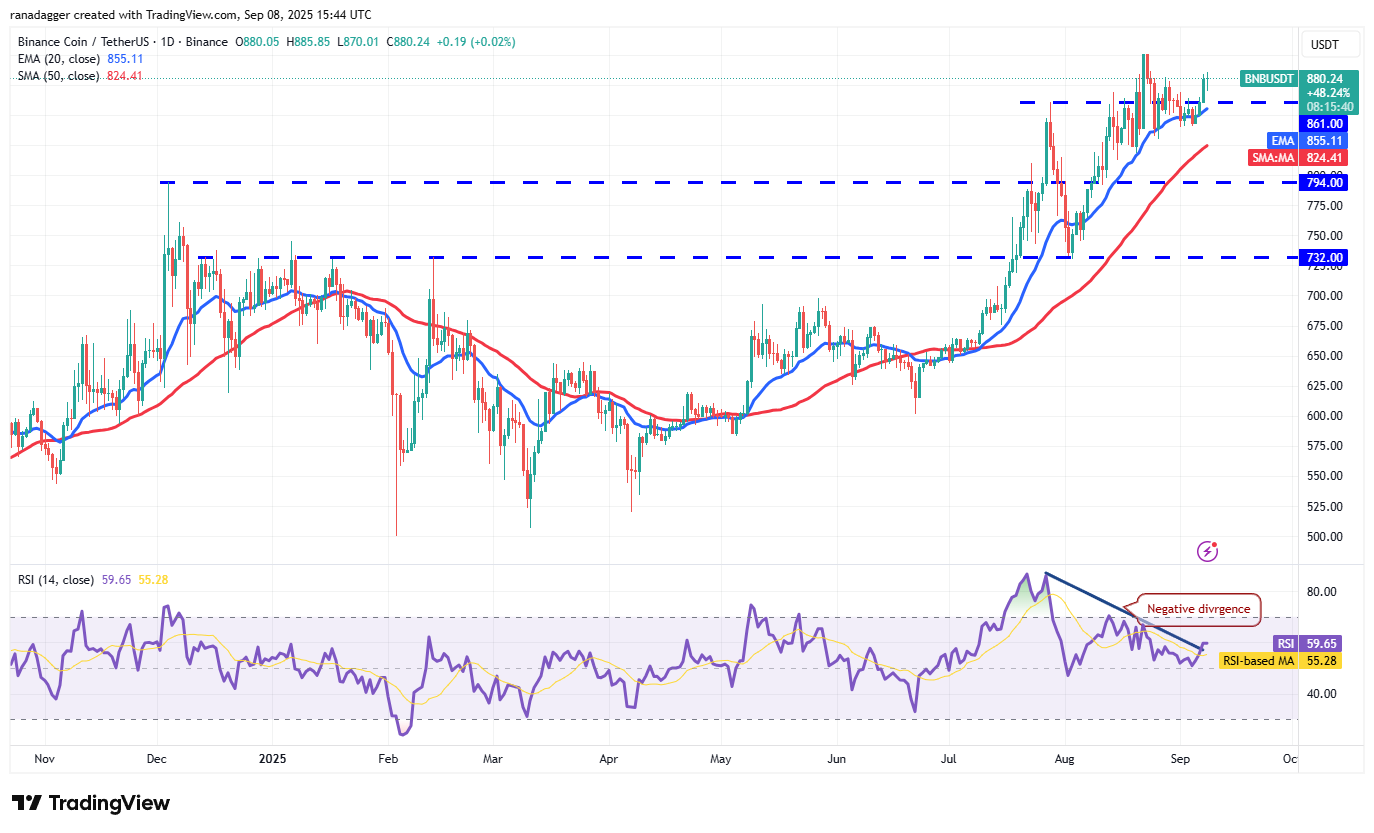
The upward price movement may extend towards $900, where sellers are anticipated to put up significant resistance. If the price declines from $900 but finds support at the 20-day EMA ($855), it would signal positive sentiment and increase the likelihood of breaking above $900. The BNB/USDT pair could then potentially rise to $1,000.
In contrast, a price reversal from the current level or the overhead resistance, combined with a break below $840, would indicate that bullish traders are exiting their positions. This scenario could cause BNB’s price to fall towards the 50-day SMA ($824) and subsequently to $794.
Solana Price Analysis
Solana (SOL) bounced off the 20-day EMA ($201) on Sunday, indicating continued buying activity on dips.
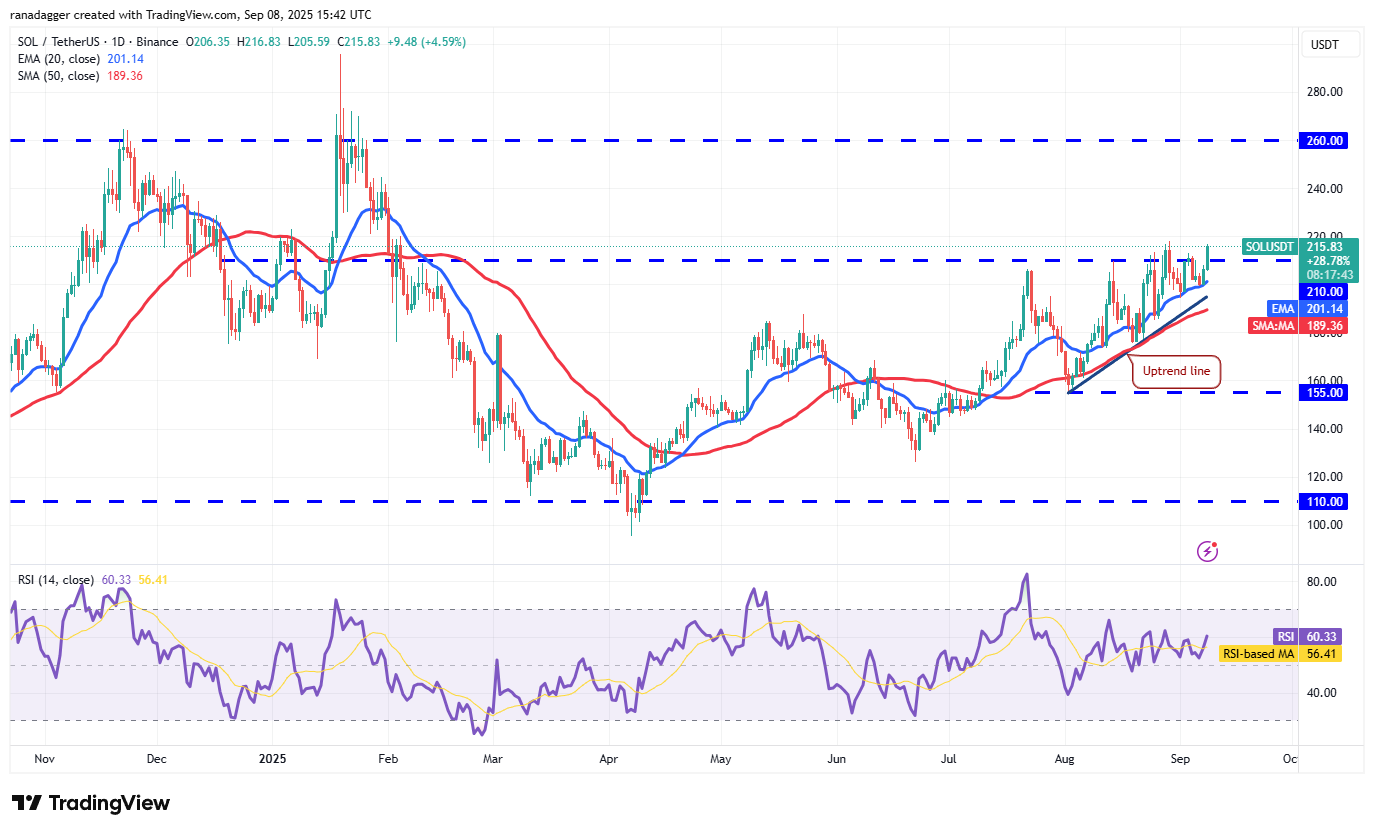
Buyers are attempting to push the price above the $218 resistance. If they succeed, the SOL/USDT pair will complete a bullish ascending triangle pattern, opening the door for a rally towards $240 and then $260.
To prevent the upward move, sellers would need to defend $218 and quickly drive Solana’s price below the 50-day SMA ($189). The pair could then fall towards $175.
Related: Can XRP continue to outperform Bitcoin in this bull market?
Dogecoin Price Analysis
Dogecoin (DOGE) moved above the moving averages on Sunday, suggesting that the price could remain within the $0.21 to $0.26 range for longer.
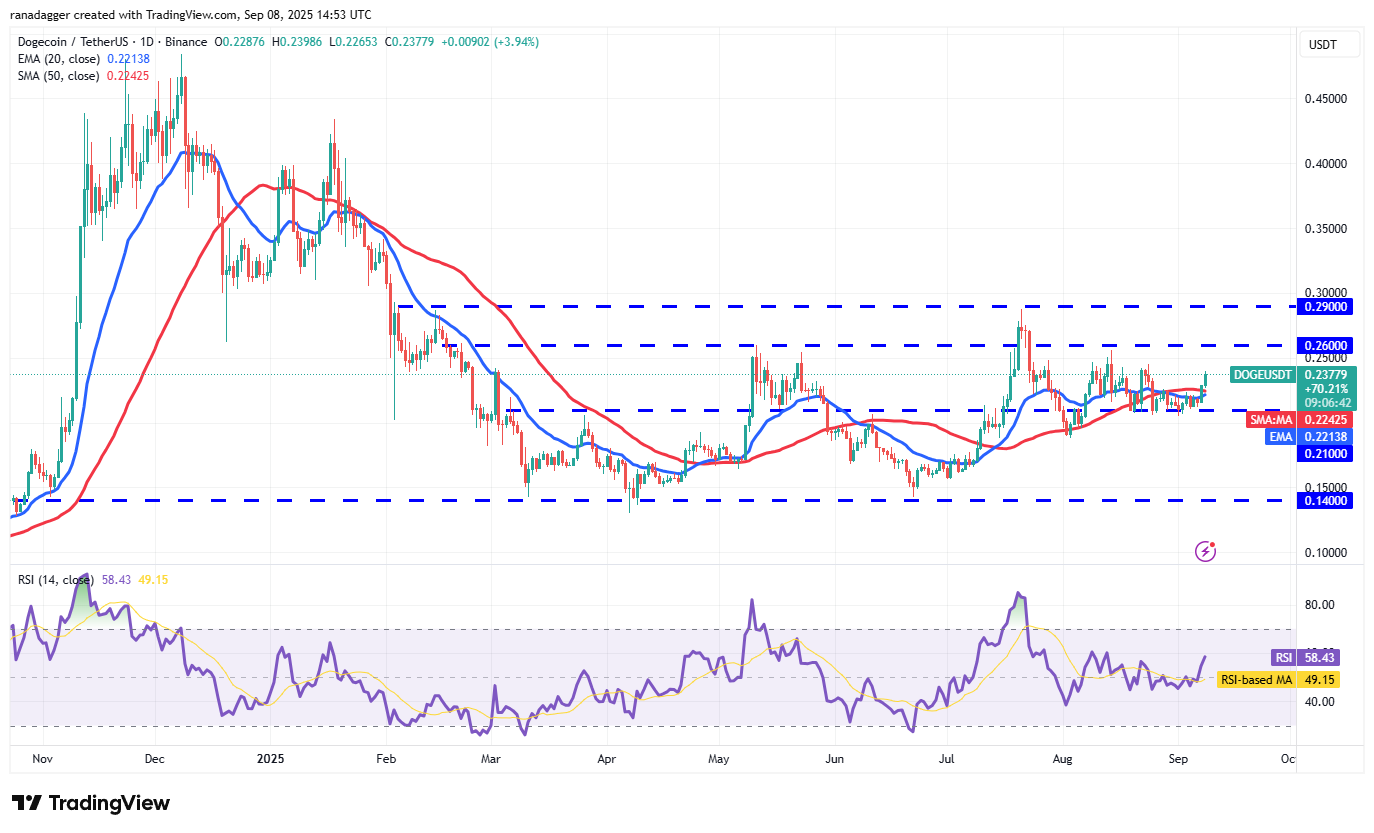
The 20-day EMA ($0.22) has started to trend upward, and the RSI has entered positive territory, indicating a slight advantage for buyers. Sellers will likely try to defend the $0.26 resistance, but if buyers prevail, the DOGE/USDT pair may target $0.29. A sustained move above $0.29 could signal the start of a new rally towards $0.44.
The $0.21 level is an important support to watch on the downside. Breaching that support could cause Dogecoin’s price to drop to $0.19 and then to $0.16.
Cardano Price Analysis
Cardano (ADA) moved above the moving averages on Monday and is approaching the downtrend line of a descending channel pattern.
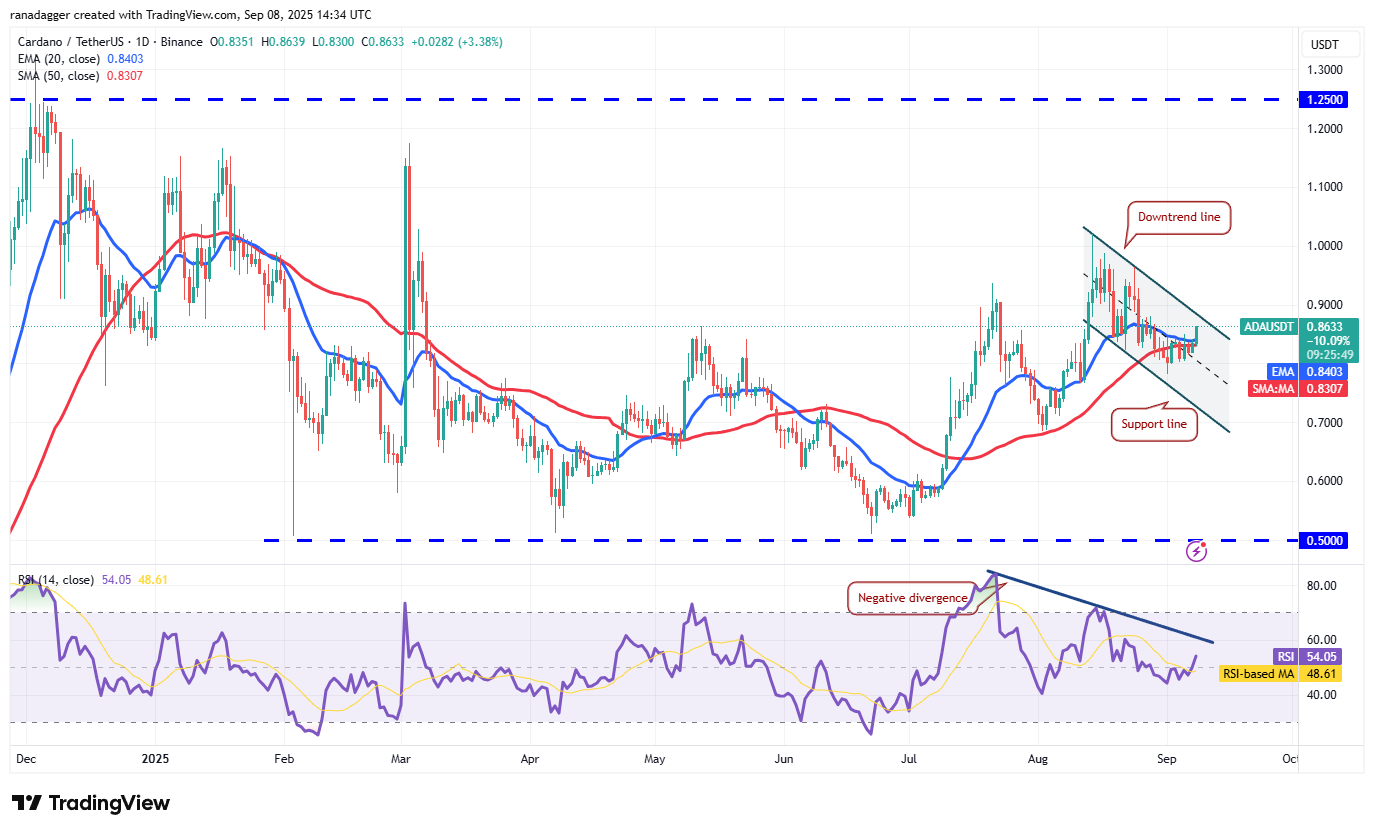
Sellers will likely defend the downtrend line, however, should buyers break through this resistance, it could signify the end of the correction phase. The ADA/USDT pair may then gain momentum and rise towards $0.96 and then $1.02.
Alternatively, if Cardano’s price reverses from the downtrend line, it suggests that the pair may remain within the channel for a longer period. Sellers would gain an upper hand if the channel’s support line is broken.
Hyperliquid Price Analysis
Hyperliquid (HYPE) continues its upward climb, moving above the $49.88 to $51.19 resistance zone on Monday.
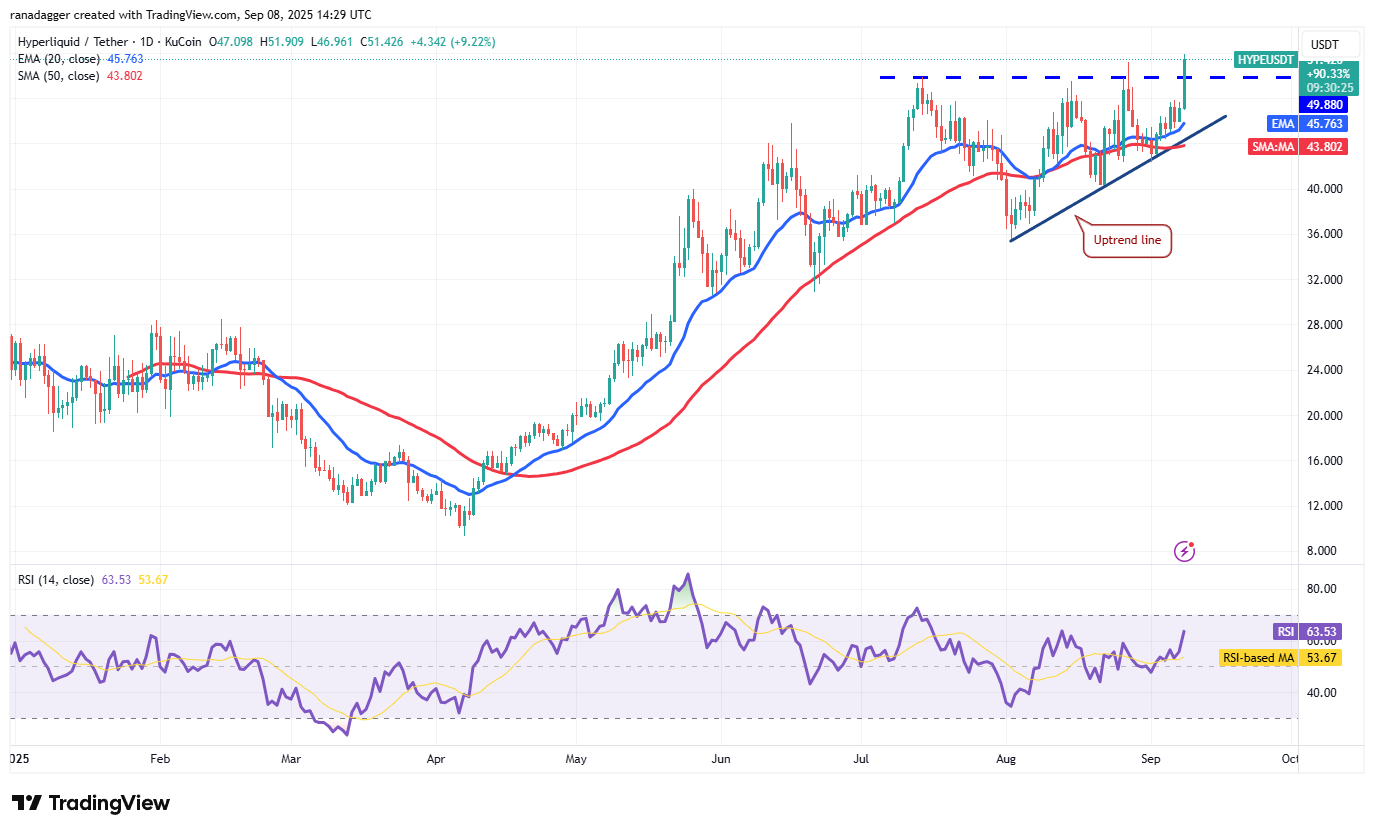
Closing above $51.19 would signal the completion of a bullish ascending triangle pattern. The HYPE/USDT pair may then resume its uptrend towards the pattern target of $64.25.
In contrast to this assumption, a sharp reversal of Hyperliquid’s price, causing it to re-enter the triangle, suggests that sellers are active at higher levels. Sellers would need to push the price below the uptrend line to invalidate the bullish setup. This could trap aggressive bullish traders, potentially driving the pair down to $40.
This analysis is for informational purposes only and is not financial advice. Cryptocurrency investments involve risk, and individual research is strongly encouraged before making any decisions.