
Overview
- Solana’s value is trapped between a support level at $99 and a declining resistance point around $102, leading to a narrowing range.
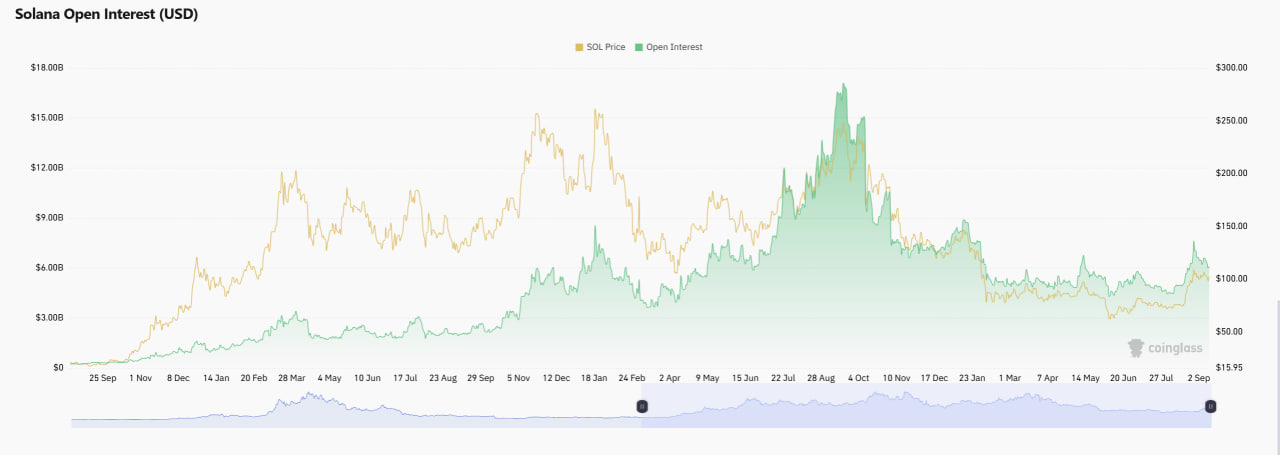
- Open interest has rebounded to $6.10 billion, indicating leveraged positions are forming ahead of a potential breakout.
- The platform has seen over 260,000 new token launches daily for three consecutive days.
- For the first time in months, the 20, 50, and 200-day moving averages have aligned bullishly.
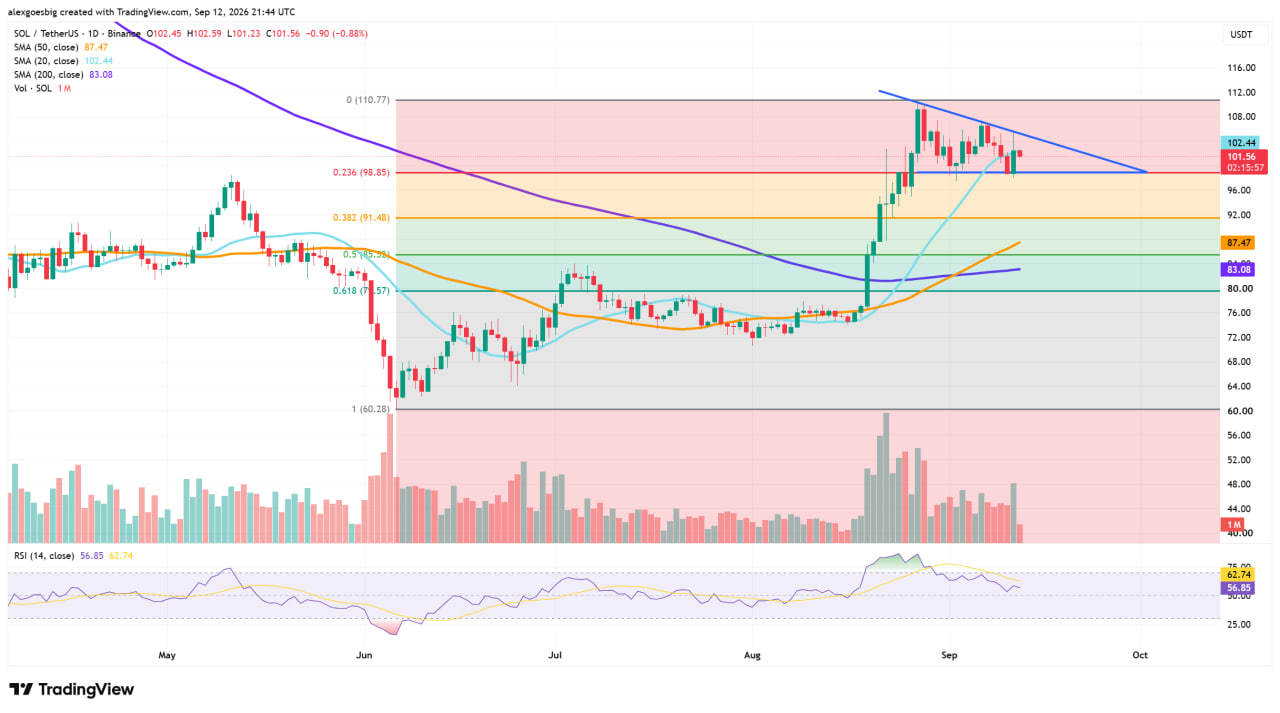
The recovery resembles a complete round trip. $SOL fell from approximately $110.77 to $60.28 in early June, then moved sideways between $72 and $80 during July and most of August. A strong uptick in late August pushed the price back above $98 and briefly reached $112 in early September.
Currently, the coin is stabilizing around $98.85, which coincides with the 0.236 Fibonacci retracement level. This support seems solid as buyers have consistently stepped in at this level over the past two weeks, suggesting it’s a defended support rather than a mere coincidence. The latest session on the Binance daily chart ended at $101.51, remaining just below recent peaks. Capital investment remains steady, with the total value locked in Solana’s DeFi ecosystem holding at $5.903 billion, a 2.64% increase in the last day.
The triangle formation is nearing its apex
The most significant aspect of the chart is its compression. A descending trendline extends from the early September peak of around $112 and intersects lower highs in the meantime, while flat support stays around the $99 mark. These two lines are converging, signaling that the apex is approaching.
Descending triangles often carry bearish implications, but in this case, the pattern formed post a significant upward move and is situated above rising moving averages, indicating more of a pause than a peak. The crucial moment will arrive when either boundary breaks with a daily close. Volume has tapered as the range compresses, a typical sign preceding a breakout.
The 200-day moving average begins to curve upward
The trend structure has shifted. The 20-day moving average stands at $102.44, the 50-day at $87.47, and the 200-day at $83.08, indicating a clear setup with faster averages positioned above slower ones. Of these, the 200-day moving average is the most significant. It had been declining through the spring and summer but has now flattened and began to rise, reflecting a potential genuine trend reversal rather than a temporary bounce. Currently, the price is trading just below the 20-day average, making $102.44 the key level bulls need to reclaim on a closing basis.
260,000 token launches per day signal sustained activity
Solana’s fee structure positions it as the go-to platform for new token creations, and the achievement of over 260,000 launches daily for three straight days indicates a sustained wave of speculative activity rather than an isolated spike. Each launch incurs transactions and fees, generating revenue for validators and maintaining network activity, regardless of where $SOL trades. This elevated level of token creation serves as a demand indicator for blockspace, though it can also be a volatile element in the ecosystem, with a sharp decline in launch counts potentially undermining current engagement levels.
A second, more stable source of transaction activity aligns with this speculative frenzy. Data from Allium highlighted by Solana reveals that 63% of tokenized equity trading on the network occurs while U.S. exchanges are closed, with weekends contributing to 17% of the annual trading volume. These tokenized stocks transact before the 9:30 a.m. opening, after the 4 p.m. closing, and during weekends, reflecting a robust use case that isn’t reliant on meme coin volatility.
Leverage indicated by $6.10 billion in open interest
Derivatives positioning has strengthened, showing open interest at $6.10 billion as of September 12, with $SOL priced at $102.42 at that time, a rise from the compressed figures observed during the spring. Open interest represents the total value of active derivatives contracts, and a concurrent rise with price typically indicates fresh positions being taken rather than short positions being liquidated. This distinction is crucial for the forthcoming price movement, as leverage in a tightening range can amplify the impact of the price direction that follows.
Key support levels between $85 and $91
The Fibonacci grid, drawn from the entire range of $110.77 to $60.28, outlines distinct support zones beneath the current price level.
Particularly, the $85 to $91 range is essential to monitor in case of any significant price drop. This area includes the 0.382 and 0.5 retracement levels alongside the 50-day average, positioned just above the 200-day moving average at $83.08. A decline into this support band could induce stress but may not necessarily derail the broader recovery.
The 14-period RSI stands at 56.73, indicating it is above the midpoint that divides buying from selling pressure but currently below its signal line at 62.73. This crossover suggests a moderation in momentum following the September increase, rather than indicating a reversal. With no signs of being overbought, there remains potential for further upward movement if buying interest returns.
Critical closes to determine the next move
A bullish scenario necessitates a daily close above the descending resistance line, roughly between $102 and $103, where it coincides with the 20-day moving average. Clearing this point would pave the way toward the $110.77 Fibonacci starting point and potentially revisit the $112 peak from September. Conversely, a bearish case occurs with a daily close below $98.85. If that support level fails, the first target would shift to $91.48, followed by a substantial zone between $85 and $87 where the 50-day average awaits, with $79.57 as a threshold further below.
The variable that could precipitate an early decision is funding dynamics. With open interest hovering around $6.10 billion and the price confined in a narrowing range, a significant move in either direction risks triggering liquidations that might overshoot key technical levels. Traders relying on tight stops near $99 or $102 might find that the initial breakout could quickly reverse.
The magnitude of the next volume surge, rather than the initial price direction, will reveal whether the forthcoming move has strong conviction.