

Compared to the year before, most areas saw a faster pace of growth during this period.
Authored by: Chainalysis
Adapted by: Chopper, Foresight News
We’re excited to present the 2025 Chainalysis Global Cryptocurrency Adoption Index. This yearly report uses on-chain and off-chain information to identify the countries leading the charge in everyday cryptocurrency adoption. Our findings pinpoint nations where unique crypto applications are emerging and delve into the reasons individuals globally are adopting digital currencies.
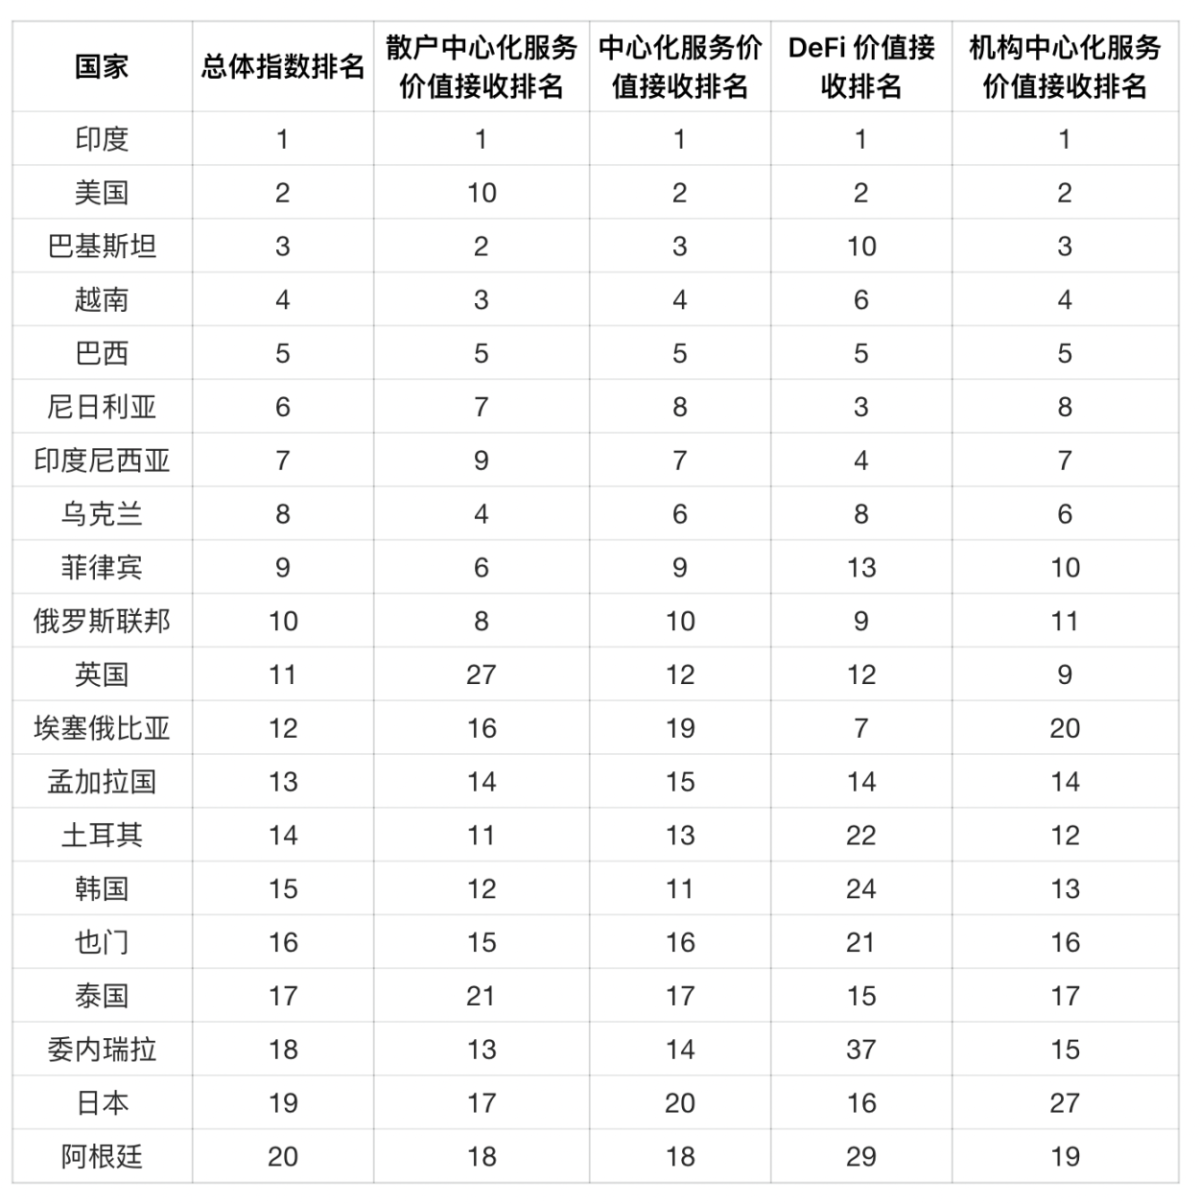
Top 20 Nations in the 2025 Global Cryptocurrency Adoption Index
In 2025, the Asia-Pacific region solidified its dominance in grassroots cryptocurrency activity. India, Pakistan, and Vietnam stood out, driven by widespread use of both centralized and decentralized crypto services. Simultaneously, North America rose to second place regionally, fueled by regulatory advancements like spot Bitcoin ETF approvals and clearer institutional guidelines. This boosted mainstream acceptance of cryptocurrency within conventional finance and expedited its overall progress.
Asia-Pacific: The Region with the Most Rapid Growth
During the twelve months ending in June 2025, the Asia-Pacific region demonstrated the most pronounced expansion in on-chain cryptocurrency activity. The value received saw a year-over-year increase of 69%. Overall crypto trading volume in the Asia-Pacific region climbed from $1.4 trillion to $2.36 trillion, driven by significant involvement from key markets like India, Vietnam, and Pakistan.
Close behind was Latin America, with a 63% increase in cryptocurrency adoption, reflecting heightened rates among both individual and institutional investors. In contrast, Sub-Saharan Africa’s adoption rate grew by 52%, indicating the region’s continued reliance on cryptocurrency for remittances and everyday transactions. These statistics reveal a significant shift in cryptocurrency momentum toward the Global South, where its adoption is increasingly driven by real-world applications.

In terms of sheer volume, North America and Europe remained dominant, receiving over $2.2 trillion and $2.6 trillion, respectively, in the past year. North America’s 49% growth reflects renewed institutional enthusiasm for cryptocurrencies, spurred by spot Bitcoin ETF launches and enhanced regulatory clarity. While lower than other regions, Europe’s 42% growth is still substantial, highlighting the continent’s ongoing institutional engagement and expanding user base. The Middle East and North Africa experienced more moderate growth at 33%, indicating slower adoption compared to other emerging markets, though total trading volume still exceeded $500 billion.
Almost every region showed increased growth compared to the prior year, with particularly notable gains in Asia-Pacific and Latin America. Asia-Pacific’s growth rate, only 27% last year, more than doubled to 69% recently. Similarly, Latin America’s year-on-year growth surged from 53% to 63%, cementing its position as a fast-growing crypto hub. Quick expansion was also seen in Europe, the Middle East and North Africa, and Sub-Saharan Africa, indicating broad global uptake. Interestingly, North America’s growth rate rose from 42% to 49%, suggesting that regulatory certainty and institutional capital inflows in 2025 are impacting trading data.
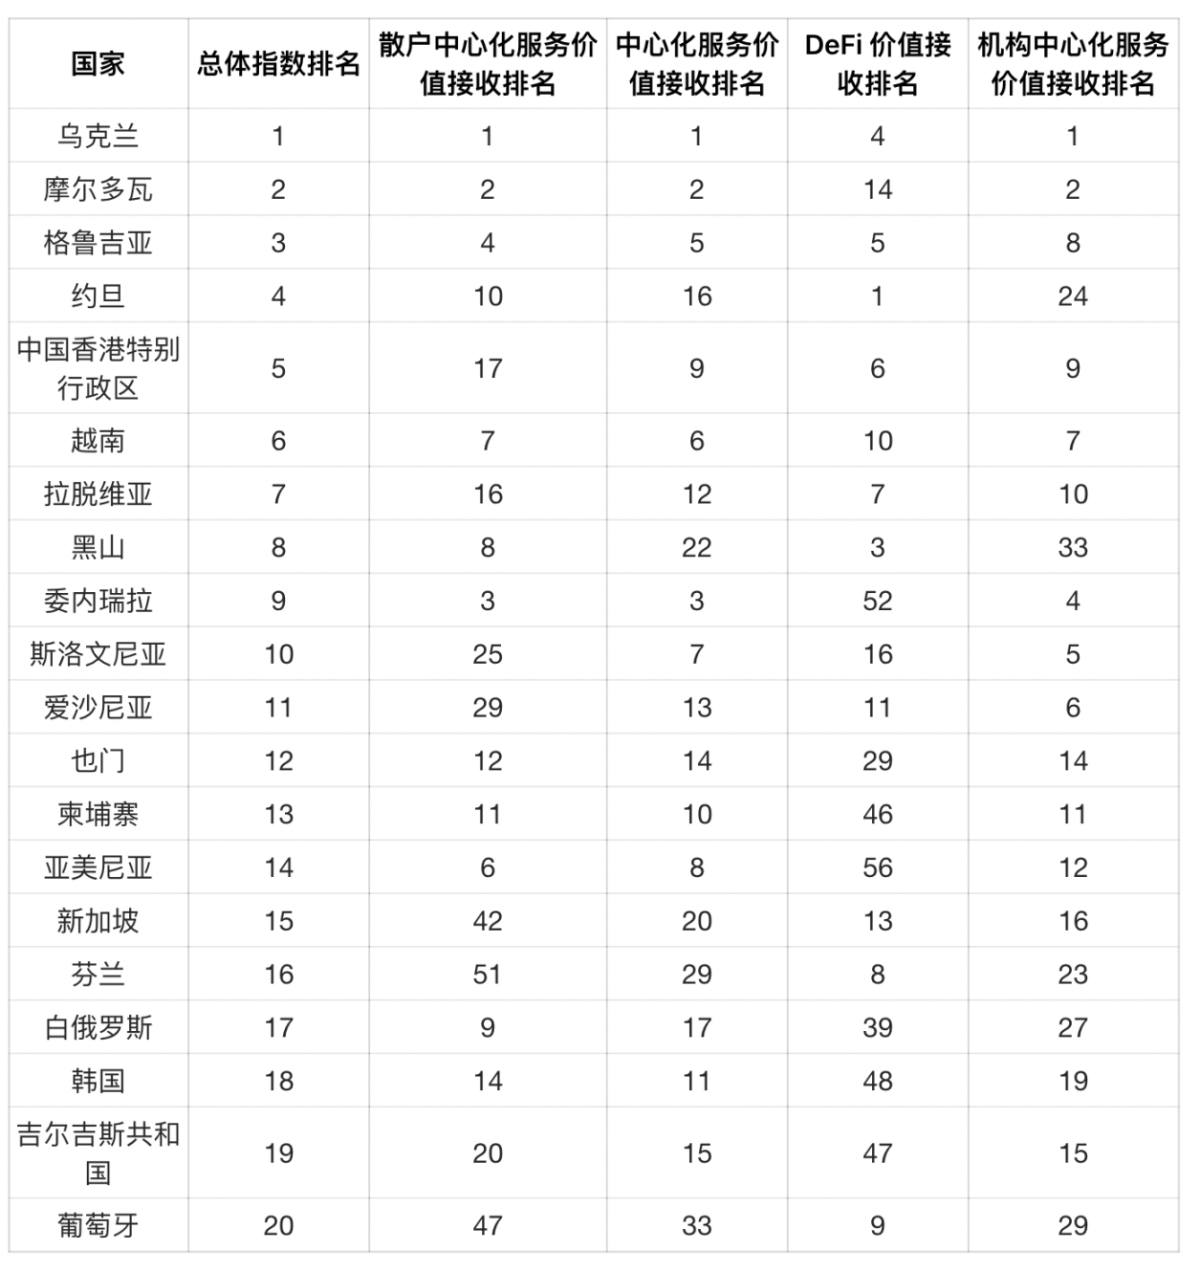
Population-Adjusted Rankings: Eastern Europe Takes the Lead
Our index traditionally emphasizes activity adjusted for per capita GDP, most effective when cryptocurrency is specialized and concentrated among high-volume participants. However, as adoption expands, population-adjusted metrics more clearly reveal where cryptocurrency gains genuine grassroots traction.
Adjusting our index for population revealed a distinct set of leading countries. Eastern European nations, including Ukraine, Moldova, and Georgia, ranked highest, reflecting substantial cryptocurrency activity relative to their population size. Economic instability, distrust of traditional banks, and strong tech skills in the region could be driving crypto adoption in Eastern Europe. These elements make crypto a desirable option for wealth preservation and international transactions, particularly in nations grappling with inflation, conflict, or banking limitations.
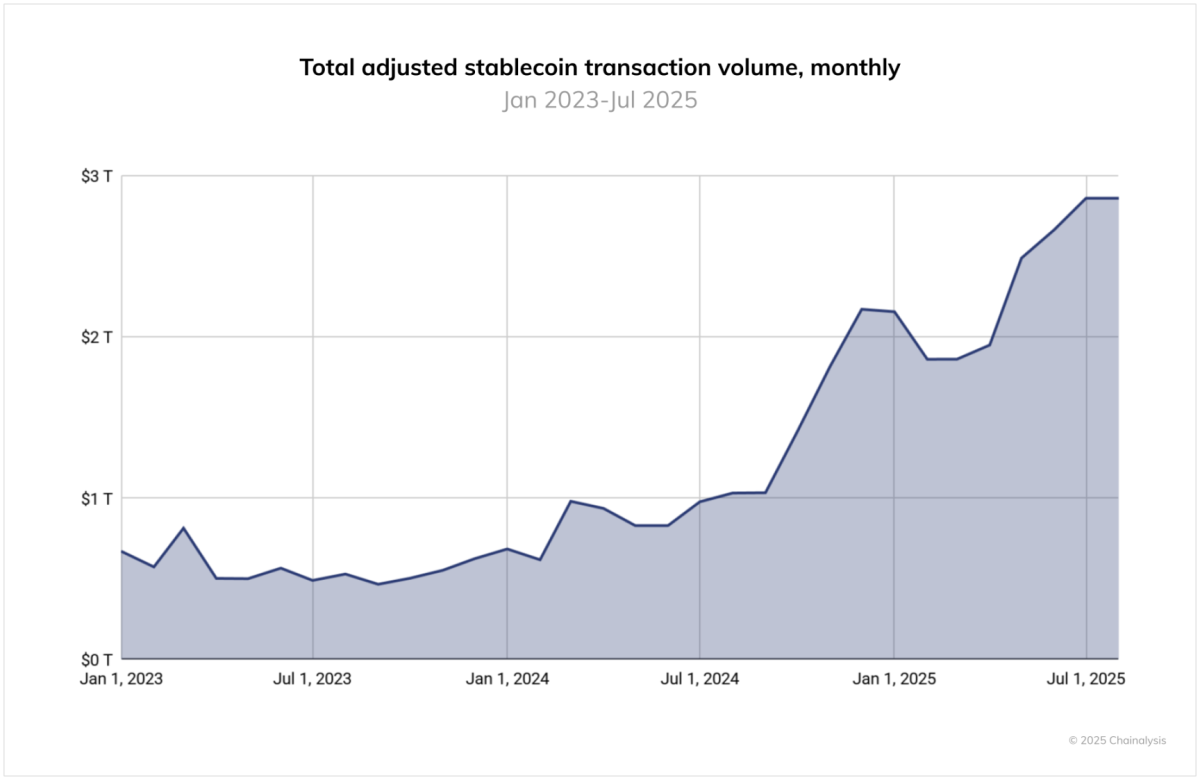
The Global Rise of Stablecoins
The regulatory environment for stablecoins saw significant shifts in the past year. Though the U.S. ‘Genius Act’ hasn’t taken effect, its passage has spurred strong institutional interest, while the EU’s ‘Markets in Crypto-Assets Regulation’ (MiCA) has facilitated the launch of licensed euro-pegged stablecoins like EURC.
However, on-chain data shows that USDT and USDC still dominate stablecoin trading volume, consistently surpassing other stablecoins in scale. Between June 2024 and June 2025, USDT processed over $1 trillion in transactions monthly, peaking at $1.14 trillion in January 2025. USDC’s monthly trading volume ranged from $1.24 trillion to $3.29 trillion, with particularly high activity in October 2024. These volumes underscore the ongoing crucial role of Tether and USDC in crypto market infrastructure, notably in cross-border payments and institutional activities.
Growth trends reveal different dynamics. While Tether and USDC have experienced volatility, smaller stablecoins like EURC, PYUSD, and DAI have grown rapidly. For instance, EURC achieved average month-on-month growth of nearly 89%, with monthly trading volume increasing from about $47 million in June 2024 to over $7.5 billion by June 2025. PYUSD also showed sustained accelerated growth, rising from roughly $783 million to $3.95 billion during the same period.
These changes coincide with increased institutional stablecoin activity. Companies like Stripe, MasterCard, and Visa have launched products allowing users to spend stablecoins through traditional channels, while platforms like MetaMask, Kraken, and Crypto.com have introduced stablecoin payment functionalities linked to bank cards. On the merchant side, collaborations among companies like Circle, Paxos, and Nuvei aim to simplify stablecoin settlements. Furthermore, traditional financial institutions such as Citi and Bank of America have announced plans to explore expanding their product lines, even hinting at potentially launching their own stablecoins.
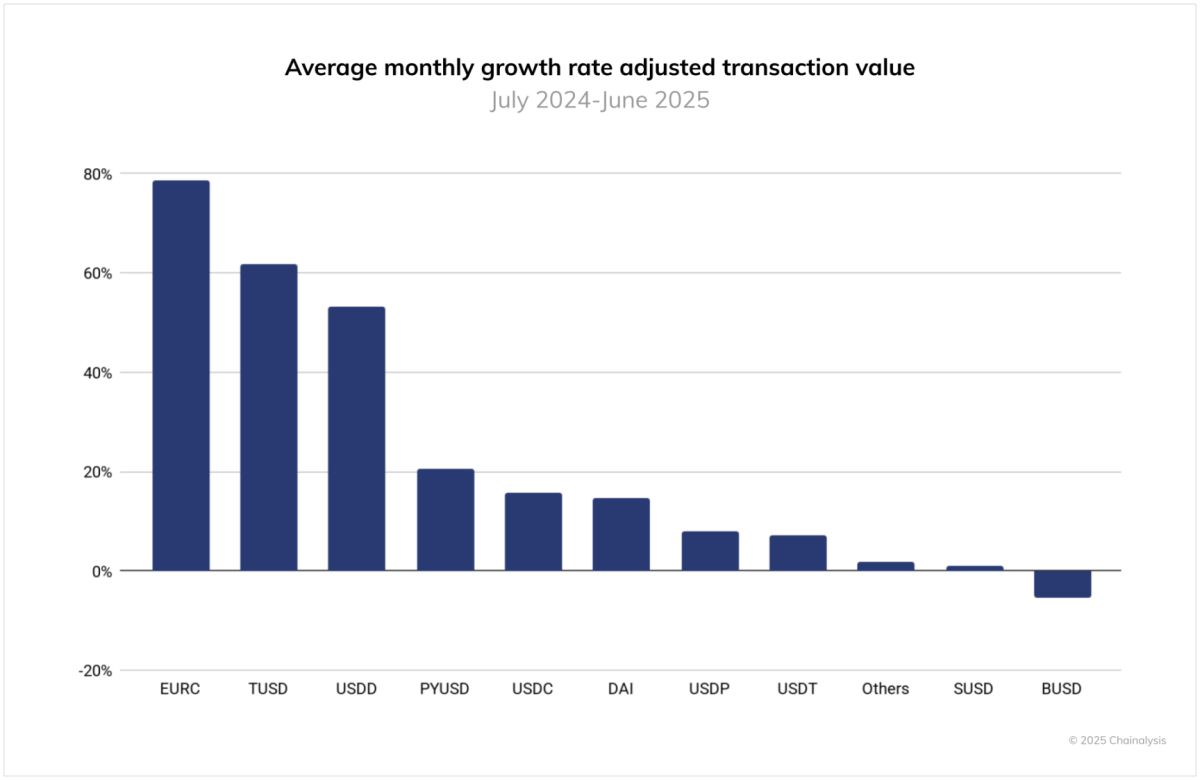
Regionally, these differences might indicate evolving stablecoin usage patterns. USDC growth appears closely linked to institutional channels and regulated U.S. corridors, while EURC’s rise suggests increasing interest in euro-denominated digital assets, potentially driven by MiCA-compliant platforms and European fintech adoption. PYUSD growth may point to broader demand for other highly regulated stablecoins in retail and payment settings. These developments suggest a diversifying and expanding stablecoin landscape, with local use cases increasingly impacting global transaction volumes.
Fiat Currency Entry: Bitcoin Remains the Top Choice
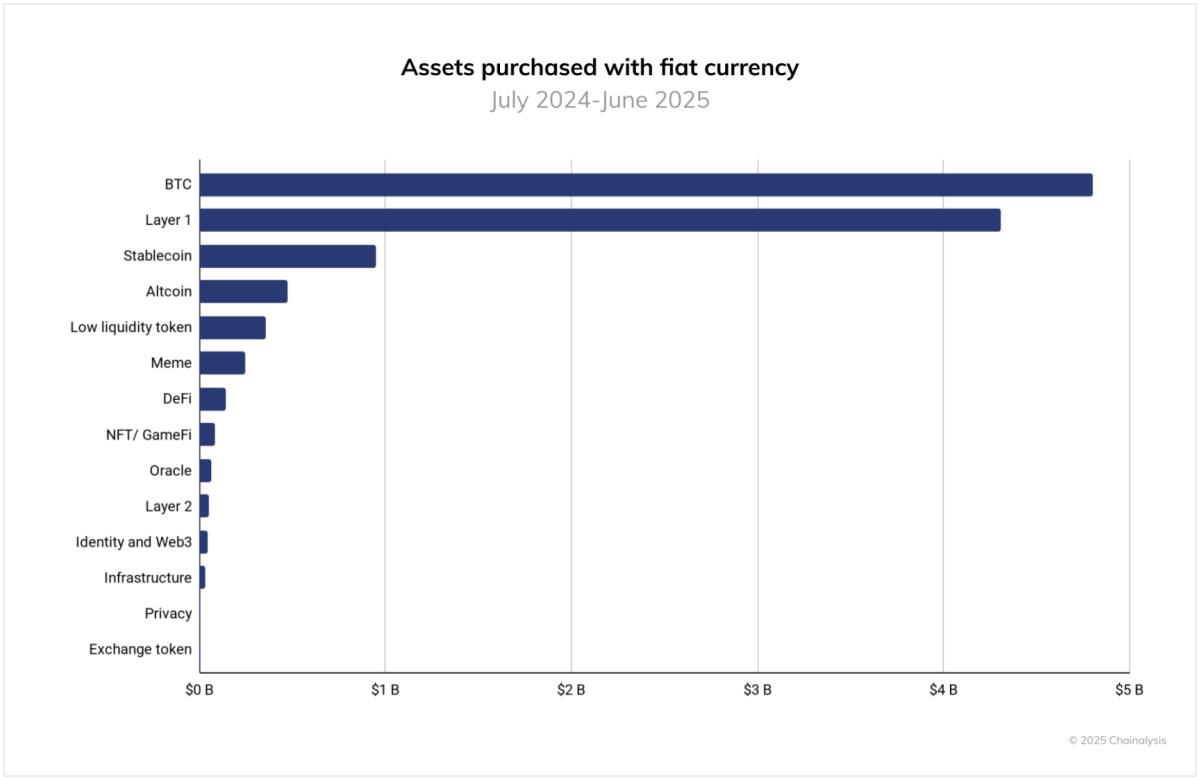
To gauge fiat currency entry behaviors, we reviewed purchases on centralized exchanges from July 2024 to June 2025, where users exchanged fiat currencies for cryptocurrencies. We categorized each transaction based on the primary asset purchased, allowing us to assess which token types are the primary gateways into cryptocurrency.
Bitcoin leads significantly, accounting for over $4.6 trillion in fiat inflows during this period. This is more than double the inflow of second-ranked Layer 1 tokens (excluding BTC and ETH), which totaled roughly $3.8 trillion. Stablecoins rank third with $1.3 trillion, followed by altcoins at about $540 billion. Other categories, including low liquidity tokens, meme coins, and DeFi, each saw fiat inflows below $300 billion.
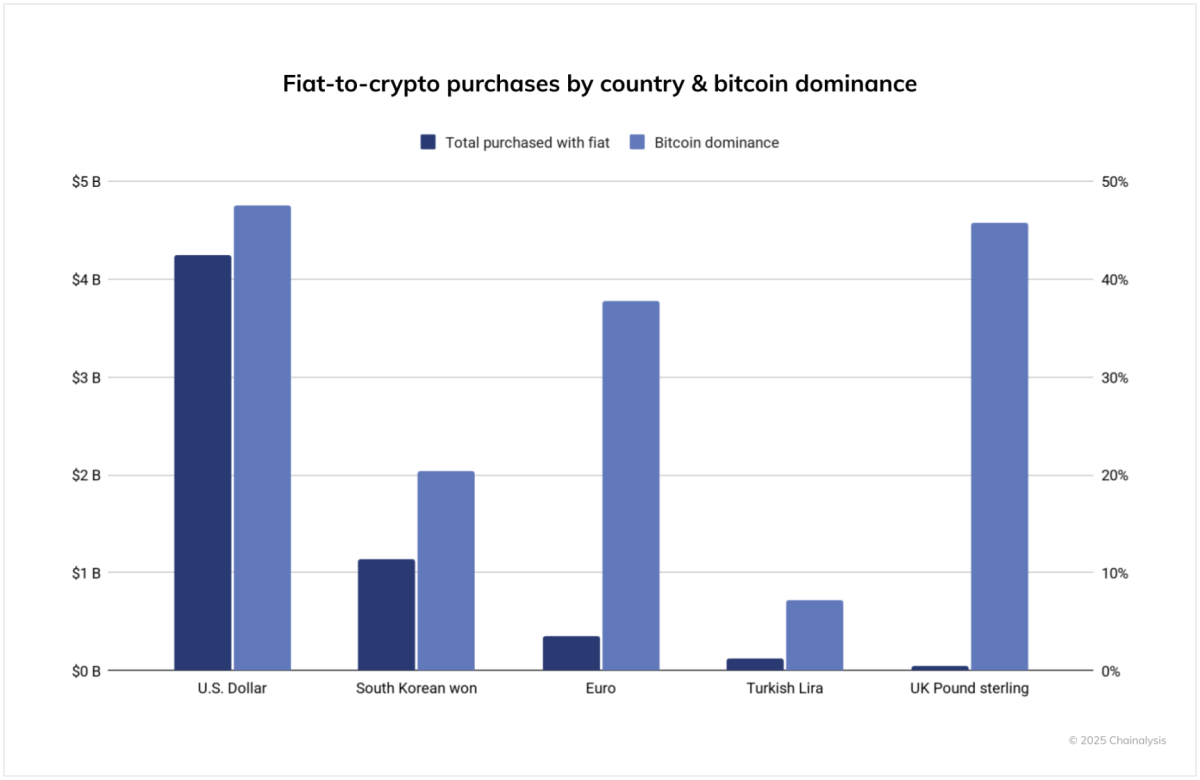
Geographically, the United States remains the largest fiat currency entry point globally, with total trading volume exceeding $4.2 trillion, more than four times that of the second-largest country. South Korea follows with over $1 trillion in trading volume, while the EU’s trading volume is slightly below $500 billion. Bitcoin’s dominance (i.e., the percentage of total fiat purchases allocated to BTC) is particularly high in the UK and the EU, at roughly 47% and 45%, respectively. In contrast, South Korea’s entry is more diversified, with a lower share of trading volume attributed to Bitcoin.
This analysis only includes fiat currency entry data from tracked centralized exchanges and doesn’t cover over-the-counter trading, informal markets like Hawala, or cash-based cryptocurrency stores.
Adoption Reaches Across All Income Levels
Deconstructing the global adoption index into quarterly time series and segmenting by World Bank-defined income levels reveals a clear picture: high-income, upper-middle-income, and lower-middle-income groups all peak simultaneously in this report. This synchronicity indicates that the current cryptocurrency adoption wave is broad-based, rather than isolated, benefiting both mature markets with clearer regulations and institutional frameworks, and emerging markets experiencing accelerated adoption through remittances, stablecoin-enabled access to dollars, and mobile-first finance. In short, cryptocurrency adoption is truly global.
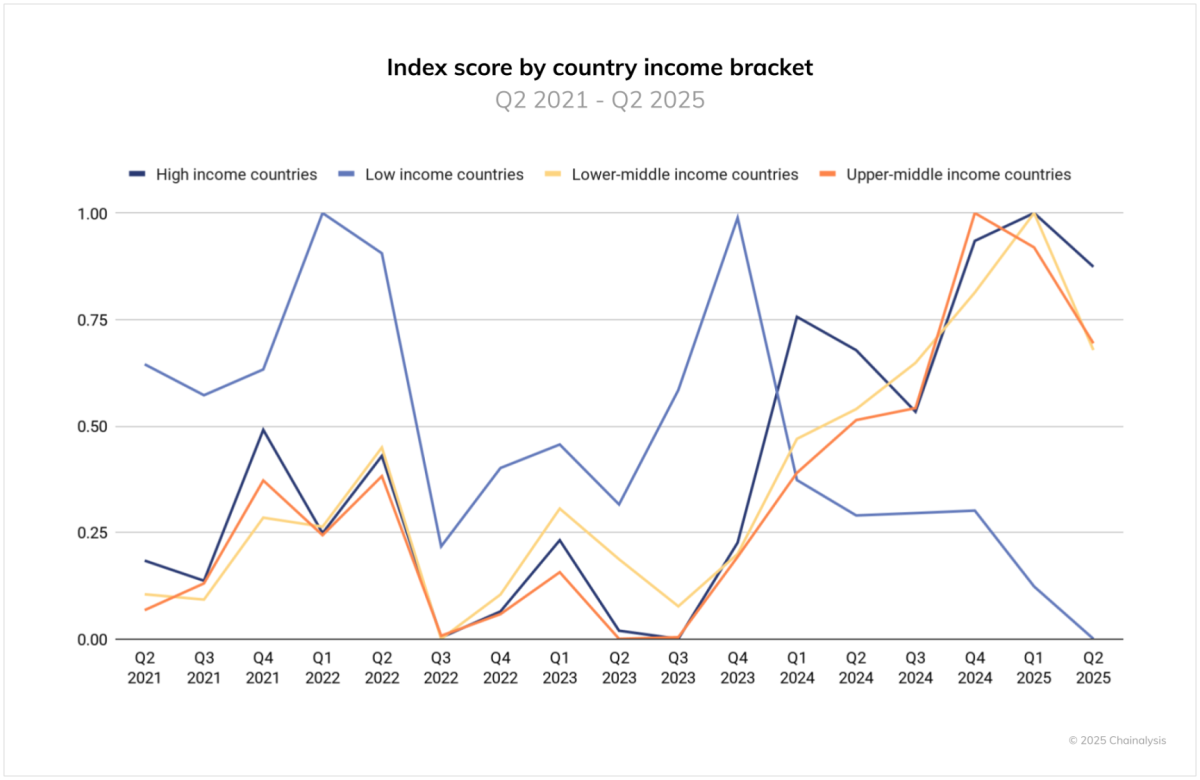
There’s a key caveat among low-income countries. This group includes several nations where sustained high levels of crypto usage aren’t typically expected, causing greater volatility: a brief surge followed by a decline. This stems from policy shocks, liquidity issues, and conflict-related disruptions. For instance, Chainalysis found that Afghanistan, a low-income country, temporarily lost all crypto activity after the 2021 U.S. withdrawal. The global peak signals are real, but trends in low-income countries are more fragile and unstable; sustainable growth there hinges on improved access, regulatory transparency, and basic financial and digital infrastructure.